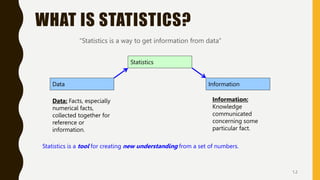
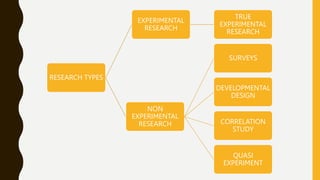
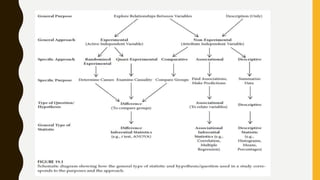
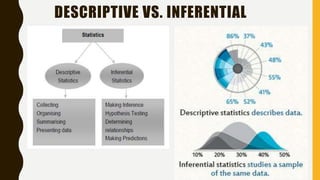
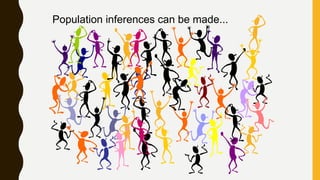
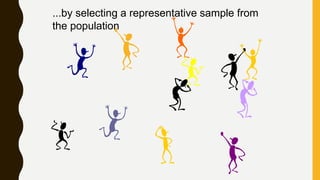
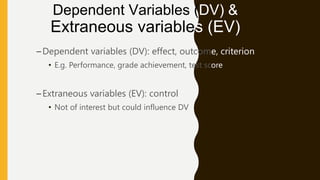
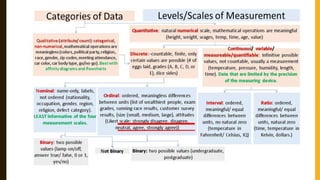
INTRODUCTION TO
STATISTICS
1.2
WHAT IS STATISTICS?
“Statistics is a way to get information from data”
Data
Statistics
Information
Data: Facts, especially
numerical facts,
collected together for
reference or
information.
Information:
Knowledge
communicated
concerning some
particular fact.
Statistics is a tool for creating new understanding from a set of numbers.
RESEARCH TYPES
EXPERIMENTAL
RESEARCH
TRUE
EXPERIMENTAL
RESEARCH
NON
EXPERIMENTAL
RESEARCH
SURVEYS
DEVELOPMENTAL
DESIGN
CORRELATION
STUDY
QUASI
EXPERIMENT
DESCRIPTIVE VS. INFERENTIAL
Population inferences can be made...
...by selecting a representative sample from
the population
WHAT IS A VARIABLE?
(PEMBOLEHUBAH)
What are variables you would consider in buying a
book?
DEFINITION
• A variable is some characteristic of a population or sample.
E.g. student grades.
Typically denoted with a capital letter: X, Y, Z…
• The values of the variable are the range of possible values for a
variable.
E.g. student marks (0..100)
• Data are the observed values of a variable.
E.g. student marks: {67, 74, 71, 83, 93, 55, 48}
•Independent variable
•Dependent variable
•Moderating variable
•Extraneous variable
Variable Type Key characteristic Example
Independent
variable (IV)
A variable that is presumed to cause
changes to occur in another variable;
a causal variable
Amount of studying (IV) affects
test grades (DV)
Dependent
variable (DV)
A variable that changes because of
another variable; the effect or
outcome variable
Amount of studying (IV) affects
test grades (DV)
Moderator
variable
A variable that delineates how a
relationship of interest changes
under different conditions or
circumstances
Perhaps the relationship
between studying (IV) and test
grades (DV) changes according
to the different levels of use of a
drug such as Ritalin (moderator)
Extraneous
variable
A variable that may compete with the
independent variable in explaining an
outcome
Pre-knowledege of topic that
was tested in the test
(confounding variable)
A VARIABLE
(PEMBOLEHUBAH)
• Characteristic
• Situation
• Has different values
– Age, gender, type of treatment/intervention, number of days to learn
something,
• Types
– Independent variables (IV)
• active/manipulated (eg workshop, new curriculum, intervention)
• Attribute/measured (cannot be manipulate eg level of edu, ecostatus, age)
– Dependent variables (DV)
– Moderator variables (MV)
– Extraneous variables (EV)
Independent variables (IV)
–Causes, influences, predictors,
–Active or manipulated IV (e.g new therapy vs traditional
treatment)
–Attribute or measured IV (e.g. race, marital status, age,
gender)
–One or more IV
–Has 2/more levels or values (nominal/ordinal) e.g. gender,
satisfaction
Dependent Variables (DV) &
Extraneous variables (EV)
–Dependent variables (DV): effect, outcome, criterion
• E.g. Performance, grade achievement, test score
–Extraneous variables (EV): control
• Not of interest but could influence DV
Groups/sets of variables
• (demographic, GRE, ILTES, TOFEL, SPM)
OPERATIONAL DEFINITION
• A precise definition of the way a variable will be
measured and/or manipulated in the research
Variable Operational definition Value
Intelligence Score on a Statistics test 90
Anxiety Score at or above 75th
percentile on measure
of anxiety
GAD-7
Memory Recall the number of
books read last month
4
MEASUREMENT SCALES
Senario
Satu kajian menggunakan pensampelan rawak dijalankan
terhadap penduduk di Kuala Lumpur dan penduduk di
Kuala Krai, Kelantan. Pengkaji telah merekodkan berat
sekumpulan penduduk wanita di kedua-dua lokasi
berikut. Nyatakan pemboleh ubah bersandar (DV) dan
pemboleh ubah bebas (pembolehubah tak bersandar) (IV)
kajian ini. Nyatakan jenis data bagi setiap pembolehubah.
Bina persoalan kajian yang bersesuaian.
ANALYZING OF LIKERT-TYPE
ITEMS (QUESTIONS)
&
LIKERT SCALE DATA (COMBINE)

intro statistics-khalid-20190816103032.pptx

  • 1.
  • 2.
    1.2 WHAT IS STATISTICS? “Statisticsis a way to get information from data” Data Statistics Information Data: Facts, especially numerical facts, collected together for reference or information. Information: Knowledge communicated concerning some particular fact. Statistics is a tool for creating new understanding from a set of numbers.
  • 4.
  • 6.
  • 7.
  • 8.
    ...by selecting arepresentative sample from the population
  • 9.
    WHAT IS AVARIABLE? (PEMBOLEHUBAH)
  • 10.
    What are variablesyou would consider in buying a book?
  • 11.
    DEFINITION • A variableis some characteristic of a population or sample. E.g. student grades. Typically denoted with a capital letter: X, Y, Z… • The values of the variable are the range of possible values for a variable. E.g. student marks (0..100) • Data are the observed values of a variable. E.g. student marks: {67, 74, 71, 83, 93, 55, 48}
  • 12.
    •Independent variable •Dependent variable •Moderatingvariable •Extraneous variable Variable Type Key characteristic Example Independent variable (IV) A variable that is presumed to cause changes to occur in another variable; a causal variable Amount of studying (IV) affects test grades (DV) Dependent variable (DV) A variable that changes because of another variable; the effect or outcome variable Amount of studying (IV) affects test grades (DV) Moderator variable A variable that delineates how a relationship of interest changes under different conditions or circumstances Perhaps the relationship between studying (IV) and test grades (DV) changes according to the different levels of use of a drug such as Ritalin (moderator) Extraneous variable A variable that may compete with the independent variable in explaining an outcome Pre-knowledege of topic that was tested in the test (confounding variable)
  • 13.
    A VARIABLE (PEMBOLEHUBAH) • Characteristic •Situation • Has different values – Age, gender, type of treatment/intervention, number of days to learn something, • Types – Independent variables (IV) • active/manipulated (eg workshop, new curriculum, intervention) • Attribute/measured (cannot be manipulate eg level of edu, ecostatus, age) – Dependent variables (DV) – Moderator variables (MV) – Extraneous variables (EV)
  • 14.
    Independent variables (IV) –Causes,influences, predictors, –Active or manipulated IV (e.g new therapy vs traditional treatment) –Attribute or measured IV (e.g. race, marital status, age, gender) –One or more IV –Has 2/more levels or values (nominal/ordinal) e.g. gender, satisfaction
  • 15.
    Dependent Variables (DV)& Extraneous variables (EV) –Dependent variables (DV): effect, outcome, criterion • E.g. Performance, grade achievement, test score –Extraneous variables (EV): control • Not of interest but could influence DV
  • 16.
    Groups/sets of variables •(demographic, GRE, ILTES, TOFEL, SPM)
  • 17.
    OPERATIONAL DEFINITION • Aprecise definition of the way a variable will be measured and/or manipulated in the research Variable Operational definition Value Intelligence Score on a Statistics test 90 Anxiety Score at or above 75th percentile on measure of anxiety GAD-7 Memory Recall the number of books read last month 4
  • 18.
  • 20.
    Senario Satu kajian menggunakanpensampelan rawak dijalankan terhadap penduduk di Kuala Lumpur dan penduduk di Kuala Krai, Kelantan. Pengkaji telah merekodkan berat sekumpulan penduduk wanita di kedua-dua lokasi berikut. Nyatakan pemboleh ubah bersandar (DV) dan pemboleh ubah bebas (pembolehubah tak bersandar) (IV) kajian ini. Nyatakan jenis data bagi setiap pembolehubah. Bina persoalan kajian yang bersesuaian.
  • 21.
    ANALYZING OF LIKERT-TYPE ITEMS(QUESTIONS) & LIKERT SCALE DATA (COMBINE)