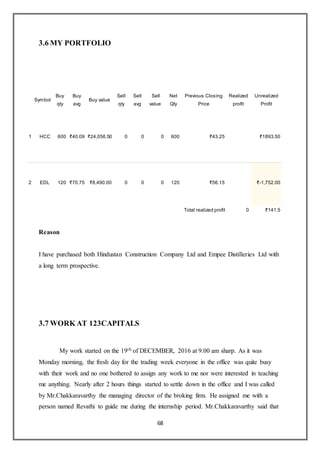
1. The document is a report submitted by Shanmugapriyan.M to Loyola College on an internship programme at 123CAPITALS, a share broking firm.
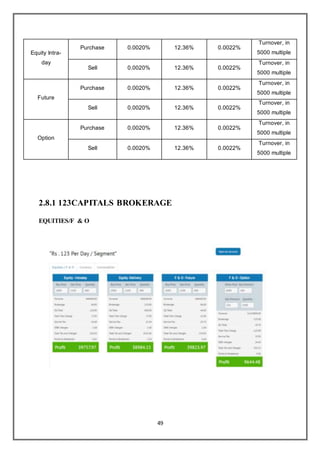
2. 123CAPITALS offers services like equity trading on NSE and BSE, derivatives, depository services, and online trading. It aims to simplify financial transactions through unique strategies and enhanced technology.
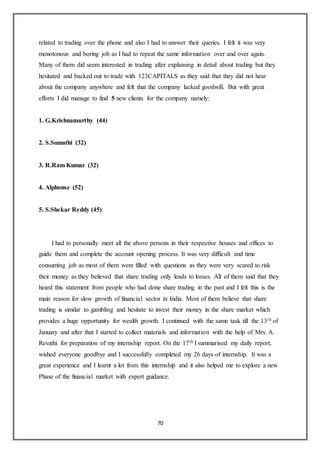
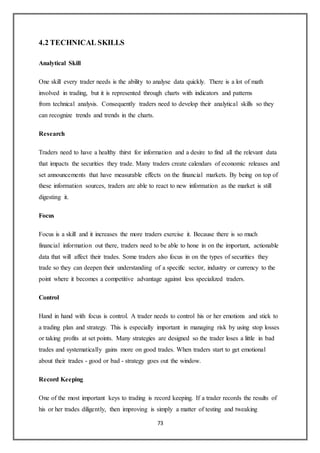
3. During the internship, Shanmugapriyan learned concepts related to stock markets, generated leads, analyzed client calls, interpreted trading data, and gained interpersonal and technical skills.