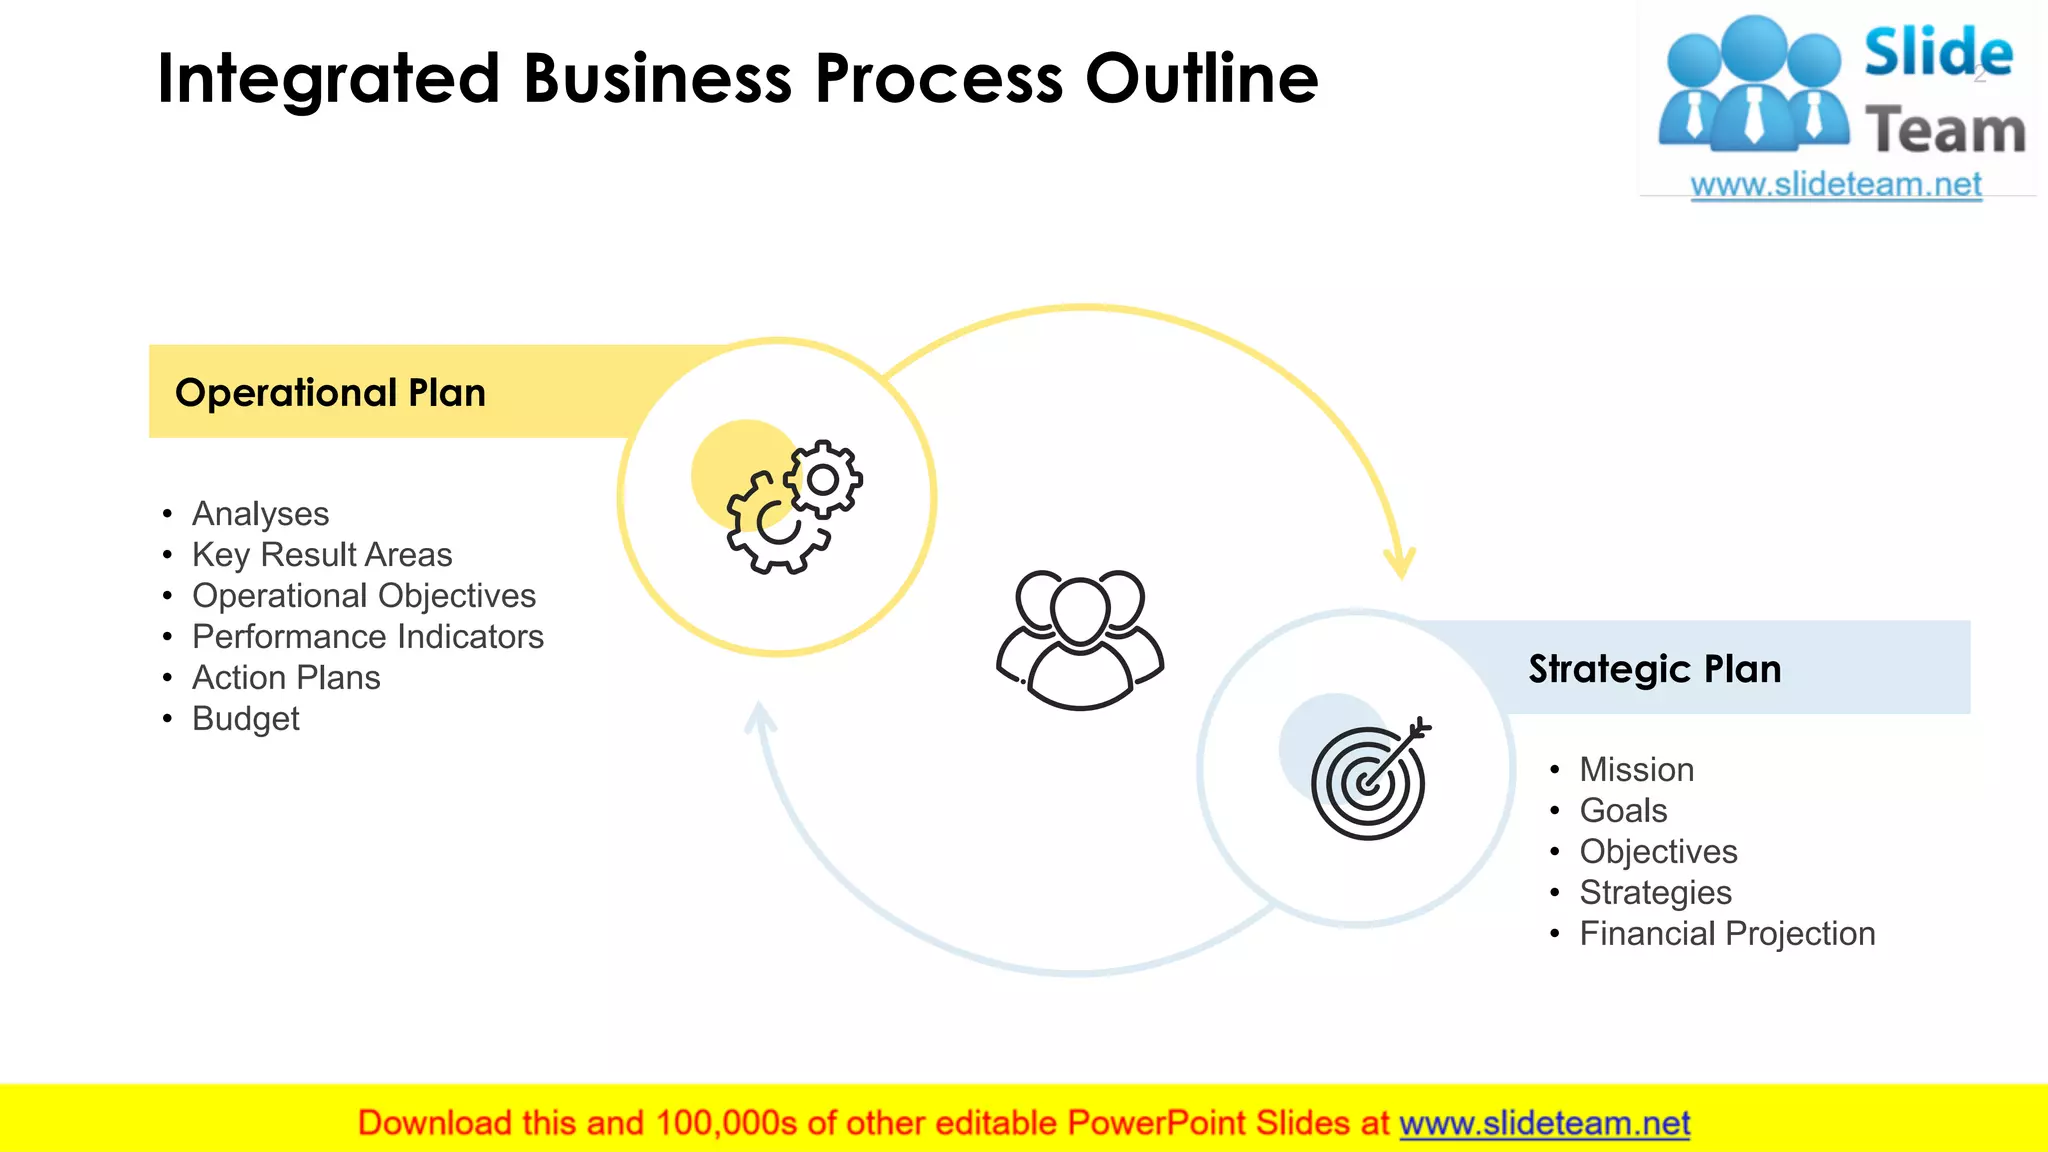
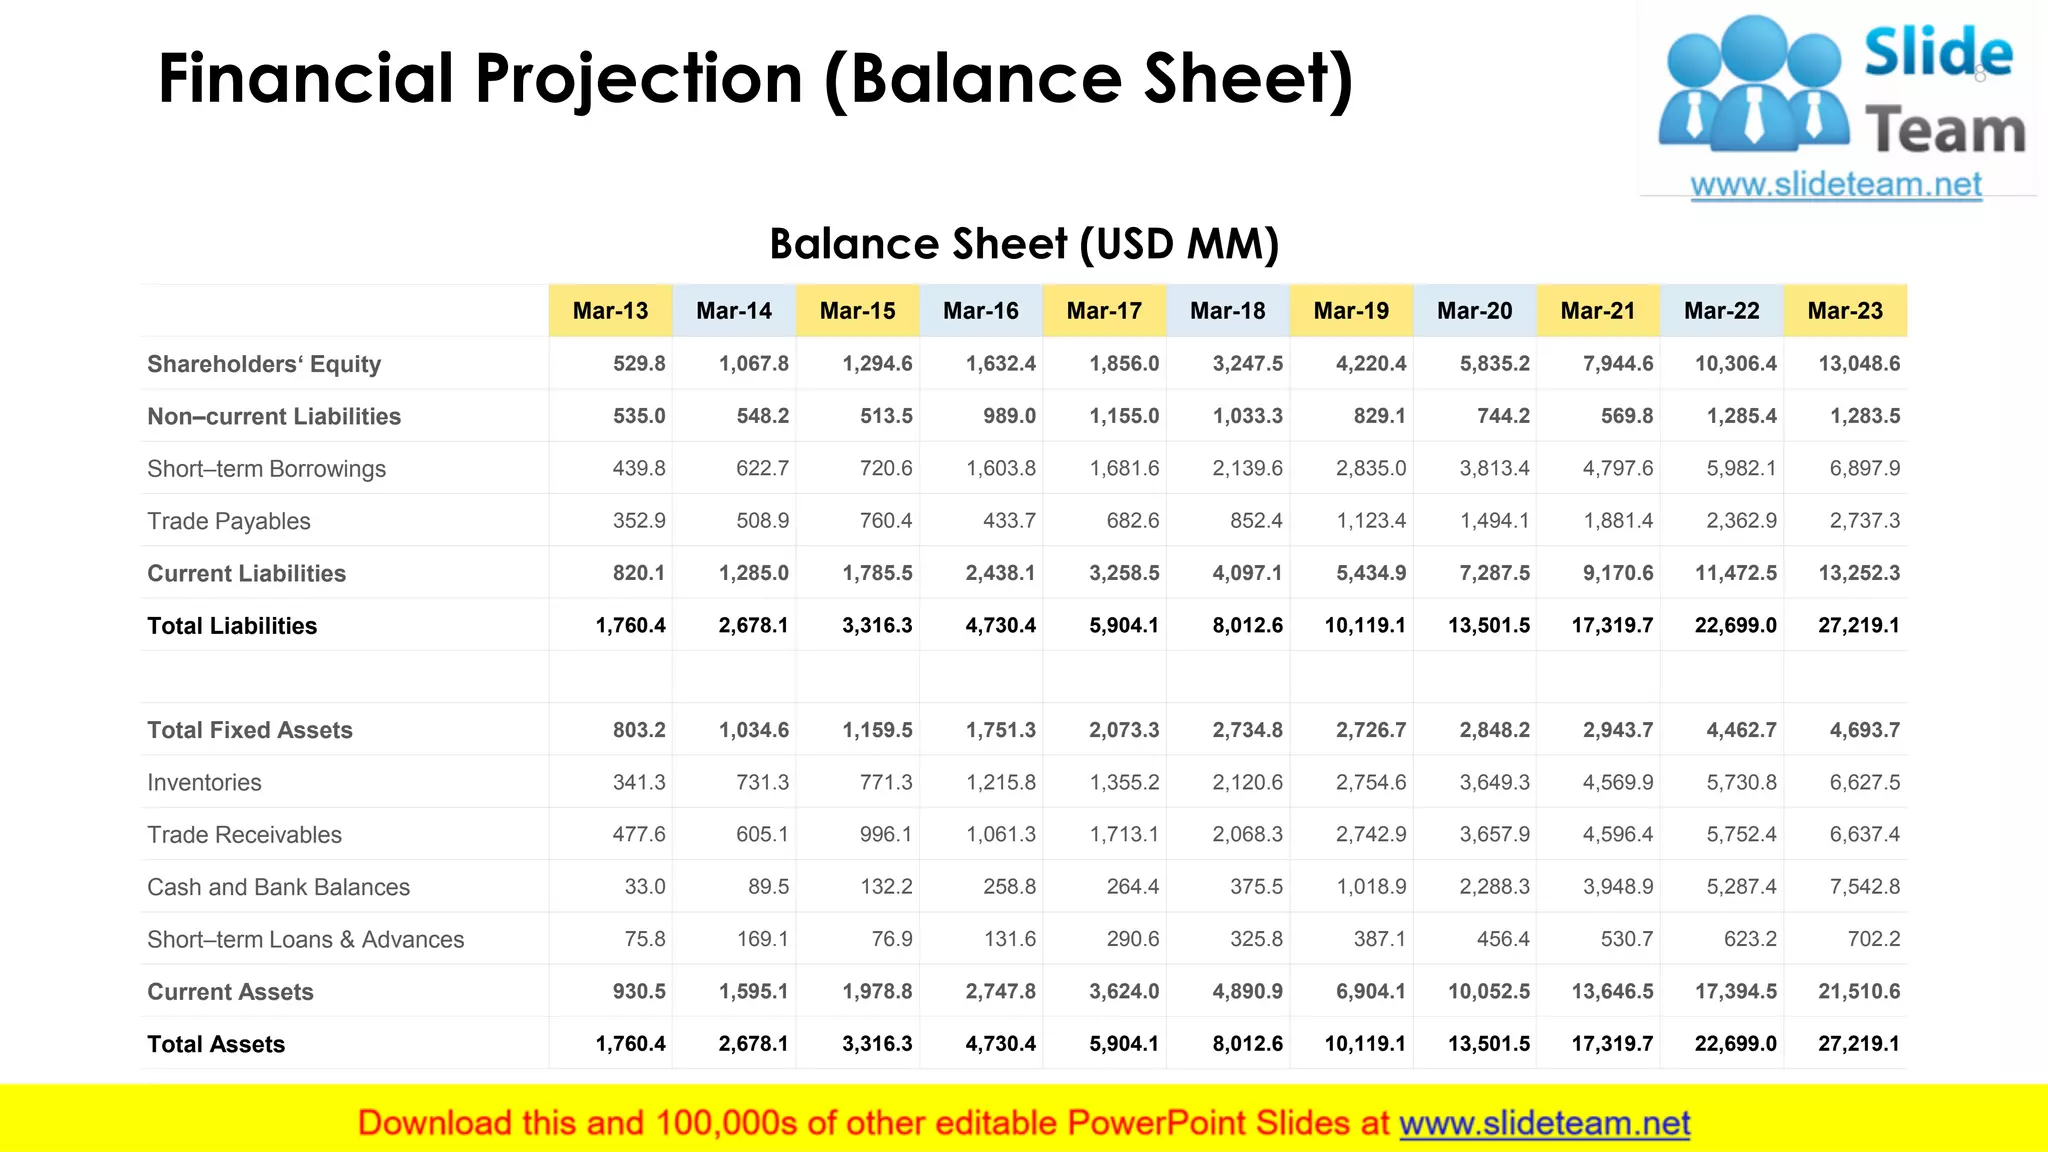
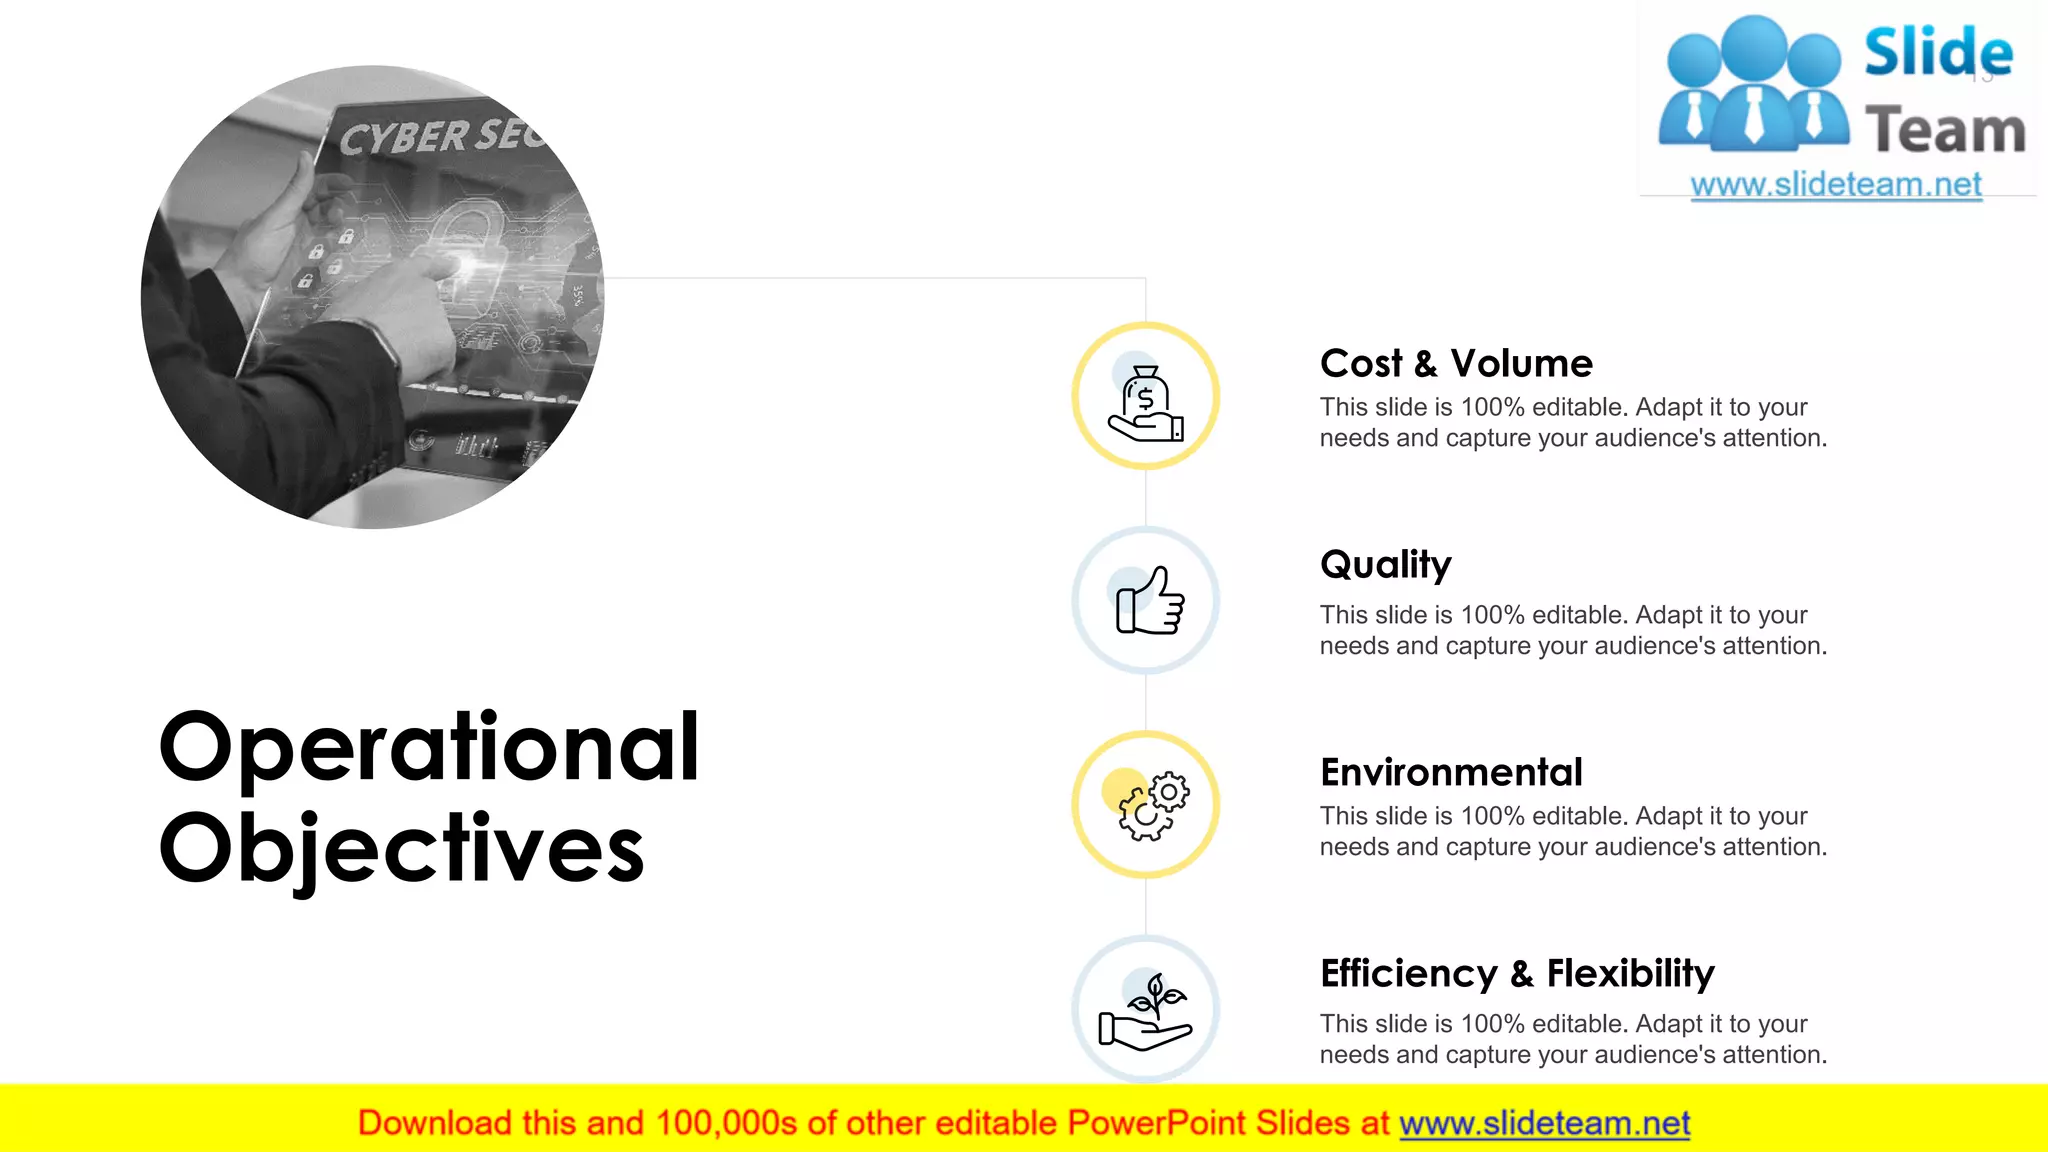
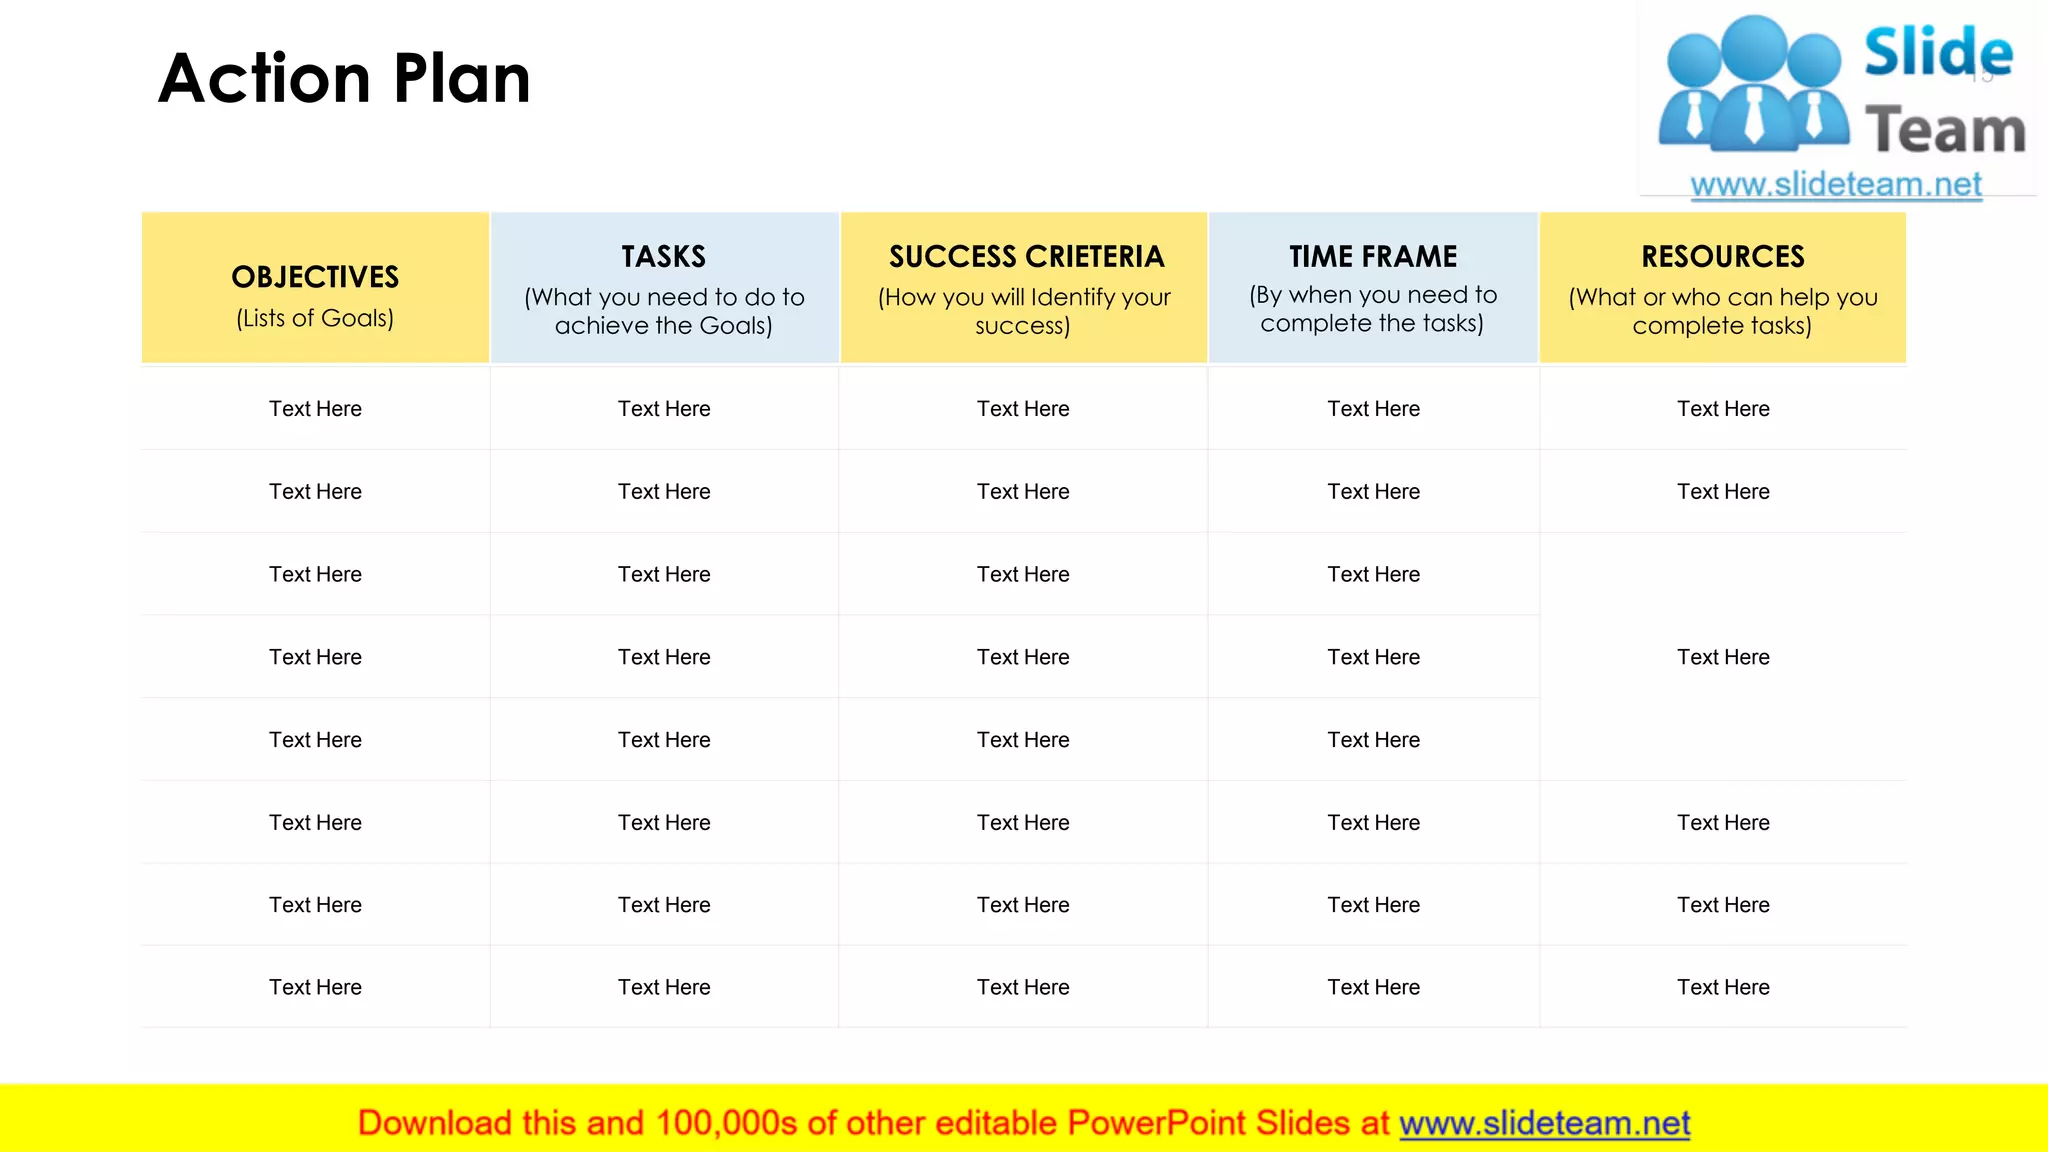
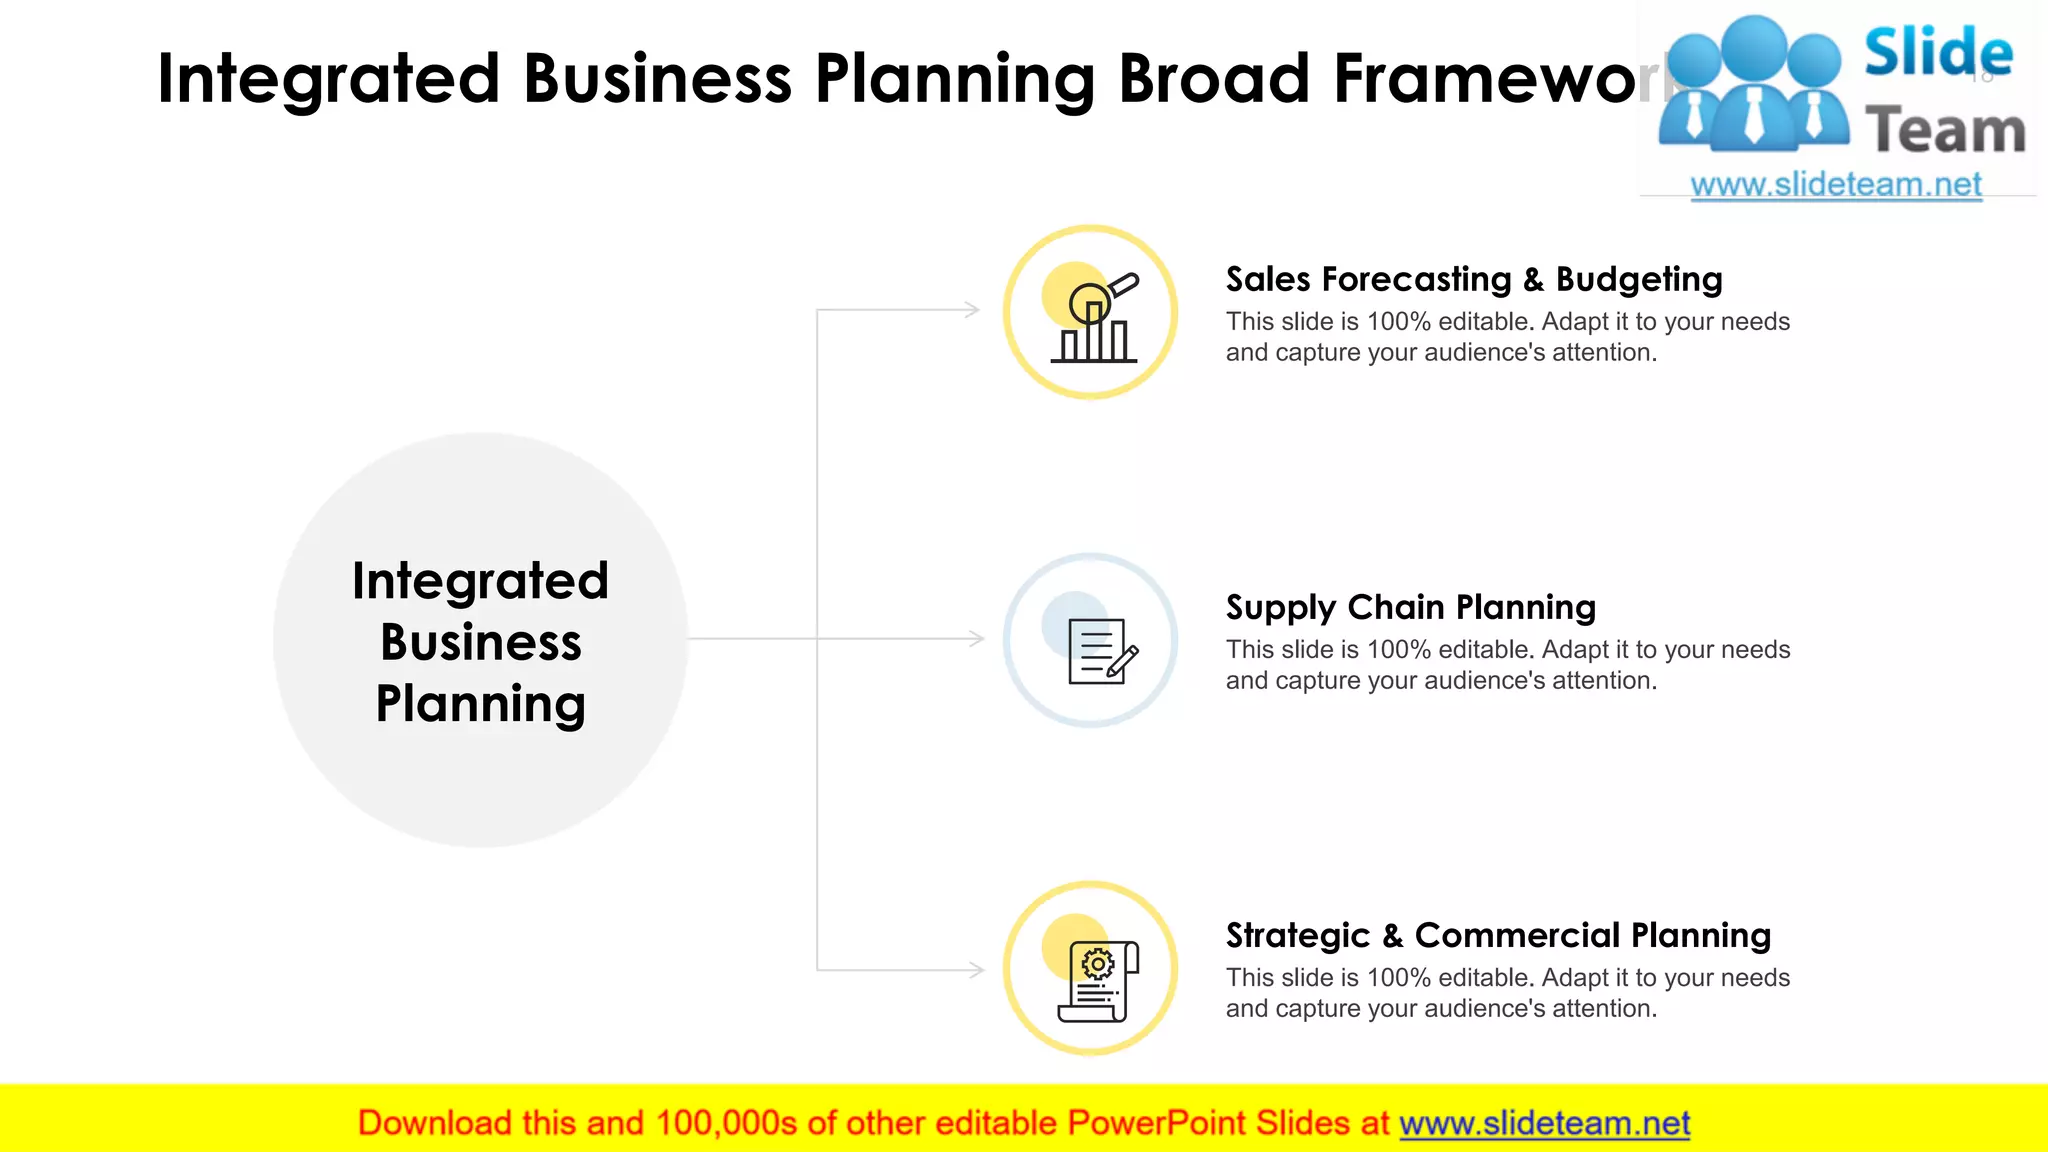
Integrated
Business
Planning
Framework
Your Company Name
Integrated Business Process Outline 2
This slide is 100% editable. Adapt it to your needs and capture your audience's attention.
Strategic Plan
• Mission
• Goals
• Objectives
• Strategies
• Financial Projection
Operational Plan
• Analyses
• Key Result Areas
• Operational Objectives
• Performance Indicators
• Action Plans
• Budget
Strategic Planning
3
Mission, Vision, Goals & Objectives 4
• How we gauge
or degree of
success
This slide is 100%
editable. Adapt it to
your needs and
capture your
audience's attention.
Goals &
Objectives
• What we want
to become
This slide is 100%
editable. Adapt it to
your needs and
capture your
audience's attention.
Vision
Statement
• How we will
achieve our
vision
This slide is 100%
editable. Adapt it to
your needs and
capture your
audience's attention.
Strategy
• Who we are
• What we value
This slide is 100%
editable. Adapt it to
your needs and
capture your
audience's attention.
Mission
Statement
Business Strategy 5
This slide is 100% editable. Adapt it to your needs and capture your audience's attention.
Competitive
Assessment
Analyzing the
Market
Optimizing the
Solution & Strategy
Identify the
Opportunity
Strategic
Planning
• Core
Competencies
• Current
Landscape
• New entrants
• Defining the
market
• Sizing the market
• Understanding the
trends
• Solution design
and features
• Positioning
• Quantifying ROI
• Market access
Strategy
• Unmet needs
• Differentiated
value proposition
• Opportunity
prioritization
• Forecasts and sales
models
• Pro forma financials
• Risks and
uncertainties.
Business Strategy 6
Competitive Assessment
• Core Competencies
• Current Landscape
• New entrants
Analyzing the Market
• Defining the market
• Sizing the market
• Understanding the trends
Optimizing the Solution & Strategy
• Solution design and features
• Positioning
• Quantifying ROI
• Market access Strategy
Identify the Opportunity
• Unmet needs
• Differentiated value proposition
• Opportunity prioritization
Strategic Planning
• Forecasts and sales models
• Pro forma financials
• Risks and uncertainties.
Financial Projection (Income Statement) 7
Mar-13 Mar-14 Mar-15 Mar-16 Mar-17 Mar-18 Mar-19 Mar-20 Mar-21 Mar-22 Mar-23
Net Sales 1,703.1 2,022.0 3,184.5 3,476.6 4,632.6 6,421.4 8,542.4 11,451.0 14,418.8 18,109.4 20,979.0
Expenses
Cost of Goods Sold 1,282.5 1,374.7 2,028.2 2,200.4 2,859.0 4,148.2 5,467.2 7,271.4 9,156.0 11,499.5 13,321.7
Employee Benefit Expense 92.1 128.4 155.6 226.5 280.5 321.1 507.2 583.9 675.3 875.4 962.3
Other Expenses 71.2 167.3 265.6 299.7 552.9 570.1 728.9 939.7 1,162.5 1,429.8 1,667.8
EBITDA 261.3 361.6 746.9 781.8 971.7 1,409.1 1,868.5 2,687.8 3,459.5 4,342.0 5,067.7
% EBITDA 15.3% 17.8% 23.4% 22.3% 20.8% 21.9% 21.8% 23.4% 23.9% 23.9% 24.1%
Financing cost 66.9 128.8 198.1 273.9 293.0 305.3 361.9 423.0 500.6 646.0 786.3
Profit After Tax 162.0 187.7 350.0 337.7 409.5 691.5 972.9 1,614.7 2,109.5 2,361.8 2,742.3
% PAT 9.5% 9.2% 11.0% 9.6% 8.8% 10.7% 11.4% 14.1% 14.6% 13.0% 13.0%
Financial Projection (Balance Sheet) 8
Balance Sheet (USD MM)
Mar-13 Mar-14 Mar-15 Mar-16 Mar-17 Mar-18 Mar-19 Mar-20 Mar-21 Mar-22 Mar-23
Shareholders‘ Equity 529.8 1,067.8 1,294.6 1,632.4 1,856.0 3,247.5 4,220.4 5,835.2 7,944.6 10,306.4 13,048.6
Non–current Liabilities 535.0 548.2 513.5 989.0 1,155.0 1,033.3 829.1 744.2 569.8 1,285.4 1,283.5
Short–term Borrowings 439.8 622.7 720.6 1,603.8 1,681.6 2,139.6 2,835.0 3,813.4 4,797.6 5,982.1 6,897.9
Trade Payables 352.9 508.9 760.4 433.7 682.6 852.4 1,123.4 1,494.1 1,881.4 2,362.9 2,737.3
Current Liabilities 820.1 1,285.0 1,785.5 2,438.1 3,258.5 4,097.1 5,434.9 7,287.5 9,170.6 11,472.5 13,252.3
Total Liabilities 1,760.4 2,678.1 3,316.3 4,730.4 5,904.1 8,012.6 10,119.1 13,501.5 17,319.7 22,699.0 27,219.1
Total Fixed Assets 803.2 1,034.6 1,159.5 1,751.3 2,073.3 2,734.8 2,726.7 2,848.2 2,943.7 4,462.7 4,693.7
Inventories 341.3 731.3 771.3 1,215.8 1,355.2 2,120.6 2,754.6 3,649.3 4,569.9 5,730.8 6,627.5
Trade Receivables 477.6 605.1 996.1 1,061.3 1,713.1 2,068.3 2,742.9 3,657.9 4,596.4 5,752.4 6,637.4
Cash and Bank Balances 33.0 89.5 132.2 258.8 264.4 375.5 1,018.9 2,288.3 3,948.9 5,287.4 7,542.8
Short–term Loans & Advances 75.8 169.1 76.9 131.6 290.6 325.8 387.1 456.4 530.7 623.2 702.2
Current Assets 930.5 1,595.1 1,978.8 2,747.8 3,624.0 4,890.9 6,904.1 10,052.5 13,646.5 17,394.5 21,510.6
Total Assets 1,760.4 2,678.1 3,316.3 4,730.4 5,904.1 8,012.6 10,119.1 13,501.5 17,319.7 22,699.0 27,219.1
Operational Plan
9
Business Operations Analysis 10
Key Ingredients
of the
Operational
Plan This slide is 100% editable. Adapt it to your needs and
capture your audience's attention.
Budgetary Information
This slide is 100% editable. Adapt it to your needs and
capture your audience's attention.
Consultation
This slide is 100% editable. Adapt it to your needs and
capture your audience's attention.
Training Plans
This slide is 100% editable. Adapt it to your needs and
capture your audience's attention.
Facility Use Schedules
This slide is 100% editable. Adapt it to your needs and
capture your audience's attention.
Calendar of Events
This slide is 100% editable. Adapt it to your needs and
capture your audience's attention.
Maintenance Schedules
Key Result Areas 11
Develop and implement a performance
management system
Provide an effective awareness and
communication support programme for the system
Develop a feedback system to management, departments
and employees as a basis for improving performance
Business
Operations
KEY RESULT
AREA 1
KEY RESULT
AREA2
KEY RESULT
AREA3
Operational Objectives 12
Cost & Volume
This slide is 100% editable. Adapt
it to your needs and capture your
audience's attention.
Quality
This slide is 100% editable. Adapt
it to your needs and capture your
audience's attention.
Environmental
This slide is 100% editable. Adapt
it to your needs and capture your
audience's attention.
Efficiency & Flexibility
This slide is 100% editable. Adapt
it to your needs and capture your
audience's attention.
Cost & Volume
This slide is 100% editable. Adapt it to your
needs and capture your audience's attention.
Quality
This slide is 100% editable. Adapt it to your
needs and capture your audience's attention.
Environmental
This slide is 100% editable. Adapt it to your
needs and capture your audience's attention.
Efficiency & Flexibility
This slide is 100% editable. Adapt it to your
needs and capture your audience's attention.
Operational
Objectives
13
Performance Objectives 14
Fixed Asset
Turnover
Revenue /
Average net fixed Assets
How effectively a business generates
revenue from its Fixed Assets 6.7
Revenue /
Average Working Capital
How effectively a business generates
revenue from its Working Capital 12.5
Working Capital
Turnover
Revenue /
Average Total Assets
How effectively a business generates
revenue from its Total Assets 2.3
Total Asset
Turnover
This slide is 100% editable. Adapt it to your needs and capture your audience's attention.
Action Plan 15
Text Here Text Here Text Here Text Here Text Here
Text Here Text Here Text Here Text Here
Text HereText Here Text Here Text Here Text Here
Text Here Text Here Text Here Text Here
Text Here Text Here Text Here Text Here Text Here
OBJECTIVES
TASKS SUCCESS CRIETERIA TIME FRAME RESOURCES
(Lists of Goals)
(What you need to do to
achieve the Goals)
(How you will Identify your
success)
(By when you need to
complete the tasks)
(What or who can help you
complete tasks)
This slide is 100% editable. Adapt it to your needs and capture your audience's attention.
Budget 16
Component 1 96 98 124
Component 2 312 283 342
Component 3 214 238 242
Component 4 1 8 8
Component 5 16 57 63
Component 6 331 1 22
Component 7 8 1,549
Total 1500 2398 1225
Agency
FY 2015 Budget
Enacted ($M)
FY 2016 Budget
Enacted ($M)
FY 2017 Budget
Requested ($M)
This slide is 100% editable. Adapt it to your needs and capture your audience's attention.
Overview of Integrated Business Planning 17
Sales Revenue Planning
• New Product Planning
• Sales Opportunity Planning
Demand Planning
• Demand Forecasting
• Demand Collaboration (Sales,
Marketing, Operations input)
Supply Planning
• Capacity Planning (Labor Leveling,
Resource Planning)
Profit Based Supply/
Demand Balancing
• Product Mix
• Constraints Management
• What if Analysis
Management Review
• KPI Measurement
• Working Capital
• Gross Margins
Integrated Business Planning Broad Framework 18
Sales Forecasting & Budgeting
This slide is 100% editable. Adapt it to your needs
and capture your audience's attention.
Strategic & Commercial Planning
This slide is 100% editable. Adapt it to your needs
and capture your audience's attention.
Supply Chain Planning
This slide is 100% editable. Adapt it to your needs
and capture your audience's attention.
Integrated
Business
Planning
Integrated Planning Process 19
Rewards,
Consequences and actions
Strategic Initiatives and
their ownership
Set Business
Targets
Performance
Dialogues
Plan, report and
Forecast Company performance
Strategic Direction
and Context
Measure
Value
Integrated Planning Framework 20
Strategic
Planning
Program
Planning
Business
Planning
Human Resource Planning
This slide is 100% editable. Adapt it to your
needs and capture your audience's attention.
Technology Planning
This slide is 100% editable. Adapt it to your
needs and capture your audience's attention.
Facility Planning
This slide is 100% editable. Adapt it to your
needs and capture your audience's attention.
Organizational Development
This slide is 100% editable. Adapt it to your
needs and capture your audience's attention.
Identity & Branding
This slide is 100% editable. Adapt it to your
needs and capture your audience's attention.
Advancement Planning
This slide is 100% editable. Adapt it to your
needs and capture your audience's attention.
Integrated Business Planning Framework Icons Slide 21
22
Additional Slides
Our Mission
23
Vision
This slide is 100% editable. Adapt
it to your needs and capture your
audience's attention.
Mission
This slide is 100% editable. Adapt
it to your needs and capture your
audience's attention.
Goal
This slide is 100% editable. Adapt
it to your needs and capture your
audience's attention.
Puzzle 24
01
0203
04
Text Here
This slide is 100% editable. Adapt it
to your needs and capture your
audience's attention.
Text Here
This slide is 100% editable. Adapt it
to your needs and capture your
audience's attention.
Text Here
This slide is 100% editable. Adapt it
to your needs and capture your
audience's attention.
Text Here
This slide is 100% editable. Adapt it
to your needs and capture your
audience's attention.
Quotes
25
It’s not just about being better. It’s about being
different. You need to give people a reason to
choose your business.
…Tom Abbott
26
Name Here
Designation
This slide is 100% editable. Adapt it to your
needs and capture your audience's attention.
Name Here
Designation
This slide is 100% editable. Adapt it to your
needs and capture your audience's attention.
Our Team
Comparison 27
Male
85%
This slide is 100% editable. Adapt
it to your needs and capture your
audience's attention.
Female
55%
This slide is 100% editable. Adapt
it to your needs and capture your
audience's attention.
Timeline 28
This slide is 100% editable. Adapt
it to your needs and capture your
audience's attention.
This slide is 100% editable. Adapt
it to your needs and capture your
audience's attention.
This slide is 100% editable. Adapt
it to your needs and capture your
audience's attention.
This slide is 100% editable. Adapt
it to your needs and capture your
audience's attention.
This slide is 100% editable. Adapt
it to your needs and capture your
audience's attention.
This slide is 100% editable. Adapt
it to your needs and capture your
audience's attention.
2014 2016 2018
2015 2017 2019
29
This slide is 100% editable. Adapt it to your
needs and capture your audience's attention.
Deposits
$423
This slide is 100% editable. Adapt it to your
needs and capture your audience's attention.
Net Income
$345Financial
Venn 30
This slide is 100% editable. Adapt it
to your needs and capture your
audience's attention
This slide is 100% editable. Adapt it
to your needs and capture your
audience's attention
This slide is 100% editable. Adapt it
to your needs and capture your
audience's attention
This slide is 100% editable. Adapt it
to your needs and capture your
audience's attention
This slide is 100% editable. Adapt it
to your needs and capture your
audience's attention
01
02
03
04
05
Stacked Column 31
This graph/chart is linked to excel, and changes automatically based on data. Just left click on it and select “Edit Data”.
30 40
60
80
100
120
140
180
200
80
110
140
170
206
230
260
270
370
0
50
100
150
200
250
300
350
400
450
500
550
600
2011 2012 2013 2014 2015 2016 2017 2018 2019
Product 01
Product 02
Stacked Bar 32
50%
65%
-15%
-9%
40%
50%
-19%
-2%
-30% -20% -10% 0% 10% 20% 30% 40% 50% 60% 70%
This graph/chart is linked to excel, and changes automatically based on data. Just left click on it and select “Edit Data”.
Product 01
Product 02
33
Thank You
Address:
# street number, city, state
Contact Number:
0123456789
Email Address:
emailaddress123@gmail.com

Integrated Business Planning Framework PowerPoint Presentation Slides

  • 1.
  • 2.
    Integrated Business ProcessOutline 2 This slide is 100% editable. Adapt it to your needs and capture your audience's attention. Strategic Plan • Mission • Goals • Objectives • Strategies • Financial Projection Operational Plan • Analyses • Key Result Areas • Operational Objectives • Performance Indicators • Action Plans • Budget
  • 3.
  • 4.
    Mission, Vision, Goals& Objectives 4 • How we gauge or degree of success This slide is 100% editable. Adapt it to your needs and capture your audience's attention. Goals & Objectives • What we want to become This slide is 100% editable. Adapt it to your needs and capture your audience's attention. Vision Statement • How we will achieve our vision This slide is 100% editable. Adapt it to your needs and capture your audience's attention. Strategy • Who we are • What we value This slide is 100% editable. Adapt it to your needs and capture your audience's attention. Mission Statement
  • 5.
    Business Strategy 5 Thisslide is 100% editable. Adapt it to your needs and capture your audience's attention. Competitive Assessment Analyzing the Market Optimizing the Solution & Strategy Identify the Opportunity Strategic Planning • Core Competencies • Current Landscape • New entrants • Defining the market • Sizing the market • Understanding the trends • Solution design and features • Positioning • Quantifying ROI • Market access Strategy • Unmet needs • Differentiated value proposition • Opportunity prioritization • Forecasts and sales models • Pro forma financials • Risks and uncertainties.
  • 6.
    Business Strategy 6 CompetitiveAssessment • Core Competencies • Current Landscape • New entrants Analyzing the Market • Defining the market • Sizing the market • Understanding the trends Optimizing the Solution & Strategy • Solution design and features • Positioning • Quantifying ROI • Market access Strategy Identify the Opportunity • Unmet needs • Differentiated value proposition • Opportunity prioritization Strategic Planning • Forecasts and sales models • Pro forma financials • Risks and uncertainties.
  • 7.
    Financial Projection (IncomeStatement) 7 Mar-13 Mar-14 Mar-15 Mar-16 Mar-17 Mar-18 Mar-19 Mar-20 Mar-21 Mar-22 Mar-23 Net Sales 1,703.1 2,022.0 3,184.5 3,476.6 4,632.6 6,421.4 8,542.4 11,451.0 14,418.8 18,109.4 20,979.0 Expenses Cost of Goods Sold 1,282.5 1,374.7 2,028.2 2,200.4 2,859.0 4,148.2 5,467.2 7,271.4 9,156.0 11,499.5 13,321.7 Employee Benefit Expense 92.1 128.4 155.6 226.5 280.5 321.1 507.2 583.9 675.3 875.4 962.3 Other Expenses 71.2 167.3 265.6 299.7 552.9 570.1 728.9 939.7 1,162.5 1,429.8 1,667.8 EBITDA 261.3 361.6 746.9 781.8 971.7 1,409.1 1,868.5 2,687.8 3,459.5 4,342.0 5,067.7 % EBITDA 15.3% 17.8% 23.4% 22.3% 20.8% 21.9% 21.8% 23.4% 23.9% 23.9% 24.1% Financing cost 66.9 128.8 198.1 273.9 293.0 305.3 361.9 423.0 500.6 646.0 786.3 Profit After Tax 162.0 187.7 350.0 337.7 409.5 691.5 972.9 1,614.7 2,109.5 2,361.8 2,742.3 % PAT 9.5% 9.2% 11.0% 9.6% 8.8% 10.7% 11.4% 14.1% 14.6% 13.0% 13.0%
  • 8.
    Financial Projection (BalanceSheet) 8 Balance Sheet (USD MM) Mar-13 Mar-14 Mar-15 Mar-16 Mar-17 Mar-18 Mar-19 Mar-20 Mar-21 Mar-22 Mar-23 Shareholders‘ Equity 529.8 1,067.8 1,294.6 1,632.4 1,856.0 3,247.5 4,220.4 5,835.2 7,944.6 10,306.4 13,048.6 Non–current Liabilities 535.0 548.2 513.5 989.0 1,155.0 1,033.3 829.1 744.2 569.8 1,285.4 1,283.5 Short–term Borrowings 439.8 622.7 720.6 1,603.8 1,681.6 2,139.6 2,835.0 3,813.4 4,797.6 5,982.1 6,897.9 Trade Payables 352.9 508.9 760.4 433.7 682.6 852.4 1,123.4 1,494.1 1,881.4 2,362.9 2,737.3 Current Liabilities 820.1 1,285.0 1,785.5 2,438.1 3,258.5 4,097.1 5,434.9 7,287.5 9,170.6 11,472.5 13,252.3 Total Liabilities 1,760.4 2,678.1 3,316.3 4,730.4 5,904.1 8,012.6 10,119.1 13,501.5 17,319.7 22,699.0 27,219.1 Total Fixed Assets 803.2 1,034.6 1,159.5 1,751.3 2,073.3 2,734.8 2,726.7 2,848.2 2,943.7 4,462.7 4,693.7 Inventories 341.3 731.3 771.3 1,215.8 1,355.2 2,120.6 2,754.6 3,649.3 4,569.9 5,730.8 6,627.5 Trade Receivables 477.6 605.1 996.1 1,061.3 1,713.1 2,068.3 2,742.9 3,657.9 4,596.4 5,752.4 6,637.4 Cash and Bank Balances 33.0 89.5 132.2 258.8 264.4 375.5 1,018.9 2,288.3 3,948.9 5,287.4 7,542.8 Short–term Loans & Advances 75.8 169.1 76.9 131.6 290.6 325.8 387.1 456.4 530.7 623.2 702.2 Current Assets 930.5 1,595.1 1,978.8 2,747.8 3,624.0 4,890.9 6,904.1 10,052.5 13,646.5 17,394.5 21,510.6 Total Assets 1,760.4 2,678.1 3,316.3 4,730.4 5,904.1 8,012.6 10,119.1 13,501.5 17,319.7 22,699.0 27,219.1
  • 9.
  • 10.
    Business Operations Analysis10 Key Ingredients of the Operational Plan This slide is 100% editable. Adapt it to your needs and capture your audience's attention. Budgetary Information This slide is 100% editable. Adapt it to your needs and capture your audience's attention. Consultation This slide is 100% editable. Adapt it to your needs and capture your audience's attention. Training Plans This slide is 100% editable. Adapt it to your needs and capture your audience's attention. Facility Use Schedules This slide is 100% editable. Adapt it to your needs and capture your audience's attention. Calendar of Events This slide is 100% editable. Adapt it to your needs and capture your audience's attention. Maintenance Schedules
  • 11.
    Key Result Areas11 Develop and implement a performance management system Provide an effective awareness and communication support programme for the system Develop a feedback system to management, departments and employees as a basis for improving performance Business Operations KEY RESULT AREA 1 KEY RESULT AREA2 KEY RESULT AREA3
  • 12.
    Operational Objectives 12 Cost& Volume This slide is 100% editable. Adapt it to your needs and capture your audience's attention. Quality This slide is 100% editable. Adapt it to your needs and capture your audience's attention. Environmental This slide is 100% editable. Adapt it to your needs and capture your audience's attention. Efficiency & Flexibility This slide is 100% editable. Adapt it to your needs and capture your audience's attention.
  • 13.
    Cost & Volume Thisslide is 100% editable. Adapt it to your needs and capture your audience's attention. Quality This slide is 100% editable. Adapt it to your needs and capture your audience's attention. Environmental This slide is 100% editable. Adapt it to your needs and capture your audience's attention. Efficiency & Flexibility This slide is 100% editable. Adapt it to your needs and capture your audience's attention. Operational Objectives 13
  • 14.
    Performance Objectives 14 FixedAsset Turnover Revenue / Average net fixed Assets How effectively a business generates revenue from its Fixed Assets 6.7 Revenue / Average Working Capital How effectively a business generates revenue from its Working Capital 12.5 Working Capital Turnover Revenue / Average Total Assets How effectively a business generates revenue from its Total Assets 2.3 Total Asset Turnover This slide is 100% editable. Adapt it to your needs and capture your audience's attention.
  • 15.
    Action Plan 15 TextHere Text Here Text Here Text Here Text Here Text Here Text Here Text Here Text Here Text Here Text Here Text Here Text Here Text Here Text HereText Here Text Here Text Here Text Here Text Here Text Here Text Here Text Here Text Here Text Here Text Here Text Here Text Here Text Here Text Here Text Here Text Here Text Here Text Here Text Here Text Here Text Here Text Here OBJECTIVES TASKS SUCCESS CRIETERIA TIME FRAME RESOURCES (Lists of Goals) (What you need to do to achieve the Goals) (How you will Identify your success) (By when you need to complete the tasks) (What or who can help you complete tasks) This slide is 100% editable. Adapt it to your needs and capture your audience's attention.
  • 16.
    Budget 16 Component 196 98 124 Component 2 312 283 342 Component 3 214 238 242 Component 4 1 8 8 Component 5 16 57 63 Component 6 331 1 22 Component 7 8 1,549 Total 1500 2398 1225 Agency FY 2015 Budget Enacted ($M) FY 2016 Budget Enacted ($M) FY 2017 Budget Requested ($M) This slide is 100% editable. Adapt it to your needs and capture your audience's attention.
  • 17.
    Overview of IntegratedBusiness Planning 17 Sales Revenue Planning • New Product Planning • Sales Opportunity Planning Demand Planning • Demand Forecasting • Demand Collaboration (Sales, Marketing, Operations input) Supply Planning • Capacity Planning (Labor Leveling, Resource Planning) Profit Based Supply/ Demand Balancing • Product Mix • Constraints Management • What if Analysis Management Review • KPI Measurement • Working Capital • Gross Margins
  • 18.
    Integrated Business PlanningBroad Framework 18 Sales Forecasting & Budgeting This slide is 100% editable. Adapt it to your needs and capture your audience's attention. Strategic & Commercial Planning This slide is 100% editable. Adapt it to your needs and capture your audience's attention. Supply Chain Planning This slide is 100% editable. Adapt it to your needs and capture your audience's attention. Integrated Business Planning
  • 19.
    Integrated Planning Process19 Rewards, Consequences and actions Strategic Initiatives and their ownership Set Business Targets Performance Dialogues Plan, report and Forecast Company performance Strategic Direction and Context Measure Value
  • 20.
    Integrated Planning Framework20 Strategic Planning Program Planning Business Planning Human Resource Planning This slide is 100% editable. Adapt it to your needs and capture your audience's attention. Technology Planning This slide is 100% editable. Adapt it to your needs and capture your audience's attention. Facility Planning This slide is 100% editable. Adapt it to your needs and capture your audience's attention. Organizational Development This slide is 100% editable. Adapt it to your needs and capture your audience's attention. Identity & Branding This slide is 100% editable. Adapt it to your needs and capture your audience's attention. Advancement Planning This slide is 100% editable. Adapt it to your needs and capture your audience's attention.
  • 21.
    Integrated Business PlanningFramework Icons Slide 21
  • 22.
  • 23.
    Our Mission 23 Vision This slideis 100% editable. Adapt it to your needs and capture your audience's attention. Mission This slide is 100% editable. Adapt it to your needs and capture your audience's attention. Goal This slide is 100% editable. Adapt it to your needs and capture your audience's attention.
  • 24.
    Puzzle 24 01 0203 04 Text Here Thisslide is 100% editable. Adapt it to your needs and capture your audience's attention. Text Here This slide is 100% editable. Adapt it to your needs and capture your audience's attention. Text Here This slide is 100% editable. Adapt it to your needs and capture your audience's attention. Text Here This slide is 100% editable. Adapt it to your needs and capture your audience's attention.
  • 25.
    Quotes 25 It’s not justabout being better. It’s about being different. You need to give people a reason to choose your business. …Tom Abbott
  • 26.
    26 Name Here Designation This slideis 100% editable. Adapt it to your needs and capture your audience's attention. Name Here Designation This slide is 100% editable. Adapt it to your needs and capture your audience's attention. Our Team
  • 27.
    Comparison 27 Male 85% This slideis 100% editable. Adapt it to your needs and capture your audience's attention. Female 55% This slide is 100% editable. Adapt it to your needs and capture your audience's attention.
  • 28.
    Timeline 28 This slideis 100% editable. Adapt it to your needs and capture your audience's attention. This slide is 100% editable. Adapt it to your needs and capture your audience's attention. This slide is 100% editable. Adapt it to your needs and capture your audience's attention. This slide is 100% editable. Adapt it to your needs and capture your audience's attention. This slide is 100% editable. Adapt it to your needs and capture your audience's attention. This slide is 100% editable. Adapt it to your needs and capture your audience's attention. 2014 2016 2018 2015 2017 2019
  • 29.
    29 This slide is100% editable. Adapt it to your needs and capture your audience's attention. Deposits $423 This slide is 100% editable. Adapt it to your needs and capture your audience's attention. Net Income $345Financial
  • 30.
    Venn 30 This slideis 100% editable. Adapt it to your needs and capture your audience's attention This slide is 100% editable. Adapt it to your needs and capture your audience's attention This slide is 100% editable. Adapt it to your needs and capture your audience's attention This slide is 100% editable. Adapt it to your needs and capture your audience's attention This slide is 100% editable. Adapt it to your needs and capture your audience's attention 01 02 03 04 05
  • 31.
    Stacked Column 31 Thisgraph/chart is linked to excel, and changes automatically based on data. Just left click on it and select “Edit Data”. 30 40 60 80 100 120 140 180 200 80 110 140 170 206 230 260 270 370 0 50 100 150 200 250 300 350 400 450 500 550 600 2011 2012 2013 2014 2015 2016 2017 2018 2019 Product 01 Product 02
  • 32.
    Stacked Bar 32 50% 65% -15% -9% 40% 50% -19% -2% -30%-20% -10% 0% 10% 20% 30% 40% 50% 60% 70% This graph/chart is linked to excel, and changes automatically based on data. Just left click on it and select “Edit Data”. Product 01 Product 02
  • 33.
    33 Thank You Address: # streetnumber, city, state Contact Number: 0123456789 Email Address: emailaddress123@gmail.com