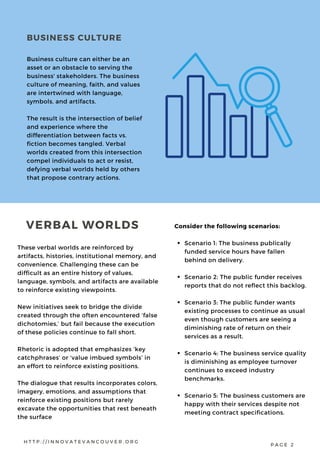
INNOVATE VANCOUVER
DATA DRIVEN BUSINESS MODELS
WHITEPAPER
P R E P A R E D B Y T R A V I S B A R K E R , M P A
C O N S U L T I N G @ I N N O V A T E V A N C O U V E R . O R G
H T T P : / / I N N O V A T E V A N C O U V E R . O R G
Innovate Vancouver is a Technology
& Business Innovation Consulting
Service (TBICS) located in Vancouver,
BC.
Travis Barker, MPA GCPM
Email: Consulting@innovatevancouv
er.org
Phone: (778) 829-5643
About Us
Our Vision:
To help every business become
innovative, exceed stakeholder
expectations, and strengthen the
business’ positive impact across the
communities and industries they
serve.
Our Values:
Covering over 10 years experience
in system wide projects and business
planning emphasizing the nonprofit
and for profit industries. We recognize
that a cookie-cutter approach will not
solve most business’ problems and so
our team focuses on working together
with our customers to create
individually tailored solutions to fit
your business needs.
Our Belief:
Innovation is built on opportunity. In
order to recognize a business
opportunity – out of the box thinking,
feedback, collaboration, creative
assets, and a  system’s thinking
approach is often needed.
ABOUT INNOVATE VANCOUVER
H T T P : / / I N N O V A T E V A N C O U V E R . O R G P A G E 1
Scenario 1: The business publically
funded service hours have fallen
behind on delivery.
Scenario 2: The public funder receives
reports that do not reflect this backlog.
Scenario 3: The public funder wants
existing processes to continue as usual
even though customers are seeing a
diminishing rate of return on their
services as a result.
Scenario 4: The business service quality
is diminishing as employee turnover
continues to exceed industry
benchmarks.
Scenario 5: The business customers are
happy with their services despite not
meeting contract specifications.
Consider the following scenarios:
These verbal worlds are reinforced by
artifacts, histories, institutional memory, and
convenience. Challenging these can be
difficult as an entire history of values,
language, symbols, and artifacts are available
to reinforce existing viewpoints.
New initiatives seek to bridge the divide
created through the often encountered ‘false
dichotomies,’ but fail because the execution
of these policies continue to fall short.
Rhetoric is adopted that emphasizes ‘key
catchphrases’ or ‘value imbued symbols’ in
an effort to reinforce existing positions.
The dialogue that results incorporates colors,
imagery, emotions, and assumptions that
reinforce existing positions but rarely
excavate the opportunities that rest beneath
the surface
Business culture can either be an
asset or an obstacle to serving the
business' stakeholders. The business
culture of meaning, faith, and values
are intertwined with language,
symbols, and artifacts.
The result is the intersection of belief
and experience where the
differentiation between facts vs.
fiction becomes tangled. Verbal
worlds created from this intersection
compel individuals to act or resist,
defying verbal worlds held by others
that propose contrary actions.
BUSINESS CULTURE
H T T P : / / I N N O V A T E V A N C O U V E R . O R G
P A G E 2
VERBAL WORLDS
Expanding Our Understanding
Moving beyond this deterministic and
isolated reasoning to where our
understanding is expanded, our tools
are enhanced, and our ability to
incorporate novel and changing
information seems almost beyond
reach.
Yet when humans are not embattled in
conflict, or are not locked in the
‘perception’ of threat, we are capable
of yearning for stronger relations and
understanding of how to impact the
world for the better.
Diversity and other social (and
economic) initiatives are just a few
examples of how humans have
overcome their false dichotomies,
beliefs, and assumptions in an effort to
better relate to the world. It is
unfortunate this took so long, and that
so much more work is still left to be
done.
RELATIONSHIPS
MATTER
What were some of the assumptions you
made when reviewing these hypothetical
scenarios? What if everyone ‘currently
involved’ felt the status quo should be
maintained? Would that influence your
assumptions or would you want to know
more?
In a world of relationships and values we
are often inclined to evaluate artifacts
according to explanations, viewpoints,
and preferences already known. Meaning
and facts is discovered through an
experiential approach that attempts to
differentiate right from wrong, good from
bad, and fact from fiction.
History is full of examples of atrocities,
misjudgment, and subsequently identified
criminal acts that were substantiated by
the beliefs, values, and assumptions of the
era.
H T T P : / / I N N O V A T E V A N C O U V E R . O R G P A G E 3
In order to better understand the
context and history that contributes to
the six-scenarios described earlier we
need Better Tools! Taking an inventory of
attitudes, assumptions, and beliefs of
the immediate-team is no longer
enough (unless the goal is reinforce
elements of the current situation).
It represents a significant (and essential)
place to begin as it harnesses the
(desired) good-will, motivation, and
interests of the team.
The term ‘data’ is often resisted by
coworkers due to the culture of
meaning, values, and assumptions that
surround it. In order for businesses to
better serve their customers, employees,
and allocate resources it is crucial that
they become more proficient at
collecting, evaluating, and utilizing
existing data.
Binding Connections
Despite our natural tendency to view ‘data’ as
impersonal, mechanistic, and amoral it is
actually capable of reinforcing relationships,
strengthening customer satisfaction, and
improving the business’ ability to reach its
mission.
The relationship is introduced through the
process by which useful data is identified,
evaluated, and used. Meaning, values, and
beliefs are not only reinforced by using data
but harnessed as well. This is because meaning,
values, and beliefs determine what we are
evaluated, what data is needed, and what
outcomes we are pursuing.
The Value of Data
One of the problems with data (particularly
when used in isolation or without appropriate
measures) is that it can be interpreted
differently depending on one's viewpoint. This
is likely one of the reasons why ‘data
management plans’ are often resisted.
H T T P : / / I N N O V A T E V A N C O U V E R . O R G
DATA IN
CONTEXT
In some work environments making such
statements (or seeking improvements
beyond the six-scenarios identified earlier)
could get an employee criticized,
ostracized, or even terminated.
And within those environments the
meaning, values, beliefs, and artifacts
necessary to justify such actions are readily
available. And yet in other environments we
would observe different responses just as
strongly advocated.
Context and history continue to matter. But
even they have a context and a history.
Each providing layers of meaning, value,
assumptions, and artifacts that also need to
be understood.
CONSEQUENCES
The discussion of identifying ‘metrics’ or
‘key performance indicators’ to evaluate
business performance will often surface
resistance. The fear of ‘accountability’
(another word that is often perceived
differently than intended) for outcomes
not agreed upon highlights how crucial
collaboration, consensus, and agreement
around these metrics can be.
But data becomes crucial once an
agreement is reached regarding business
goals. Without it the business, and our
coworkers, could be having less impact
than desired.
Diminishing returns could eventually put
the business at risk of being closed as
competitors, and more productive efforts
(another word that is often perceived
differently than intended), are realized by
our customers elsewhere.
Data 101: Quantitative & Qualitative KPI's
Data can be both quantitative and
qualitative. Neither is necessarily ‘more
valuable’ to a business than the other,
although the ability to quantify
information makes it easier to measure.
Qualitative data is often considered more
relational whereas quantitative data is
more often considered business related.
But this is not true. Getting ‘sixty three
thank you cards’ after a special event
represents both a quantitative (#) and
qualitative (satisfaction, happiness,
positive relations) measures.
Qualitative measures can almost always be
tied back to a quantitative measure.
Consider the following example where 63
thank-you cards represent the amount of
satisfaction, happiness, and positive
relations resulting from the special event.
H T T P : / / I N N O V A T E V A N C O U V E R . O R G P A G E 5
The advantage of having a ‘benchmark’
is that your business can then try out
different strategies. These strategies
can then be compared to evaluate
which one is better suited to help your
business reach its goal.
Without data, or the resulting
benchmarks, your business is less likely
to respond proactively to deficiencies
in performance before alerted by
customer complaints.
This may be a short term option with
‘captured markets’ but is not
sustainable as customer needs are
often not the same (and change over
time).
If your business is pursuing qualitative
measures these can be tied ‘back to’
quantitative measures that are related.
In this instance the special event was
the strategy that help the business
achieve the qualitative outcomes.
By identifying the quantitative measure
(# of thank-you cards) the business now
has a benchmark by which to compare
future efforts.
The number of thank-you cards can be
used to evaluate customer satisfaction,
happiness, and positive relations for
future special events.
IMPACT
H T T P : / / I N N O V A T E V A N C O U V E R . O R G P A G E 6
BENCHMARKING
Identify priorities: Identify
customer, stakeholder, employee,
and contract priorities for the
business.
Establish urgency: Identify any
critical performance or deliverable
issues that must be improved.
Identify data available: Identify
what data is already available,
collected, and tracked. Identify
what business stories can be told
with this information.
The following guidelines can be useful
when modified based on the business
culture, stage of development, and
stage of readiness:
Identify how, where, and why data is
already being collected. Formalize this
process and if needed identify areas for
improved performance to insure the
methods remain consistent.
Identify data evaluation methods in use:
Identify how the information is being
evaluated and if any benchmarks are
being referenced. Insure that these
methods remain consistent over time so
that benchmarks and comparisons can
be established.
Identify current roles & responsibilities:
Identify who is responsible for collecting,
evaluating, and reporting the data as
well as who uses the information and
finds it useful (and under what
circumstances). Identify ways to insure
that the information is available when
and in what format users need it.
Identify perceived ‘pros & cons’ to data
driven decision models: Identify how
data is already being used and ways in
which data driven models will help the
business better serve its customers.
Identify barriers to using data driven
decision models: Identify what resources,
training, buy-in, and oversight is needed
to reinforce the business steps taken to
use data driven decision models.
Identify opportunities to using data
driven decision models: Identify business
areas and questions where data driven
decision models would have the most
impact. This includes areas where the
use of these methods could be used to
role model and reinforce the use of these
tools.
Identify data collection methods available:
DATA
MANAGEMENT
PLANNING
H T T P : / / I N N O V A T E V A N C O U V E R . O R G P A G E 7
Data Collection Processes
Quality Management Systems
Workflow Design & LEAN
Logic Models & Statistical Process
Control
Recognizing that this process entails a
use of data, and a process for
evaluating it, can help reinforce
existing processes and methods.
The next step is to identify areas where
business performance improvements
are needed as well as the data &
information that can help.
Contact Innovate Vancouver to help
on your next data driven project!
Travis Barker, MPA GCPM
Consulting@innovatevancouver.org
A TAILORED
APPROACH
The process just described for creating a data
driven business culture is intended to
decrease resistance, increase buy-in, and
improve the business’ opportunities for
success.
The process begins with creating a business
culture that recognizes how data is already
being used. Reinforcement, resource
development, and training are subsequently
implemented as the business identifies areas
for improvement.
There is no one-size-fits-all model for
determining which data will be useful. This is
determined by the type of business,
stakeholder needs, existing opportunities,
and present issues facing the business.
Decisions are made every day that take into
consideration existing information.
H T T P : / / I N N O V A T E V A N C O U V E R . O R G P A G E 8

Innovate Vancouver: Data Driven Business Model

  • 1.
    INNOVATE VANCOUVER DATA DRIVENBUSINESS MODELS WHITEPAPER P R E P A R E D B Y T R A V I S B A R K E R , M P A C O N S U L T I N G @ I N N O V A T E V A N C O U V E R . O R G H T T P : / / I N N O V A T E V A N C O U V E R . O R G
  • 2.
    Innovate Vancouver isa Technology & Business Innovation Consulting Service (TBICS) located in Vancouver, BC. Travis Barker, MPA GCPM Email: Consulting@innovatevancouv er.org Phone: (778) 829-5643 About Us Our Vision: To help every business become innovative, exceed stakeholder expectations, and strengthen the business’ positive impact across the communities and industries they serve. Our Values: Covering over 10 years experience in system wide projects and business planning emphasizing the nonprofit and for profit industries. We recognize that a cookie-cutter approach will not solve most business’ problems and so our team focuses on working together with our customers to create individually tailored solutions to fit your business needs. Our Belief: Innovation is built on opportunity. In order to recognize a business opportunity – out of the box thinking, feedback, collaboration, creative assets, and a  system’s thinking approach is often needed. ABOUT INNOVATE VANCOUVER H T T P : / / I N N O V A T E V A N C O U V E R . O R G P A G E 1
  • 3.
    Scenario 1: Thebusiness publically funded service hours have fallen behind on delivery. Scenario 2: The public funder receives reports that do not reflect this backlog. Scenario 3: The public funder wants existing processes to continue as usual even though customers are seeing a diminishing rate of return on their services as a result. Scenario 4: The business service quality is diminishing as employee turnover continues to exceed industry benchmarks. Scenario 5: The business customers are happy with their services despite not meeting contract specifications. Consider the following scenarios: These verbal worlds are reinforced by artifacts, histories, institutional memory, and convenience. Challenging these can be difficult as an entire history of values, language, symbols, and artifacts are available to reinforce existing viewpoints. New initiatives seek to bridge the divide created through the often encountered ‘false dichotomies,’ but fail because the execution of these policies continue to fall short. Rhetoric is adopted that emphasizes ‘key catchphrases’ or ‘value imbued symbols’ in an effort to reinforce existing positions. The dialogue that results incorporates colors, imagery, emotions, and assumptions that reinforce existing positions but rarely excavate the opportunities that rest beneath the surface Business culture can either be an asset or an obstacle to serving the business' stakeholders. The business culture of meaning, faith, and values are intertwined with language, symbols, and artifacts. The result is the intersection of belief and experience where the differentiation between facts vs. fiction becomes tangled. Verbal worlds created from this intersection compel individuals to act or resist, defying verbal worlds held by others that propose contrary actions. BUSINESS CULTURE H T T P : / / I N N O V A T E V A N C O U V E R . O R G P A G E 2 VERBAL WORLDS
  • 4.
    Expanding Our Understanding Movingbeyond this deterministic and isolated reasoning to where our understanding is expanded, our tools are enhanced, and our ability to incorporate novel and changing information seems almost beyond reach. Yet when humans are not embattled in conflict, or are not locked in the ‘perception’ of threat, we are capable of yearning for stronger relations and understanding of how to impact the world for the better. Diversity and other social (and economic) initiatives are just a few examples of how humans have overcome their false dichotomies, beliefs, and assumptions in an effort to better relate to the world. It is unfortunate this took so long, and that so much more work is still left to be done. RELATIONSHIPS MATTER What were some of the assumptions you made when reviewing these hypothetical scenarios? What if everyone ‘currently involved’ felt the status quo should be maintained? Would that influence your assumptions or would you want to know more? In a world of relationships and values we are often inclined to evaluate artifacts according to explanations, viewpoints, and preferences already known. Meaning and facts is discovered through an experiential approach that attempts to differentiate right from wrong, good from bad, and fact from fiction. History is full of examples of atrocities, misjudgment, and subsequently identified criminal acts that were substantiated by the beliefs, values, and assumptions of the era. H T T P : / / I N N O V A T E V A N C O U V E R . O R G P A G E 3
  • 5.
    In order tobetter understand the context and history that contributes to the six-scenarios described earlier we need Better Tools! Taking an inventory of attitudes, assumptions, and beliefs of the immediate-team is no longer enough (unless the goal is reinforce elements of the current situation). It represents a significant (and essential) place to begin as it harnesses the (desired) good-will, motivation, and interests of the team. The term ‘data’ is often resisted by coworkers due to the culture of meaning, values, and assumptions that surround it. In order for businesses to better serve their customers, employees, and allocate resources it is crucial that they become more proficient at collecting, evaluating, and utilizing existing data. Binding Connections Despite our natural tendency to view ‘data’ as impersonal, mechanistic, and amoral it is actually capable of reinforcing relationships, strengthening customer satisfaction, and improving the business’ ability to reach its mission. The relationship is introduced through the process by which useful data is identified, evaluated, and used. Meaning, values, and beliefs are not only reinforced by using data but harnessed as well. This is because meaning, values, and beliefs determine what we are evaluated, what data is needed, and what outcomes we are pursuing. The Value of Data One of the problems with data (particularly when used in isolation or without appropriate measures) is that it can be interpreted differently depending on one's viewpoint. This is likely one of the reasons why ‘data management plans’ are often resisted. H T T P : / / I N N O V A T E V A N C O U V E R . O R G DATA IN CONTEXT In some work environments making such statements (or seeking improvements beyond the six-scenarios identified earlier) could get an employee criticized, ostracized, or even terminated. And within those environments the meaning, values, beliefs, and artifacts necessary to justify such actions are readily available. And yet in other environments we would observe different responses just as strongly advocated. Context and history continue to matter. But even they have a context and a history. Each providing layers of meaning, value, assumptions, and artifacts that also need to be understood. CONSEQUENCES
  • 6.
    The discussion ofidentifying ‘metrics’ or ‘key performance indicators’ to evaluate business performance will often surface resistance. The fear of ‘accountability’ (another word that is often perceived differently than intended) for outcomes not agreed upon highlights how crucial collaboration, consensus, and agreement around these metrics can be. But data becomes crucial once an agreement is reached regarding business goals. Without it the business, and our coworkers, could be having less impact than desired. Diminishing returns could eventually put the business at risk of being closed as competitors, and more productive efforts (another word that is often perceived differently than intended), are realized by our customers elsewhere. Data 101: Quantitative & Qualitative KPI's Data can be both quantitative and qualitative. Neither is necessarily ‘more valuable’ to a business than the other, although the ability to quantify information makes it easier to measure. Qualitative data is often considered more relational whereas quantitative data is more often considered business related. But this is not true. Getting ‘sixty three thank you cards’ after a special event represents both a quantitative (#) and qualitative (satisfaction, happiness, positive relations) measures. Qualitative measures can almost always be tied back to a quantitative measure. Consider the following example where 63 thank-you cards represent the amount of satisfaction, happiness, and positive relations resulting from the special event. H T T P : / / I N N O V A T E V A N C O U V E R . O R G P A G E 5
  • 7.
    The advantage ofhaving a ‘benchmark’ is that your business can then try out different strategies. These strategies can then be compared to evaluate which one is better suited to help your business reach its goal. Without data, or the resulting benchmarks, your business is less likely to respond proactively to deficiencies in performance before alerted by customer complaints. This may be a short term option with ‘captured markets’ but is not sustainable as customer needs are often not the same (and change over time). If your business is pursuing qualitative measures these can be tied ‘back to’ quantitative measures that are related. In this instance the special event was the strategy that help the business achieve the qualitative outcomes. By identifying the quantitative measure (# of thank-you cards) the business now has a benchmark by which to compare future efforts. The number of thank-you cards can be used to evaluate customer satisfaction, happiness, and positive relations for future special events. IMPACT H T T P : / / I N N O V A T E V A N C O U V E R . O R G P A G E 6 BENCHMARKING
  • 8.
    Identify priorities: Identify customer,stakeholder, employee, and contract priorities for the business. Establish urgency: Identify any critical performance or deliverable issues that must be improved. Identify data available: Identify what data is already available, collected, and tracked. Identify what business stories can be told with this information. The following guidelines can be useful when modified based on the business culture, stage of development, and stage of readiness: Identify how, where, and why data is already being collected. Formalize this process and if needed identify areas for improved performance to insure the methods remain consistent. Identify data evaluation methods in use: Identify how the information is being evaluated and if any benchmarks are being referenced. Insure that these methods remain consistent over time so that benchmarks and comparisons can be established. Identify current roles & responsibilities: Identify who is responsible for collecting, evaluating, and reporting the data as well as who uses the information and finds it useful (and under what circumstances). Identify ways to insure that the information is available when and in what format users need it. Identify perceived ‘pros & cons’ to data driven decision models: Identify how data is already being used and ways in which data driven models will help the business better serve its customers. Identify barriers to using data driven decision models: Identify what resources, training, buy-in, and oversight is needed to reinforce the business steps taken to use data driven decision models. Identify opportunities to using data driven decision models: Identify business areas and questions where data driven decision models would have the most impact. This includes areas where the use of these methods could be used to role model and reinforce the use of these tools. Identify data collection methods available: DATA MANAGEMENT PLANNING H T T P : / / I N N O V A T E V A N C O U V E R . O R G P A G E 7
  • 9.
    Data Collection Processes QualityManagement Systems Workflow Design & LEAN Logic Models & Statistical Process Control Recognizing that this process entails a use of data, and a process for evaluating it, can help reinforce existing processes and methods. The next step is to identify areas where business performance improvements are needed as well as the data & information that can help. Contact Innovate Vancouver to help on your next data driven project! Travis Barker, MPA GCPM Consulting@innovatevancouver.org A TAILORED APPROACH The process just described for creating a data driven business culture is intended to decrease resistance, increase buy-in, and improve the business’ opportunities for success. The process begins with creating a business culture that recognizes how data is already being used. Reinforcement, resource development, and training are subsequently implemented as the business identifies areas for improvement. There is no one-size-fits-all model for determining which data will be useful. This is determined by the type of business, stakeholder needs, existing opportunities, and present issues facing the business. Decisions are made every day that take into consideration existing information. H T T P : / / I N N O V A T E V A N C O U V E R . O R G P A G E 8