Download to read offline
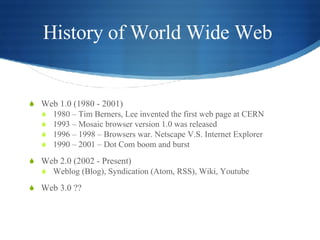
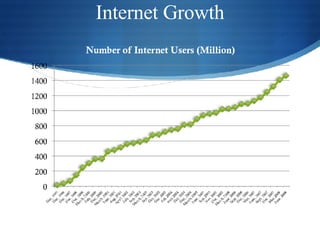
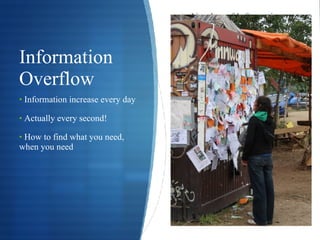
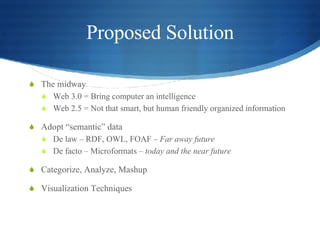

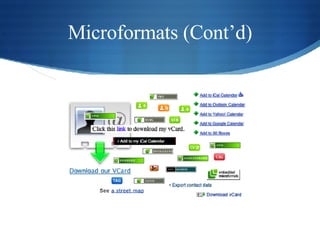
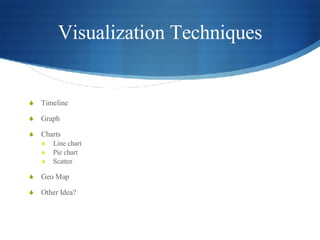
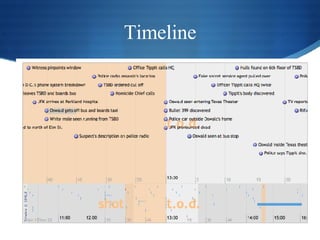
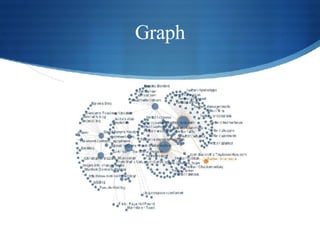


This document discusses using microformats to create visualizations from information on the web. It begins with an overview of the history of the internet and issues around information overflow. It then proposes using microformats as a solution, as they allow information to be both human and machine readable. Finally, it discusses several visualization techniques that could be used with microformatted data, such as timelines, graphs, charts, and maps.


