EESTI STATISTIKA
STATISTICS ESTONIA
INFOÜHISKOND
INFORMATION SOCIETY
TALLINN 2010
3.
Koostanud Statistikaameti ettevõtlusstatistikaosakond (Mari Soiela, telefon 625 9386).
Compiled by Enterprise Statistics Department of Statistics Estonia (Mari Soiela, phone +372 625 9386).
Toimetanud Kairit Põder
Inglise keele toimetanud Heli Taaraste
Küljendanud Uku Nurges
Kaane kujundanud Maris Valk
Edited by Kairit Põder
English edited by Heli Taaraste
Layout by Uku Nurges
Cover design by Maris Valk
Kirjastanud Statistikaamet, Endla 15, 15174 Tallinn,
analüüsi ja väljaannete talitus, telefon 625 9247
Trükkinud Ofset OÜ, Paldiski mnt 25, 10612 Tallinn
Detsember 2010
Published by Statistics Estonia, 15 Endla St, 15174 Tallinn,
Analysis and Publications Service, +372 625 9247
Printed by Ofset OÜ, 25 Paldiski Rd, 10612 Tallinn
December 2010
ISBN 978-9985-74-480-2
Autoriõigus/Copyright: Statistikaamet, 2010
Kaanefoto/Cover photograph: Bulls
Väljaande andmete kasutamisel või tsiteerimisel palume viidata allikale.
When using or quoting the data included in this issue, please indicate the source.
4.
SISUKORD CONTENTS
SISUKORD
Saateks............................................................................................................................... 4
1. Info- ja kommunikatsioonitehnoloogia arenguseire järeldused ja
soovitused K. Rebane ................................................................................................... 6
2. Infoühiskonna poliitikakujundamisest Eestis K. Rits ...................................................... 15
3. Eesti ID-kaardi ajalugu, hetkeolukord ja tulevik K. Pihl .................................................. 20
4. E-maksuamet/e-toll – Maksu- jaTolliameti iseteeninduskeskkond T. Lindroos .............. 31
5. E-äriregistri ettevõtjaportaal kui tõhus bürokraatiavähendaja V. Laansoo ..................... 41
6. eSTAT – veebipõhine andmeesituskanal T. Sillajõe...................................................... 47
7. Infotehnoloogia kasutamine M. Soiela ........................................................................... 52
8. Elektroonilise side areng L. Adamson............................................................................ 63
9. Info- ja kommunikatsioonitehnoloogia sektori ettevõtete areng
T. Pärson, R. Nestor, M. Põldsaar.................................................................................. 70
10. Info- ja kommunikatsioonitehnoloogia Eesti väliskaubanduses R. Kerner ................... 82
CONTENTS
Foreword ............................................................................................................................ 5
1. Information and communication technologies foresight: conclusions and policy
recommendations K. Rebane ....................................................................................... 11
2. Development of information society policy in Estonia K. Rits......................................... 17
3. ID card in Estonia – history, present day and future K. Pihl........................................... 26
4. E-Tax Board / E-Customs – self-service environment of the Estonian Tax and Customs
Board T. Lindroos ......................................................................................................... 36
5. The e-Commercial Register Company Registration Portal as an efficient minimizer
of bureaucracy V. Laansoo............................................................................................ 45
6. eSTAT – web-based channel for data provision T. Sillajõe ........................................... 50
7. Use of information technology M. Soiela ....................................................................... 59
8. Development of telecommunications L. Adamson ......................................................... 68
9. Development of enterprises in the information and communication technologies
sector T. Pärson, R. Nestor, M. Põldsaar ...................................................................... 77
10. Information and communication technology in foreign trade of Estonia R. Kerner....... 89
INFOÜHISKOND INFORMATION SOCIETY 3
5.
SAATEKS FOREWORD
SAATEKS
Veel eelmise sajandi lõpus olid praeguseks igapäevased infotehnoloogilised vahendid
pigem haruldane nähtus. Nüüdseks on ühiskond jõudnud ajajärku, kus elu ilma
infotehnoloogiliste vahenditeta tundub mõeldamatu, eriti noorema generatsiooni puhul.
Peale on hakanud kasvama noored, kes pole elu ilma arvutiteta näinudki. Suur osa
sotsiaalsest suhtlusest toimub arvutivõrkude kaudu. Ka lapse käekäiku koolis on
infotehnoloogia abita praegu pea võimatu jälgida. Internetile ligipääs on muutunud nii
igapäevaseks, et pigem leiab märkimist internetiühenduse puudumine.
Eesti on levinud arusaamade kohaselt üks eesrindlikumatest infotehnoloogiliste rakenduste
kasutajatest. Riik on võtnud oma südameasjaks e-teenuste pideva arendamise ja nende
tase on kättesaadavuse ja kasutusmugavuse poolest üle Euroopa Liidu keskmise.
Elektrooniliseks isikutuvastuseks ja digitaalallkirja andmiseks kasutatakse ID-kaarti ja
mobiil-ID-d ning need võimaldavad turvaliselt ligi pääseda e-teenustele, nagu interneti-
pangandus, maksude deklareerimine, e-valimised jne. Elektrooniline asjaajamine on
aegasäästev, sest puudub vajadus personaalselt kuskile kohale minna, ja automaatse
andmeedastuse tõttu ei pea õigeid pabereid otsima. Peale selle on paberivaba asjaajamine
ka keskkonnasäästlik.
Kogumik annab ülevaate infoühiskonna olukorrast ja arengust Eestis. Esimeses pooles on
vaatluse alla võetud infoühiskonna arengutrendid ja selleteemaline poliitikakujundamine
riigis. Põhjalikumalt on käsitletud mõnd avaliku sektori e-rakendust. Info- ja kommunikat-
sioonitehnoloogiat (IKT) peetakse maailmas oluliseks majanduskasvu võtmeks, eriti
praeguses majanduskriisi olukorras. Infoühiskonna hetkeolukorra hindamiseks ja
edaspidiste tegevussuundade valikuks on vajalik statistiline analüüs. Kogumiku teises
pooles on käsitletud infotehnoloogiliste vahendite kasutamist nii ettevõtetes kui ka elanike
hulgas ning elektroonilise side levikut viimasel viiel aastal. Samuti on analüüsitud IKT sektori
rolli Eesti majanduses ja IKT väliskaubandust.
Head lugemist!
Mari Soiela
kogumiku koostaja
4 INFOÜHISKOND INFORMATION SOCIETY
6.
SAATEKS FOREWORD
FOREWORD
Information technologytools, which are considered common today, were rather a rare
phenomenon at the end of the previous century. By now, the society has reached an era
when life without information technology tools seems unthinkable, especially for the younger
generation. There is a growing generation of youth, who have even not seen life without
computers. A large part of social interaction is done through computer networks. Even
children’s progress in school is hardly traceable without information technology. Internet
access has become so common that the lack of Internet connection is rather noteworthy.
Estonia is known as one of the advanced users of information technology applications
according to common convictions. The state is committed to a continuous development of
e-services, the availability and user friendliness of which are above the European Union
average. Electronic authentification and digital signing by ID card and mobile ID enable
secure access to e-services such as Internet banking, tax declaration, iVoting, etc.
Electronic management saves time, because there is no need to go to a place in person,
and due to automatic data delivery there is no need to search for right paper-based
documents. In addition, paper-free management is also environmentally friendly.
The publication gives an overview of the situation and developments of the information
society in Estonia. The first half focuses on the information society development trends and
relevant governmental policy-making in our country. Some of the public sector e-applications
have been discussed in more detail. Information and communication technology (ICT) is
considered a key to economic growth, especially in the current conditions of economic crisis.
In order to assess the current situation and choose a future course of action, we need
statistical analysis. The use of information technology tools by enterprises and among
population as well as the distribution of telecommunications during the last five years are the
topics handled in the second half of the publication. Besides, the role of ICT sector in
Estonia’s economy and ICT in foreign trade have been analysed.
Enjoy reading!
Mari Soiela
Compiler of the publication
INFOÜHISKOND INFORMATION SOCIETY 5
7.
IKT ARENGUSEIRE ICTFORESIGHT
INFO- JA KOMMUNIKATSIOONITEHNOLOOGIA
ARENGUSEIRE JÄRELDUSED JA SOOVITUSEDa
Kristjan Rebane
Eesti Arengufond
Eesti Arengufond algatas arenguseire EST_IT@2018 eesmärgiga teha kindlaks, millised
valdkonnad suudavad järgmise kümne aasta jooksul info- ja kommunikatsioonitehnoloogia
(IKT) abiga Eesti majanduse ja ühiskonna arengusse enim panustada. Selleks vaatasime
maailmatrende ja küsisime asjatundjatelt, kuidas need trendid mõjuvad Eesti arengut,
arvestades meie praeguseid tugevusi ja nõrkusi IKT vallas. Kolme peamise soovituseni jõuti,
otsides vastust järgmistele küsimustele: milline on Eesti IKT võimekus ja IKT roll ühiskonnas
praegu ning millistes valdkondades on IKT-l enim kasutuspotentsiaali.
Milline on Eesti IKT võimekus?
IKT areng on küll kiire, kuid siiski üsna hästi prognoositav. Enamik 2018. aastaks
masskasutusse jõudvaid tehnoloogiaid on maailma tipplaborites juba praegu olemas. Valdav
osa olulisemaid uuendusi IKT vallas saavad alguse arenenud tööstusriikides, seetõttu on
Eestile ennekõike oluline osata kasutada mujal loodut tehnoloogiat.
Eesti praegune IKT võimekus jääb maailma juhtriikide omast maha, seega ta peab oma IKT
võimekust uutes ja olulisemates IKT arengusuundades tugevdama.
Üle poole seire ajal küsitletud Eesti eri valdkondade ekspertidest hindasid oluliste
väljakutsetega valdkondadeks Eesti haridust, energeetikat, töötlevat tööstust ja IKT
turvasüsteeme. Kõige suurema IKT rakendamise võimekusega valdkondadeks pidasid
eksperdid seejuures finantsteenuste ja IKT turvasüsteemide valdkonda (vt joonis nr 1).
Joonis 1 Olulisemate väljakutsetega valdkonnad aastatel 2008–2018 ja Eesti praegune IKT
võimekus valdkonna järgi, küsitletute arvates
Figure 1 Areas with key challenges in 2008–2018 and Estonia’s current ICT capability by area
according to respondents’ opinions
Haridus — Education
Energeetika — Energy
Tööstus — Manufacturing
IKT turvalisus — ICT security
Meditsiin — Health care
Julgeolek — Safety
Kultuur — Culture
Transport — Transport
Riik — Country
Digilõhe — Digital gap
Keskkond — Environment
Käitumismustrid — Behaviour patterns
Finantsteenused — Financial services
Sotsiaalia — Social sciences
Põllumajandus — Agriculture
Tööjõuturg — Labour market
Kaubandus — Trade
Reisikorraldus — Tour operating % küsitletutest
Meelelahutus — Entertainment
% of respondents
0 10 20 30 40 50 60 70 80 90
Väljakutse Eesti arengus väga suur
Challenge in Estonia's development very big
IKT võimekus Eestis väga suur
ICT competence in Estonia very big
Allikas: veebiküsitlus EST_IT@2018, Eesti Arengufond 2008
Source: Web survey on EST_IT@2018, Estonian Development Fund 2008
a
Käesolev artikkel tugineb Eesti Arengufondi IT arenguseire EST_IT@2018 raporti lühiversioonile (Spikker nr 1, 2009).
6 INFOÜHISKOND INFORMATION SOCIETY
8.
IKT ARENGUSEIRE ICTFORESIGHT
1. soovitus: viia IKT kõrgharidus Eestis tugevale
rahvusvahelisele tasemele
Eesti peab suurendama IKT sektori tööjõupakkumist ja parandama samal ajal IKT
kõrghariduse kvaliteeti. Eestis tuleb välja arendada mitu uut IKT kompetentsivaldkonda,
nagu teenuste internet ja Grid, uued baastehnoloogiad mikroelektroonika ning bio- ja
nanotehnoloogia kokkupuutealadel, sidesüsteemide integratsioon ning IKT süsteemide
alternatiivsed teoreetilised alused (kognitiivsüsteemid jmt).
Eesti IKT kõrghariduse kiireks rahvusvahelistumiseks tuleb Eestisse tuua korraga viis-kuus
tugevat välisprofessorit või välismaal töötavat Eesti arvutiteadlast, et Eestile olulistes, kuid
seni nõrkades IKT kompetentsivaldkondades oleksid tugevad spetsialistid. Välis-
õppejõudude Eestisse kutsumise eeldus on ülikooli rahvusvahelistumise plaan koos kindlate
eesmärkide ja ajakavaga. Kriitilise massi saavutamiseks on seejuures otstarbekas värvata
ühte struktuuriüksusesse korraga mitu välisprofessorit.
Iirimaa, Soome ja Singapuri varasemad edulood on näidanud, et välisõppejõudude riiki
toomisel ei piisa üksnes haldusküsimuste lahendamisest ja konkurentsivõimelise töötasu
pakkumisest. Tuleb lahendada kõik (esimesteks aastateks vajaliku) töötasu, eriaparatuuri ja
uurimismeeskonna ning pereliikmete ümberasumise ja uues keskkonnas kohanemisega
seotud küsimused.
Tugev rahvusvaheline kõrgharidus teeb Eesti kõrgkoolide IKT erialad kohalikele üliõpilastele
köitvamaks ja toob Eestisse senisest enam välisüliõpilasi.
Lähiaastail astuvad Eestis kõrgkoolidesse väikese sündimusega põlvkonnad, mistõttu
üliõpilaste, sh ka IKT erialade üliõpilaste hulk väheneb märkimisväärselt (vt joonis nr 2).
Arvestades, et IKT kasutuselevõtu potentsiaal eri valdkondades eeldab piisava erialase
ressursi ja võimekuse olemasolu ning püsivat nõudlust IKT-spetsialistide järele (seda ilma
üliõpilaste arvu vähenemisetagi), siis on praegusegi taseme hoidmiseks vaja IKT erialadel
märkimisväärset hulka välisüliõpilasi.
Joonis 2 Kõrgkooli astujate ja lõpetajate arv IKT erialadel, 1997–2008 ja 2009.–2014. aasta
prognoos
Figure 2 Number of persons entering and graduating from the ICT specialties in higher educational
establishments, 1997–2008 and projections for 2009–2014
Vastuvõetud esimese
aasta üliõpilased
Enrolment in the first
Arv Prognoos
year of university
Number Projection
1200
1000
800
600
400
200
Lõpetajad
Graduates
0
97 98 99 00 01 02 03 04 05 06 07 08 09 10 11 12 13 14
Allikas: Marek Tiits, Arengufond 2009
Source: Marek Tiits, Development Fund 2009
INFOÜHISKOND INFORMATION SOCIETY 7
9.
IKT ARENGUSEIRE ICTFORESIGHT
Joonis 3 IKT erialade välisüliõpilaste arv, 2006–2009 ja 2014. aasta eesmärk
Figure 3 Number of foreign students in ICT specialties, 2006–2009 and target for 2014
Arv
Number
500
450
400
350
300
250
200
150
100
50
0
2006 2007 2008 2009 2014
Allikas: Marek Tiits, Arengufond 2009
Source: Marek Tiits, Development Fund 2009
Kokkuvõttes peab välisõppejõudude Eestisse toomine ja Eesti üliõpilaste (osaline)
kraadiõpe välismaal viima Eesti kõrgkoolide IKT erialad tugevale rahvusvahelisele tasemele.
Olenemata sellest, kas nutikamad välisüliõpilased leiavad hariduse omandamise järel
rakendust Eesti ettevõttes või naasevad kodumaale, toetab üliõpilaste vahetus omakorda ka
Eesti majanduse, eriti IKT ettevõtete rahvusvahelistumist. IKT kõrghariduse viimist
arvestatavale rahvusvahelisele tasemele tuleb käsitleda kui pilootprojekti, millest saadud
kogemused annavad eeskuju kogu Eesti kõrgharidussüsteemi uuendamisele.
Milline on IKT roll Eesti majanduses?
IKT sektoril on Eesti majanduses väike osa, kuid IKT roll ühiskonna ja majanduse arengus
on sellest hoolimata väga suur. IKT panus majanduse arengusse avaldub tootlikkuse
kasvus, mis saavutatakse IKT kasutuselevõtuga kõigis majandusharudes.
Suurema lisandväärtusega IKT toodete ja teenuste ekspordi kasv eeldab meie ettevõtetelt
enam rahvusvahelise äri tegemise oskuseid.
Hoolimata sellest, et IKT sektor teeb peaaegu poole teadus- ja arendustegevuse (T&A)
valdkonna kogukulutustest, on sektor ise üsna väike – eri näitajaid vaadates 4–7%
ettevõtlussektorist (vt joonis nr 4). Enamik IKT ettevõtteid on alla 10 töötajaga
väikeettevõtted, suurem osa käibest ja kasumist on väheste telekomiettevõtete oma jne.
Joonis 4 IKT sektori osatähtsus majanduses, 2007
Figure 4 Proportion of ICT sector in the economy, 2007
T&A kulud
R&D expenditure
Lisandväärtus
Value added
Kasum
Profit
Eksport
Exports
Müügikäive
Net sales
Töötajate arv
Number of employees
Ettevõtete arv
Number of enterprises %
0 5 10 15 20 25 30 35 40 45
Allikas: Eesti IKT sektori ettevõtete uuring, Praxis 2009 Statistikaameti andmete põhjal
Source: Study of Enterprises in the Estonian ICT Sector, Praxis 2009 on the basis of Statistics Estonia’s
data
8 INFOÜHISKOND INFORMATION SOCIETY
10.
IKT ARENGUSEIRE ICTFORESIGHT
2. soovitus: tugevdada rahvusvahelist ärijuhtimist IKT sektori
ettevõtetes
Ettevõtjad tõid arenguseire raames Eesti IKT sektori arengus olulise puudusena esile
rahvusvahelise tootearenduse ja müügi oskusega inimeste ning kogemuste vähesuse.
Rahvusvahelise tehnoloogia- ja ärijuhtimise ning turunduse teemaline koolitus on seetõttu
Eesti IKT sektori ja majanduse konkurentsivõime tugevdamisel üks olulisemaid
tegevussuundi. Mida rohkem on välisturgude kogemusi ja mida oskuslikum tootearendus,
seda tulemuslikum on äri.
Eesti Arengufond soovitab kõrgkoolidel luua IKT-spetsialistidele ja keskastme või
väikeettevõtete juhtidele mõeldud tugeva IKT-rõhuasetusega tehnoloogia- ja ärijuhtimise
magistriprogramme. Selliseid programme võib leida ka mujalt maailmast, kuigi väga levinud
need veel pole. Seetõttu on sedalaadi kvaliteetse, välisõppejõude kaasava hariduse järele
peale Eesti nõudlus ka naabermaades.
Ülaltoodule lisaks tuleb muuta IKT kõrgharidus interdistsiplinaarsemaks. Üks praktilisi viise
selleks on näiteks lisada IKT õppekavadesse kohustuslikke ärijuhtimiskursusi. Niisugustel
IKT erialade üliõpilastele pakutavatel kursustel peaks seejuures keskenduma
tehnoloogiastrateegiale, ärijuhtimisele, turundusele ja muudele teemadele. Ettevõtlus- ja
juhtimisainetele lisaks vajavad tehnoloogiaerialade magistriõppe üliõpilased võimalust läbida
ka disaini- (sh kasutajaliidesed), psühholoogia- ja muid kursusi. Selliseid programme on
näiteks Hollandis (Leideni ülikool) ja Suurbritannias (St Andrewsi ülikool ja Westministeri
ülikool), aga ka mujal maailmas.
Millistel valdkondadel on Eestis IKT kasutuselevõtuks enim
potentsiaali?
Ühiskondlikud ja majanduslikud väljakutsed Eesti arengus näitavad kasvavat vajadust IKT
nutikaks kasutuselevõtuks.
Valdkonnad, millele Eestis tuleb IKT kasutuselevõtul keskenduda, on haridus, tervishoid,
tööstus, energeetika, finantsteenused ning IKT turvasüsteemid. Kõigis neis valdkondades on
nõudlus uudsete IKT-lahenduste järele hakanud kasvama nii Euroopas kui ka kaugemal.
3. soovitus: teekaardid IKT kasutuselevõtuks
fookusvaldkondades
Et leida lahendused IKT arenguseires nimetatud kuue IKT kasutamise fookusvaldkonna
(haridus, tervishoid, tööstus, energeetika, finantsteenused ja IKT turvalisus) olulisematele
väljakutsetele, tuleb ennekõike mõelda, millisteks sisulisteks muudatusteks on valdkond
valmis. Sedalaadi tulevikuplaanid nõuavad küll head ettekujutust IKT kasutamise
võimalustest, kuid ei ole kaugeltki mitte tehnoloogiline küsimus. IKT tõhusa kasutuselevõtu
kavandamine eeldab seetõttu nii valdkonna strateegiliste raskuspunktide mõistmist kui ka
tehnoloogiate ja turgude tundmist.
Olulisemad väljakutsed Eesti arengus on töötada välja uusi IT-lahendusi, mida müüa ka
teistele riikidele.
Üks võimalus analüüsida valdkonna strateegilisi valikuid ja nendega seotud IKT kasutamise
viise on koostada IKT kasutuselevõtu kohta pikemaajalised teekaardid (ingl k roadmap).
Teekaart on strateegilist planeerimist toetav tööriist, mida kasutatakse selleks, et panna kirja
ühised pikemaajalised eesmärgid, nende saavutamise viisid ja teele jäävad verstapostid.
Teekaardid kirjeldavad nii valdkonna arenguks olulisi muutusi ühiskonnas ja majanduses,
tehnoloogia ja turgude arengut maailmas, ettevõtjate tegevust (uued tooted ja teenused) kui
ka teekaardil kirjas olevate eesmärkide saavutamiseks vajaminevaid ressursse (inimesed,
raha).
Arengufond algatas kuuest fookusvaldkonnast kolmes (neis, kus olid valdkondlikud
eestvedajad) – hariduses, tervishoius ja finantsteenuste valdkonnas – IKT kasutuselevõtu
teekaartide koostamise. Ettevõtmise eesmärk on teha kindlaks valdkonna tulevased
arenguvõimalused ja koostada IKT kasutuselevõtu üksikasjalikumad plaanid.
INFOÜHISKOND INFORMATION SOCIETY 9
11.
IKT ARENGUSEIRE ICTFORESIGHT
Kuidas nende soovitusteni jõuti?
IKT arenguseire on üks Eesti Arengufondi kolmest seireprojektist. Teised kaks on töötleva
tööstuse restruktureerimise ja teenustemajanduse projekt, millega valmistatakse ette neile
järgnevat laiemat seiret ja panustatakse sellesse eesmärgiga sõnastada Eesti kasvuvisioon
järgmiseks aastakümneks.
IKT arenguseires määrasime kõigepealt kindlaks Eestit enim mõjutavad üleilmsed IKT- ja
sotsiaal-majanduslikud trendid. Seejärel tegime intervjuud Eesti ettevõtete, kõrgkoolide ja
riigisektori kahekümne mõjukama IKT-spetsialisti ja otsustajaga.
Intervjuudest saadud mõtete, maailma IKT-trendide ja Eesti olulisemate sotsiaal-
majanduslike väljakutsete ülevaatena valmis seire EST_IT@2018 vaheraport, mille
järelduste tutvustamiseks ja arutamiseks korraldasime töötoa. Seejärel tegime Eesti IKT
sektori arenguprioriteetide väljaselgitamiseks mahuka veebiuuringu, mille tulemuste põhjal
panime kirja olulisemad tegevussuunad Eesti IKT hariduse ja teaduse viimiseks
arvestatavale tasemele ning kuus fookusvaldkonda IKT-lahenduste tõhusamaks kasutuseks.
IKT arenguseire tulemuste aruteluks korraldas Arengufond esindusliku foorumi, kus koos
140 eksperdi ja otsustajaga arutlesime Eesti IKT arenguvisioonide üle ning kogusime
tulemuse viimistlemiseks lisasisendit.
Seireraport koos EST_IT@2018 foorumi materjalide ja videosalvestusega on elektrooniliselt
kättesaadav Eesti Arengufondi veebilehel www.arengufond.ee.
10 INFOÜHISKOND INFORMATION SOCIETY
12.
IKT ARENGUSEIRE ICTFORESIGHT
INFORMATION AND COMUNICATION TECHNOLOGIES
FORESIGHT: CONCLUSIONS AND POLICY
RECOMMENDATIONSa
Kristjan Rebane
Estonian Development Fund
The Estonian Development Fund launched the EST_IT@2018 foresight with the objective of
identifying the areas in which information and communication technologies (ICT) could
contribute the most to the development of Estonia’s economy and society during the next
ten years. For this purpose the international trends were studied and specialists were
consulted, how these trends can affect Estonia’s development in view of our current
strengths and weaknesses in the field of ICT. Three main recommendations were made
while searching answers to the following three questions: which is Estonia’s ICT capability
and the role of ICT in society now and which areas have most potential for the application of
ICT.
Which is Estonia’s ICT capability?
Even though the development of ICT is fast, it is quite predictable. Most of the technologies
that will be widespread by 2018, exist in an embryonic form already today in the top
laboratories throughout the world. Most of the more fundamentals of ICT systems are
created in major industrialised countries. Therefore, it is very important for Estonia to be able
to utilise the technologies created elsewhere.
Estonia’s current ICT capabilities lag behind the global forefront. Estonia has to strengthen
its ICT competencies in the emerging key ICT areas.
More than half of Estonian experts of different areas questioned during the foresight
considered education, energy, manufacturing, and ICT security as the areas with key
challenges in Estonia. Thereby, experts considered financial services and ICT security
systems as areas with most competencies for the application of ICT. (Figure 1)
Recommendation 1: upgrade higher education in ICT to an
internationally attractive level
Estonia needs to increase its ICT labour supply whilst simultaneously improving the quality
of higher education in the field of ICT. Estonia has to build up several new areas of
competence in ICT, e.g. Internet of Services and Grid, new basic technologies in the areas
of convergence of microelectronics, bio- and nanotechnologies, integration of
communication systems, and alternative theoretical foundations of ICT systems (cognitive
systems, etc.).
In order to fast-track the internationalisation of Estonia’s ICT higher education, at least five
or six distinguished professors, both foreign or expatriates should be simultaneously
attracted to Estonia. This is the most effective way to fill the above key ICT areas, regarded
essential but relatively weak in Estonia so far, with acknowledged specialists. Host
universities’ internationalisation plan stating the desired objectives and schedules should be
seen as a prerequisite for inviting foreign lecturers to Estonia. Furthermore, to build up
critical mass, it is expedient to recruit several foreign professors into a single structure at a
time.
Similar success stories of Ireland, Finland and Singapore in attracting foreign professors
demonstrate that settlement of administrative matters and competitive salary offer are
prerequisites, but not necessarily sufficient. For initial years, Estonia has to offer an integral
package covering the issues related to salary and research costs (with respect to special
equipment and research team), as well as issues concerning relocation of accompanying
family members and their adaptation to the new environment.
a
This article is based on the abbreviated version of the EST_IT@2018 foresight report (Spikker 1, 2009).
INFOÜHISKOND INFORMATION SOCIETY 11
13.
IKT ARENGUSEIRE ICTFORESIGHT
High-quality international higher education will make the ICT programmes in Estonian
universities more attractive to local students while also attracting more foreign students.
In the coming years, generations with low birth rates will enter the higher educational
institutions in Estonia, whereas the number of students, incl. in ICT specialties, will decrease
remarkably (see Figure 2). Taking into account, that the potential of application of ICT
capabilities in various areas presumes existence of sufficient professional resources and
capabilities and a sustained demand for ICT specialists (even without a decrease in the
number of students), it requires a significant number of foreign students in ICT specialties to
keep the current level. (Figures 2 and 3)
In conclusion, bringing foreign lecturers to Estonia and enabling Estonian students to pursue
post-graduate studies (partly) abroad will eventually upgrade the ICT programmes offered in
Estonian universities to a strong international level. Regardless of whether smarter foreign
students are after graduation employed by Estonian companies or return home, student
exchange will in turn underpin the internationalisation of Estonian economy and particularly
of its ICT companies. Upgrading of ICT higher education to an internationally recognised
level should be seen as a pilot project which would provide experience for renewing the
entire higher education system in Estonia.
What is the role of ICT in Estonia’s economy?
The ICT sector itself accounts for only a small part of the Estonian economy. Nevertheless,
the contribution of ICT to economic and social development is immense. The contribution of
ICT to the development of the economy manifests itself through productivity growth
achieved with smart take-up of ICT throughout the economy.
In order to increase the export of high value-added ICT products and services, international
business skills of Estonian enterprises need to be improved significantly.
Despite the fact that the ICT sector makes almost a half of the total expenditure of research
and development (R&D), the sector is quite small in itself: 4–7% of total entrepreneurship by
different indicators (see Figure 4). The majority of ICT enterprises are small enterprises with
less than 10 employed persons, most of the turnover and profit belong to a small number of
telecommunications companies, etc. (Figure 4)
Recommendation 2: strengthen international business
management skills in ICT companies
Entrepreneurs have identified during the foresight process the lack of specialists possessing
international product development and sales skills as well as insufficient experience as a
significant bottleneck affecting the development of Estonia’s ICT sector. Strengthening of
international technology and business management as well as marketing training is thus of
crucial importance, if the competitiveness of Estonia’s ICT sector and the economy at large
is to be strengthened. The more experience we have in the foreign markets and the better
skilled is the product development, the more effective business.
Estonian Development Fund recommends Estonian universities to start offering to
technology specialists, middle managers or heads of small companies (executive) MBA
programmes in technology and business management with a strong ICT focus. Similar
programmes are offered elsewhere globally, however, they are not yet very common.
Consequently, there is also a good chance to start offering such high-quality education
provided with the involvement of foreign lecturers also to students from neighbouring
countries besides Estonia.
The ICT education itself has also to become more interdisciplinary. A practical way to
achieve that is to include compulsory business management courses in ICT syllabuses.
Technology students would benefit foremost from courses on technology strategies,
business management, marketing and other subjects. Besides the above-mentioned
business and technology management courses, MBA students in technology also need
access to courses in design (incl. user interface), psychology, etc. Such programmes are
12 INFOÜHISKOND INFORMATION SOCIETY
14.
IKT ARENGUSEIRE ICTFORESIGHT
offered, for example, in the Netherlands (Leiden University) and in the United Kingdom
(University of St Andrews and University of Westminster), and also elsewhere in the world.
Which are the key areas for application of ICT in Estonia?
The socio-economic challenges that Estonia faces in its development represent a new
rapidly growing demand for smart take-up of ICT applications.
The areas that Estonia has to focus on in the take-up of ICT are, first and foremost,
education, health care, manufacturing, energy, financial services and ICT security systems.
In all of these target areas, demand for innovative ICT solutions is growing not only in
Estonia but also in Europe and beyond.
Recommendation 3: roadmaps for the application of ICT in
target areas
In order to find solutions to the key challenges specified in the ICT foresight exercise for six
target areas (education, health care, manufacturing, energy, financial services and ICT
security), it should first be identified which substantial changes the area concerned is
altogether prepared to undergo. Planning a future application for ICT requires a good
perception of the technological possibilities, but in itself, it is hardly a technological issue.
Therefore, the effective application of ICT requires an understanding of strategic focal points
of the above target areas as well as knowledge of technologies and markets.
The most important challenges in Estonia’s development are to work out new IT-solutions to
be sold also to other markets.
One possibility for analysing strategic choices in the target areas and related possibilities for
application of ICT is to draw up long-term roadmaps for the take-up of ICT.
Roadmapping is a strategic planning tool used for identifying common long-term goals, ways
to achieve these goals and the milestones on the way. Roadmaps describe important
changes in the society and the economy, global trends in technology and markets, expected
future activities of entrepreneurs (new products and services) as well as resources (people,
funding) required for achieving specific strategic goals.
Estonian Development Fund initiated the development of roadmaps in three out of six target
areas (areas with sectoral leaders) – in education, health care and financial services. The
aim is to envisage the possible future developments and to draw up detailed action plans for
the application of ICT.
How did we come up with these recommendations?
ICT foresight is one of the three foresight projects (alongside the reconstruction of
manufacturing industry and the service economy) undertaken by the Estonian Development
Fund in order to prepare and contribute to the subsequent more broad-based foresight, the
objective of which is to formulate Estonia’s growth vision for the coming decade.
In the ICT foresight, we commenced by mapping the global ICT and socio-economic trends
affecting Estonia the most. Then, we conducted interviews with the twenty most influential
Estonian ICT specialists and decision-makers representing companies, academia and the
public sector.
Based on the ideas gained from interviews, an interim report of the foresight EST_IT@2018
was drawn up as an overview of global ICT trends and Estonia’s most essential socio-
economic challenges, and conclusions presented in this report were introduced and
discussed at a one-day workshop. After that, we conducted an extensive web survey with
the purpose of defining Estonia’s ICT development priorities. Based on the survey, we
defined the most relevant areas in order to upgrade Estonia’s ICT education and research to
an attractive level. We also identified six target areas where Estonia needs to boost the
take-up of ICT solutions.
INFOÜHISKOND INFORMATION SOCIETY 13
15.
IKT ARENGUSEIRE ICTFORESIGHT
Focussing on the results of ICT foresight, a major forum assembling 140 experts and
decision-makers was organised by the Estonian Development Fund to discuss Estonia’s ICT
development visions and collect additional input for elaborating the final report.
The EST_IT@2018 foresight final report “EST_IT@2018: Estonian information technology
outlooks”, including materials of the forum and the video recording, is electronically available
on the web site of Estonian Development Fund www.arengufond.ee.
14 INFOÜHISKOND INFORMATION SOCIETY
16.
INFOÜHISKONNA ARENDAMISEST EESTISDEVELOPMENT OF INFORMATION SOCIETY IN ESTONIA
INFOÜHISKONNA POLIITIKAKUJUNDAMISEST EESTIS
Karin Rits
Majandus- ja Kommunikatsiooniministeerium
Tõenäoliselt oleme kõik üksmeelel, et makse on palju mugavam deklareerida internetis kui
paberil, autot parkida tunduvalt mõnusam mobiiltelefoniga, kui parkimisautomaate otsida,
ning arsti juurde interneti teel aega kinni panna märksa meeldivam, kui telefonis muusikalisi
vahepalu kuulates oma registratuurikorda oodata. Üksmeelel aga ei ole me ilmselt selles,
mida mõiste „infoühiskond” täpsemalt tähendab. Mõne jaoks on see elektroonne maksude
deklareerimine ja mobiilparkimine, mõne jaoks e-valimised, mõne jaoks võimalus ajada asju
tehnoloogia abil teistmoodi ja tõhusamalt. Õigus on neil kõigil. Infoühiskonna mõistet on
defineeritud erinevalt, ent Eesti infopoliitiliste dokumentide koostamisel on valdavalt lähtutud
Valdo Prausti käsitlusest (Praust: 1998), mille kohaselt mõistetakse infoühiskonna all
elukorraldust, kus enamik inimkonna loodud väärtusi on kätketud teabesse. Enamikku
ühiskonnas talletatud teavet hoitakse, teisendatakse ja edastatakse universaalsel digitaalsel
kujul. Üldist andmeedastusvõrku kasutades on juurdepääs teabele kõigil ühiskonnaliikmetel.
Samuti on infoühiskonnas rutiinne vaimne töö usaldatud masinate hoolde.
Järgnevalt on antud põgus ülevaade infoühiskonna poliitika kujundamisest ja
koordinatsioonist Eestis.
Eestis on infoühiskonda teadlikult arendatud juba aastaid. Esimese riigi infopoliitika
a
alusdokumendi „Eesti infopoliitika põhialused” kiitis Riigikogu heaks 1998. aastal.
Dokument sätestab põhimõtted, millest riik peaks infoühiskonna arengut puudutavate
poliitiliste otsuste tegemisel lähtuma. Nii näiteks seati selles dokumendis eesmärgiks, et riigi
infopoliitika peab aitama tõsta majanduse konkurentsivõimet, säilitada ja arendada eesti
keelt ja kultuuri, edendada demokraatiat ning tõhustada riigikaitset. Selles dokumendis
esitatud infoühiskonna arendamise põhimõtted on päevakohased ka praegu.
2004. aastal kiitis valitsus heaks dokumendi „Infopoliitika põhialused aastateks
b
2004–2006” , mis on esimese infopoliitika põhialuseid puudutava dokumendi edasiarendus.
Kõnealuse dokumendi puhul on oluline rõhutada ka asjaolu, et see koostati vahetult enne
Eesti liitumist Euroopa Liiduga (EL), seega kajastusid EL-i infopoliitilised suundumused ja
strateegiad (eEurope, eEurope+) ka meie riigisiseses dokumendis. Kui Eesti esimesed kaks
infopoliitika dokumenti keskendusid eelkõige infrastruktuuri loomisele ning e-teenuste
arendamisele ja kasutuselevõtule, siis 2006. aastal valitsuses heaks kiidetud „Eesti
c
infoühiskonna arengukava 2013” on sootuks laiema haardega, käsitledes info- ja
kommunikatsioonitehnoloogiat (IKT) eelkõige kui töövahendit selleks, et muuta ühiskonna-
ja majanduselu tõhusamaks ning konkurentsivõimelisemaks. Strateegia seab keskmesse
inimese ja tema elukvaliteedi ning näeb ette tegevused kolmes valdkonnas: sotsiaalses,
majanduslikus ja institutsionaalses. Infoühiskonna arengukava kolm peamist eesmärki on
järgmised:
1) iga ühiskonnaliige elab täisväärtuslikku elu, kasutades igakülgselt infoühiskonna
võimalusi ja osaledes aktiivselt avalikus elus (s.t kedagi ei jäeta ja keegi ei jää
kõrvale);
2) Eesti majanduse pideva kasvu tagab IKT-lahenduste laialdane kasutamine;
3) avalik sektor on isikukeskne, läbipaistev ja tõhusalt toimiv.
Ka infoühiskonna arengukava koostamisel lähtus Eesti EL-i vastavatest strateegiatest
(„i2010 – A European Information Society for growth and employment”) ning seega on meie
neli aastat tagasi kirja saanud prioriteedid vastavuses ka Euroopa uusimas, 2010. aastal
d
heaks kiidetud infoühiskonna strateegias „Digital Agenda for Europe” sätestatud
eesmärkidega.
Infoühiskonna arengukava on strateegilisi eesmärke sätestav üldine dokument. Neid
eesmärke viiakse ellu iga-aastaste infoühiskonna arengukava rakendusplaanidega.
a
http://www.riigiteataja.ee/ert/act.jsp?id=75308
b
http://www.riso.ee/et/files/upload/Infopoliitika2.pdf
c
http://www.riso.ee/et/files/Infoyhiskonna_arengukava_2013.pdf
d
http://ec.europa.eu/information_society/digital-agenda/documents/digital-agenda-communication-en.pdf
INFOÜHISKOND INFORMATION SOCIETY 15
17.
INFOÜHISKONNA ARENDAMISEST EESTISDEVELOPMENT OF INFORMATION SOCIETY IN ESTONIA
Rakendusplaanides on kirjas konkreetsed tegevused koos vastutajate ja hinnangulise
eelarvega. 2010.–2011. aasta rakendusplaani prioriteedid on
inimeste teadmiste, oskuste ja osalusvõimaluste suurendamine,
Eesti uue põlvkonna lairibavõrgu arendamine,
e-ärikeskkonna arendamine,
avalike teenuste, sh infoteenuste arendamine,
eID ehk elektroonilise identiteedi laiaulatuslik kasutuselevõtt,
riigi infosüsteemide koosvõime suurendamine, sh süsteemide täiustamine ja
andmete korrastamine.
Infotehnoloogia (IT) ei ole eesmärk omaette, vaid vahend, mis aitab tõsta eri
eluvaldkondade toimimise taset. Sestap peab IT olema läbiv teema kõigi valdkondade
poliitikadokumentides. Infoühiskonna arengukava näeb ette, et valitsusasutused arvestavad
oma arengukavade koostamisel ja täiendamisel infoühiskonna arengukava põhimõtteid, ning
määrab kindlaks nende eesmärkide saavutamiseks vajalikud tegevused. Seega on
infoühiskonna arengukava vastastikku toetav näiteks selliste arengukavadega nagu „Eesti
ettevõtluspoliitika 2007–2013”, teadus- ja arendustegevuse strateegia „Teadmistepõhine
Eesti 2007–2013” (eelkõige selle raames välja töötatud IKT programm), kuid on seotud ka
paljude teiste strateegiatega, nagu „Õppiv tiiger”, „Digitaalne kultuuripärand” jt.
Peale infoühiskonna arengukava on oluline riigi infopoliitika kujundamist käsitlev dokument
a
ka „Riigi IT koosvõime raamistik” . Koosvõime raamistik koos sellest tulenevate
dokumentidega kirjeldab, kuidas liita avaliku sektori infosüsteemid ühtseks tervikuks ja
kuidas need koos erasektori infosüsteemidega toetavad riigi ümberkorraldamist
infoühiskonna tingimustele vastavaks. Lühemalt ja konkreetsemalt öeldes on koosvõime
raamistiku eesmärk muuta Eesti avaliku sektori tegevus efektiivsemaks, parandades Eesti ja
EL-i elanikele ja ärisektorile pakutavate teenuste kvaliteeti. Raamistik luuakse koostöös
avaliku ja erasektoriga ning selle järgimine on kohustuslik kõigile avaliku sektori asutustele.
Koosvõime raamistiku dokumendid käsitlevad järgmisi teemasid: semantiline koosvõime,
infoturbe koosvõime, tarkvara ja veebide koosvõime, dokumendihalduse koosvõime, avatud
standardid, riigi infosüsteemi arendusprotsessi kirjeldus, riigi IT arhitektuur ja
infrastruktuuriteenused.
Nagu eespool toodud ülevaatest järeldada võib, on infoühiskonna arendamise
koordineerimine Eestis üsna detsentraliseeritud. Riigi infopoliitika arendamise
koordineerimise eest vastutab Majandus- ja Kommunikatsiooniministeeriumi riigi
infosüsteemide osakond ning ametkondadeüleseid projekte valmistab ette ja rakendab Riigi
Infosüsteemide Arenduskeskus. Suures osas aga võivad riigi- ja omavalitsusasutuste
IT-juhid infosüsteemide arendamist puudutavad otsused ise teha, lähtudes üldistest
kokkulepitud prioriteetidest. Samal ajal on nii Eestis kui ka mujal maailmas märgata
suuremat tsentraliseerimistendentsi.
Et tagada avaliku sektori koordinatsioon era- ja kolmanda sektori organisatsioonidega, on
Majandus- ja Kommunikatsiooniministeeriumi ja kolmanda sektori vahel loodud
informaatikanõukogu, mida juhib majandus- ja kommunikatsiooniminister. Nõukogu
ülesanne on nõustada valitsust infoühiskonna küsimustes. Peale selle toimub pidev ja tihe
koostöö kolmanda sektori organisatsioonidega, näiteks Eesti IKT ettevõtteid koondava Eesti
Infotehnoloogia ja Telekommunikatsiooni Liidu, e-valitsuse ja infoühiskonna kompetentsi-
keskuse e-Riigi Akadeemia, Eesti Infotehnoloogia Sihtasutuse jt-ga.
Allikas
Source
Praust, V. (1998). Infoühiskond ja selle teetähised. – Infotehnoloogia haldusjuhtimises.
Aastaraamat 1998. [www] http://www.riso.ee/et/pub/1998it/12.htm
a
http://www.riso.ee/et/koosvoime/raamistik
16 INFOÜHISKOND INFORMATION SOCIETY
18.
INFOÜHISKONNA ARENDAMISEST EESTISDEVELOPMENT OF INFORMATION SOCIETY IN ESTONIA
DEVELOPMENT OF INFORMATION SOCIETY POLICY
IN ESTONIA
Karin Rits
Ministry of Economic Affairs and Communications
We probably all agree that to declare one’s taxes is much more convenient over the Internet
than to do it on paper, to park one’s car over a mobile phone is a lot more comfortable than
to search parking meters, and to make an appointment with a doctor over the Internet is
considerably more convenient than to wait one’s turn for registration on the phone. What we
evidently do not unanimously agree with is what the term “information society” exactly
stands for. For some, it means electronic tax declarations and mobile-parking; for some, it
denotes iVoting; and for some, it means a possibility to do things differently and more
efficiently with the help of technology. And all of them are right. Information society has been
defined in various ways, but in drawing up Estonia’s information policy documents the
definition by Valdo Praust (Praust: 1998) has predominantly been taken as a basis.
According to Praust, information society denotes a society, where most of the values
created by mankind are contained in information. Most of the information stored by the
society is maintained, transformed and transmitted in a universal digital form. By using a
common data exchange network, all members of the society have access to information.
Furthermore, in the information society, all the routine mental work is entrusted to machines.
The following is a brief overview of policy formulation and co-ordination in the field of
information society in Estonia.
In Estonia, information society has been purposely developed for years. The first state
a
information policy document Principles of Estonian Information Policy was adopted by the
Estonian Parliament (the Riigikogu) in 1998. The document sets out principles from which
the state should proceed when making public policy decisions in support of the information
society. The document establishes, for instance, that the state information policy shall
contribute to the enhancement of economic competitiveness, maintaining of the Estonian
language and culture, promoting of democracy, and increasing of the efficiency of national
defence. The principles intended for the development of information society set out in the
document are still valid.
b
Principles of Estonian Information Policy 2004–2006 , approved by the government in 2004,
is a follow-up to the first policy document on the Estonian information policy principles. With
respect to the given document, it also needs to be emphasized that, at the time of drafting
the document, Estonia was about to join the European Union (EU). Thus, the information-
politicy priorities and strategies of the EU (eEurope, eEurope+) were reflected also in our
national strategy. The two first information policy documents of Estonia primarily focused on
the creation of necessary infrastructure and development and take-up of e-services.
c
However, the Estonian Information Society Strategy 2013 , approved by the Government in
2006, has a considerably wider scope, treating information and communication technology
(ICT) as a tool enabling to enhance the efficiency and competitiveness of the whole
economy and society. At the centre of the strategy is the individual and his/her quality of life
and the document sets out measures in three dimensions: social, economic and institutional.
The three main objectives of the information society strategy are the following:
1) each member of the society leads a full life, using the opportunities of the
information society in every possible way and actively participating in public life
(“nobody will stay or will be left behind”);
2) Estonia’s economic growth is based on the wide use of ICT solutions;
3) public sector is citizen-centred, transparent and efficient.
When elaborating the information society strategy for Estonia, relevant EU-level policy
documents (e.g. i2010 – A European Information Society for Growth and Employment) were
a
http://www.riigiteataja.ee/ert/act.jsp?id=75308 (in Estonian)
b
http://www.riso.ee/en/files/Principles%20of%20the%20Estonian%20Information%20Policy%202004–2006_0.pdf
c
http://www.riso.ee/en/system/files/Estonian%20Information%20Society%20Strategy%202013.pdf.
INFOÜHISKOND INFORMATION SOCIETY 17
19.
INFOÜHISKONNA ARENDAMISEST EESTISDEVELOPMENT OF INFORMATION SOCIETY IN ESTONIA
taken into account. Thus, the priorities established four years ago are well in accordance
with the objectives set out in the most recent European information society strategy Digital
a
Agenda for Europe .
The information society strategy is a general document establishing longer-term strategic
objectives. These objectives are implemented on the basis of annual information society
implementation plans, which set out concrete activities with responsible authorities and
estimated budgets. Priorities of the 2010–2011 implementation plan are the following:
improvement of the knowledge and skills of and opportunities for participation for all
people,
development of Estonia’s new generation broadband network,
development of electronic business environment,
development of public services, incl. information services,
wide take-up of eID or electronic identity,
enhancement of the interoperability of the state information systems, incl. upgrading
of the systems and organisation of data.
Information technology (IT) as such is not an end in itself, but an instrument allowing to
qualitatively change the functioning of different fields of life. Thus, IT ought to be a horizontal
element in the policy documents of all fields. The information society strategy envisages that
state agencies take the principles of the information society strategy into account and
translate them into relevant activities when they prepare and update their development plans
or strategies. Therefore, the information society strategy is mutually complementary with
several other development plans, such as the Estonian Enterprise Policy 2007–2013; the
Estonian R&D strategy Knowledge-Based Estonia 2007–2013 (in particular the ICT
Programme developed in the framework of the strategy), and related to a lot of other
strategies like Learning Tiger, the Strategy for the Preservation of Estonian Digital Heritage,
etc.
Another important document governing the development of state information policy is the
b
Estonian IT Interoperability Framework . Interoperability Framework and the related
documents describe how to make different public sector information systems function as a
single interoperable whole and how these systems, together with private sector information
systems, support the reorganisation of the state for its functioning in the information society.
In short, the objective of Interoperability Framework is to enhance the public sector
efficiency in Estonia by improving the quality of services provided to citizens and enterprises
both in Estonia and in the EU. The framework is developed in close co-operation between
the public and the private sector and following thereof is obligatory for all public sector
agencies. The Interoperability Framework documents deal with the following areas:
semantic interoperability, information security interoperability, software and web
interoperability, records management interoperability, open standards, description of the
state information system’s development process, state IT architecture, and infrastructure
services.
As the aforementioned enables to conclude, co-ordination of the development of information
society in Estonia is rather decentralised. The Ministry of Economic Affairs and
Communications, in particular the Department of State Information Systems thereof, is the
main co-ordinator of the development of state information policy. Preparation and
implementation of cross-institutional projects is the responsibility of Estonian Informatics
Centre. However, decisions concerning the development of information systems are mostly
taken by IT managers of central and local government agencies, based on commonly
agreed priorities. At the same time, a trend towards greater centralisation can be noticed
both globally and in Estonia.
In order to ensure horizontal co-ordination between the public sector on the one hand and
the private and third sector organisations on the other hand, the Estonian Informatics
Council has been set up. The aim of the Council, chaired by the Minister of Economic Affairs
and Communications, is to advise the Government on various information society related
aspects. In addition, there is constant dialogue and close co-operation with third sector
a
http://ec.europa.eu/information_society/digital-agenda/documents/digital-agenda-communication-en.pdf
b
http://www.riso.ee/en/files/framework_2005.pdf
18 INFOÜHISKOND INFORMATION SOCIETY
20.
INFOÜHISKONNA ARENDAMISEST EESTISDEVELOPMENT OF INFORMATION SOCIETY IN ESTONIA
organisations, such as the Estonian Association of Information Technology and
Telecommunications embracing Estonian ICT enterprises, the e-governance and information
society competence centre eGovernancy Academy, Estonian Information Technology
Foundation, etc.
INFOÜHISKOND INFORMATION SOCIETY 19
21.
EESTI ID-KAART IDCARD IN ESTONIA
EESTI ID-KAARDI AJALUGU, HETKEOLUKORD JA
TULEVIK
Kalev Pihl
AS Sertifitseerimiskeskus
Eestis praegu kehtiv riiklik isikutuvastussüsteem loodi 1992. aastal. Kuni 1. oktoobrini 2010
oli uue süsteemi keskne organ Kodakondsus- ja Migratsiooniamet (KMA), nüüd aga Politsei-
a
ja Piirivalveamet . Politsei- ja Piirivalveamet (kuni 01.10.2010 KMA) väljastab
isikutunnistusi – alates 1992. aastast passe ja alates 2002. aastast ka elektroonilise
isikutunnistuse (eID) funktsioonidega ID-kaarte.
Esimesed Eesti Vabariigi passid andis KMA välja 1992. aastal. KMA ülesanne on väljastada
Eesti kodanikele ja välismaalastele passe, aga ka ajutisi reisidokumente, meremeeste
teenistusraamatuid, meresõidutunnistusi ja pagulaste reisidokumente. Esimesel kümnel
taasiseseisvumisele järgnenud aastal oli ainus riigis kehtiv isikutunnistus Eesti Vabariigi
pass.
Et esimesed Eesti passid tuli 2002. aastal välja vahetada, oli valitsusel võimalus välja
töötada uut laadi isikutunnistuse kontseptsioon. Ilmselge oli, et väga suur osa inimesi
hakkab juba 2002. aasta algul oma passe välja vahetama, sest 1992. aastal püüdsid paljud
saada endale Eesti passi nii kiiresti kui vähegi võimalik.
Teist tüüpi isikutunnistuse väljatöötamise mõte tuli 1997. aastal ja selle tulemusena loodi
ID-kaart, kuhu on võimalik salvestada digitaalallkirjade andmiseks vajalikku elektroonilist
isikutuvastusteavet. Esimesed ID-kaardid väljastati aastatel 2002–2006. Et ID-kaart on
kohustuslik kõigile üle 15 aasta vanustele Eesti kodanikele, on praegu aktiivses kasutuses
umbes 1–1,1 miljonit kaarti. Peale eID funktsiooni lisati 2007. aastal ID-kaardile ka mobiilse
eID lahendus.
ID-kaardi väljatöötamine
Uue generatsiooni isikutunnistuse juurutamiseks hakkas KMA valmistuma 1997. aastal.
Loodi mitu töörühma, mille liikmed kuulusid nii era- kui ka avaliku sektorisse. Juurutustööle
eelnenud uuringutest selgus, et eID tehnoloogia arengu tase oli selleks ajaks piisavalt kõrge,
et see tehnoloogia üle riigi kasutusele võtta, ja et eelkõige digitaalallkirjade andmise
vajaduse tõttu oli ühiskonnas nõudlus elektrooniliste ID-kaartide järele. Uuringule järgnenud
töö võib jagada neljaks etapiks: sellekohaste seadusesätete vastuvõtmine, korralduslikud ja
tehnilised ettevalmistused, ID-kaartide väljastamine ning ID-kaartide kasutuselevõtt.
Juriidiline etapp vältas oodatust kauem, sest elektroonilise isikutuvastuse ja
digitaalallkirjastamise teemad olid tollal veel tundmatud ja vähe uuritud. Digitaalallkirja
seaduse mustandi koostamise eest vastutav töörühm alustas tööd 1997. aastal ja suutis
selle lõpetada alles ligikaudu kolme aasta pärast.
Ettevalmistusetapi ajal loodi 2001. aastal peamiselt just ID-kaardi projektis osalemise
eesmärgil kaks uut ettevõtet. Kaks riigi suurimat panka ja olulist telekomiettevõtet panid
aluse aktsiaseltsile Sertifitseerimiskeskus ning Šveitsi päritolu ettevõte TRÜB AG asutas
Eestisse firma Balti harukontori. Otsuse hakata mikrokiibi ja sertifikaatidega varustatud
ID-kaarte väljastama kõigile riigi kodanikele võttis 2001. aasta oktoobris viimase minuti
otsusena vastu peaminister Mart Laari valitsus. Otsuse vastuvõtmise algatas Linnar Viik,
peaministri nõunik infotehnoloogia vallas, ja sel oli Eesti ID-kaardi eduloos võtmeroll.
Esimene Eesti ID-kaart anti välja 2002. aasta 28. jaanuaril Eesti presidendile. 2006. aasta
oktoobris ületati miljoni kaardi künnis ja sellest ajast peale on aktiivsete kaartide arv püsinud
1–1,1 miljoni piires. ID-kaardi väljastamisel on selle kasutamise hõlbustamiseks ja
kasutusala laiendamiseks võetud tarvitusele mitu tarkvarasüsteemi ning jagatud välja
hulgaliselt digitaalallkirjastamiseks vajalikku tarkvara. ID-kaardi vähene elektrooniline
a
1. oktoobril 2010 ühendati Politseiamet, Keskkriminaalpolitsei, Julgestuspolitsei, Piirivalveamet ning Kodakondsus- ja
Migratsiooniamet Politsei- ja Piirivalveametiks.
20 INFOÜHISKOND INFORMATION SOCIETY
22.
EESTI ID-KAART IDCARD IN ESTONIA
kasutamine tõusis tähelepanu alla 2006. aastal ja see pani aluse uuele programmile
„Arvutikaitse 2009”.
ID-kaardi arendustööst võib esile tuua järgmised etapid.
Arendustöö 1996 – KMA alustas ID-kaardi projekti
kronoloogia ja 1997 – KMA korraldas alusuuringud ID-kaardi kasutuselevõtuks
olulisemad
sündmused 1998 – ID-kaardi esmane katsetus KMA-s
1999 – võeti vastu isikut tõendavate dokumentide seadus
2000 – valitsus kiitis heaks eID väljastamise plaani
2000 – võeti vastu digitaalallkirja seadus; loodi sertifitseerimise riiklik register (SRR)
2001 – poliitiline diskussioon: ID-kaart kohustuslikuks ja sertifikaadid kõigile
2001 – loodi AS Sertifitseerimiskeskus, mis võidab avaliku hanke, registreeritakse SRR-is;
Trüb AG võitis ID-kaartide riigihanke
2002 – anti välja esimene eID, valmis ühine allkirjastamise tarkvara
2003 – valmis eID Installer
2006 – lõppes esmane eID väljastamine
2006 – algatati programm „Arvutikaitse 2009”; eID kasutajaid 27 000
2007 – turule toodi mobiil-ID
2009 – tänu programmile „Arvutikaitse 2009” 300 000 eID kasutajat
Riiklik ID-kaart
ID-kaardil on esitatud järgmine info: kaardi omaniku perekonnanimi, eesnimi (või -nimed),
sugu, kodakondsus, sünniaeg, sünnikoht, isikukood, foto, allkiri, kaardi väljastamise ja
aegumise kuupäev ning dokumendi number. Alaliselt riigis elava välismaalase ID-kaardil on
märgitud ka elukoht ja töö- või elamisloa andmed. Peale arvukate turvalahenduste on
kaardil ka masinloetav kood.
Eesti ID-kaardi esikülg
INFOÜHISKOND INFORMATION SOCIETY 21
23.
EESTI ID-KAART IDCARD IN ESTONIA
Eesti ID-kaardi tagakülg
Allikad: Sertifitseerimiskeskus, Politsei- ja Piirivalveamet
ID-kaardile on salvestatud turvamata andmefail, mis sisaldab samu isikuandmeid, mis on
trükitud kaardi esi- ja tagaküljele. Olulisimad neist on kaardi omaniku nimi ja isikukood. Tänu
nimetatud andmefailile on kaarti kaarditerminali või -lugejasse sisestades võimalik kiirelt
selle omaniku andmeid tuvastada. See on kasulik näiteks sellistel juhtudel, kui ID-kaarti
kasutatakse kliendikaardina, raamatukogu, spordiklubi vms pääsmena või selleks, et
registreerida isiku sisenemine mõnele üritusele või territooriumile.
Esimesed ID-kaardid väljastati kümneks aastaks, kusjuures nende sertifikaadid kehtisid
kolm aastat. Sertifikaatide uuendamise eest lõpptarbijad maksma ei pea ja seda saab
kaardiomanik teha ka interneti teel. Alates 2006. aastast on ID-kaardi ja selle sertifikaatide
kehtivusaeg viis aastat.
Joonis 1 ID-kaart ja selle kasutajad, 2008–2010
Figure 1 ID card and users of ID card, 2008–2010
1 200 000 ID-kaarte
ID cards
1 000 000
800 000
600 000
400 000 ID-kaardi kasutajaid
Users of ID card
200 000
0
II III IV I II III IV I II III
2009 2010
Allikas/Source: Sertifitseerimiskeskus
22 INFOÜHISKOND INFORMATION SOCIETY
24.
EESTI ID-KAART IDCARD IN ESTONIA
Mobiil-ID
Peale eID tõi Eesti suurim mobiilsideoperaator EMT 2007. aasta maikuus koostöös
Sertifitseerimiskeskusega turule uue lahenduse – mobiil-ID. Suuruselt kaks järgmist Eesti
mobiilsideoperaatorit Elisa ja Tele2 tulid mobiil-ID teenustega turule 2009. aasta detsembris.
Mobiil-ID saamiseks peab mobiiltelefoni omanik oma tavalise SIM-kaardi välja vahetama
PKI-d (Public Key Infrastructure – avaliku võtme infrastruktuur) toetava kaardi vastu.
Mobiil-ID aktiveerimiseks vajab kasutaja oma ID-kaarti, mistõttu mobiil-ID väljastamine on
seotud ID-kaardi turvalisuse ja kvaliteediga. Mobiil-ID sertifikaatidele on salvestatud samad
isikuandmed nagu ID-kaardi sertifikaatidelegi.
Mobiil-ID lahendusel on kasutaja seisukohalt ID-kaardi ees teatavad eelised: mobiil-ID
kasutamiseks ei ole vaja kaardilugejat ega kindlat tarkvara.
ID-kaardi kasutusalad
Peale arvukate internetipõhiste teenuste, kus saab ID-kaarti kasutada, väärivad eraldi
mainimist veel kaks olulist rakendust.
ID-pilet. Üle 120 000 ID-kaardi kasutaja kannab oma isikutunnistust iga päev
endaga kaasas selleks, et tõestada oma sõiduõigust Tartu, Tallinna ja nende
lähiümbruse ühistranspordiliinidel. Ühe ja kahe tunni ning ühe, kolme, kümne,
kolmekümne ja üheksakümne päeva ID-pileteid saab osta internetis, mobiil- või
tavatelefoniga ja enam kui 80 müügipunktis ka sularaha eest. Piletikontrolörid
kasutavad sõiduõiguse kiireks ja automaatseks kontrollimiseks GPRS-ühendusega
käsiterminale.
Osaline juhilubade asendamise funktsioon. Peaaegu kõik Eesti Politsei autod on
varustatud seadmetega, mis võimaldavad teha päringuid juhilubade andmebaasis,
autokindlustuse andmebaasides ja autoregistrikeskuses. Kui autojuhil on ID-kaart
kaasas, on võimalik selle abil kindlaks teha tema isik ja muu oluline teave.
Kõikides nii avaliku kui ka erarektori olulisemates veebipõhistes rakendustes, mille
kasutamiseks on vaja läbida põhjalik autentimisprotsess, on autentimisvahendiks ID-kaart.
Enamikul veebilehtedel, kus saab ID-kaardiga sisse logida, on võimalik seda teha ka
mobiil-ID-ga.
Joonis 2 ID-kaarti elektrooniliselt kasutajate arv, 2002–2010
Figure 2 Number of electronic ID card users, 2002–2010
400 000 Kõik kasutajad
350 000 Users, total
300 000
250 000
200 000
150 000
100 000
50 000
Uued kasutajad
0 New users
2003 2004 2005 2006 2007 2008 2009 2010
Allikas/Source: Sertifitseerimiskeskus
Üks avaliku sektori tähelepanuväärseimaid teenuseid on Kodanikuportaal, mille kaudu
pääseb ligi suuremale osale riigis pakutavatele avalikele teenustele. Teine oluline teenus,
mida pakub Maksu- ja Tolliamet nii eraisikutele kui ka ettevõtetele, on võimalus deklareerida
makse veebis.
ID-kaardiga on võimalik ka internetis hääletada (e-hääletada). See on Eestis ametlik
hääletamismoodus ja selle tulemused on võrdväärsed sedelhääletuse omadega.
E-hääletamine oli esimest korda kavas 2005. aasta kohaliku omavalitsuse valimiste ajal ning
uuesti 2007. aasta parlamendivalimiste raames.
INFOÜHISKOND INFORMATION SOCIETY 23
25.
EESTI ID-KAART IDCARD IN ESTONIA
Joonis 3 E-valimistel osalenud, 2005, 2007 ja 2009
Figure 3 Participants in iVoting, 2005, 2007 and 2009
120 000
100 000
80 000
60 000
40 000
20 000
0
Kohaliku Riigikogu Europarlamendi Kohaliku omavalitsuse
omavalitsuse valimised 2007 valimised 2009 valimised 2009
valimised 2005 Riigikogu European Local government
Local government elections 2007 Parliament elections 2009
elections 2005 elections 2009
Allikas: vabariigi valimiskomisjon
Source: National Electoral Committee
Üks populaarsemaid ID-kaardiga autentimist nõudvaid e-teenuseid on e-kool. Erasektori
menukaim teenus on internetipangandus, kuigi ID-kaardiga sisselogimine ei ole
internetipankades kõige populaarsem valik. Finantssektori ettevõtetest kasutavad ID-kaardi
rakendusi ka Eesti väärtpaberite keskregister ja pensioniregister. Telekomiettevõtted
(nt Elion, EMT, Tele2) ja kommunaalteenuste osutajad (vee-, gaasi- ja elektrifirmad)
kasutavad ID-kaardiga autentimist oma iseteeninduskeskkondades.
Nimekirja ID-kaardiga autentimist võimaldavatest veebilehtedest leiab aadressilt
http://id.ee/?id=11456.
Digitaalallkirja andmine eID-ga
Üks ID-kaardi loomise peamisi põhjusi oli digitaalallkirja seaduse juurutamine ja Eesti
kodanikele digitaalallkirja andmiseks vajaliku väljundi loomine. Lõpptarbijatele ja
süsteemihalduritele mõeldud tarkvaralised tööriistad on tasuta kättesaadavad alates
2002. aastast ning neid on praeguseni pidevalt arendatud. Tänu sellele on eestlastel
tekkinud ühtne arusaam digitaalallkirjastatud dokumendifailidest, mis on täiesti standardsed
ja mida aktsepteeritakse kõikjal, sealhulgas kohtutes.
Tarkvara DigiDoc Client, millega saab anda ja tõestada digitaalallkirju, on üks osa
ID-kaardiga kaasas olevast tarkvarast, ja seda on võimalik installeerida igasse
kaardilugejaga ühendatud arvutisse.
Tänu selle tarkvara kasutuselevõtule on digitaalallkirjastamist hakatud rohkesti kasutama,
sest ülalnimetatud tarkvaratööriistadega loodud allkiri on võrdne käsitsi antava allkirjaga.
Seadustest võib leida ka niisuguseid juhtumeid, kus digitaalallkirja peetakse käsitsi antud
allkirjast tugevamakski (nt ettevõtete loomisel). Digitaalallkirja andmist soodustavad innukalt
ka internetipangad, nõudes kõigi tehingute digitaalset allkirjastamist (seda aga juhul, kui
kasutaja on sisenenud süsteemi ID-kaardi või mobiil-ID paroolidega).
ID-kaardi personaliseerimise eest vastutab AS TRÜB Baltic, kes saab sertifikaadid
Sertifitseerimiskeskuselt. Viimane osutab ka registreerimisasutustena toimivate
pangakontorite (Swedbank ja SEB) kaudu järelteenuseid (PIN-koodi ja sertifikaatide
uuendamine jne). Praegu väljastab Eestis ID-kaardi sertifikaate vaid Sertifitseerimiskeskus.
Rakenduste kasutamise soodustamine
Sertifitseerimiskeskus on olnud eID tugi-, reklaami- ja kvaliteedikeskus ID-kaardi turule
tulekust saadik. Sertifitseerimiskeskusel on ööpäev läbi avatud tugiliin (lühinumber 1777),
mis loodi esmalt üksnes selleks, et võimaldada sertifikaatide ajutist sulgemist, kuid mis
praegu osutab terviklikke klienditoe teenuseid. ID-kaardi veebilehelt www.id.ee leiavad nii
lõpptarbijad kui ka arendajad põhjaliku teabe eID-d puudutavate teemade kohta, muu hulgas
24 INFOÜHISKOND INFORMATION SOCIETY
26.
EESTI ID-KAART IDCARD IN ESTONIA
ka isekoolitusrakenduse, probleemide ja lahenduste rubriigi, hulgaliselt hästi struktureeritud
teavet jpm.
ID-kaardi tarkvara on olnud veebilehel https://installer.id.ee saadaval aastast 2003. Installer
on intelligentne rakendus, mis analüüsib arvuti konfiguratsiooni (sh seda, kas kaardilugeja
on arvuti taha ühendatud või mitte) ja installeerib kogu vajaliku tarkvara vaid ühe
nupuvajutusega. Vajaliku tarkvara hulka kuuluvad kaardilugeja draiverid üle kahekümne eri
lugeja tarvis, ID-kaardi tarkvara, veebipõhiseks allkirjastamiseks vajalikud veebipluginad,
teenuse sertifikaadid, kaardihaldusutiliit ning digitaalallkirjade andmiseks ja tõestamiseks
vajalik DigiDoc Client.
Tulevikuplaanid
Tulevikus uuendatakse tõenäoliselt ID-kaardi mikrokiipi. Uue põlvkonna ID-kaart plaanitakse
teha kättesaadavaks 2011. aastal ja sellega koos hakatakse väljastama Euroopa Liidu
elamisluba, millesse on juba paigaldatud RFID-mikrokiip, millele salvestatakse nii nagu
elektroonilistele passidelegi kaardiomaniku biomeetrilised andmed. See uuendus aga ei
muuda eID-d ennast ega ID-kaardi elektroonilisi funktsioone ja rakendusi. Et mobiil-ID
lahendustega on välja tulnud nii EMT, Tele2 kui ka Elisa, hakatakse tõenäoliselt tulevikus ka
mobiil-ID valdkonnale rohkem tähelepanu pöörama ja vastavaid rakendusi kasutama.
INFOÜHISKOND INFORMATION SOCIETY 25
27.
EESTI ID-KAART IDCARD IN ESTONIA
ID CARD IN ESTONIA – HISTORY, PRESENT DAY AND
FUTURE
Kalev Pihl
AS Sertifitseerimiskeskus
The present structure of national identity management in Estonia was established in 1992.
Until 1 October 2010, the Citizenship and Migration Board (CMB) functioned as the central
agency of the new system. Now the functions have been taken over by the Police and
a
Border Guard Board . The Police and Border Guard Board (CMB until 01.10.2010) issues
identity documents – passports since 1992, and ID cards bearing an electronic identity card
function (eID function) since 2002.
First passports of the Republic of Estonia were issued by CMB in 1992. The task of CMB is
to issue passports for Estonian citizens and aliens, temporary travel documents, seafarers’
discharge books, certificates of record of service on ships and refugees’ travel documents.
During the ten years after restoration of independence, passport of the Republic of Estonia
was the only national ID document.
Considering that the first generation of passports had to be renewed in 2002, the
Government had a chance to introduce a new concept of identity document. It was obvious
that a lot of people would come for a new passport starting from the beginning of 2002 as in
1992 people tried to get an Estonian passport as quickly as possible.
The idea to work out another type of identity document emerged in 1997, and as a result, a
national ID card, which could carry an eID and certificates for electronic signatures, was
designed. The first ID cards were issued during 2002–2006. As an ID card is obligatory for
all Estonian citizens older than 15 years, about 1 to 1.1 million cards are in active use at
present. Besides the eID function, also mobile eID solution was added to the national ID
card in 2007.
Timeline of the ID card development
Preparations for a “new generation identity document” started at CMB in 1997. Several
working groups were formed with representatives from the public sector and private sector.
Preliminary studies carried out prior to the introduction process confirmed that eID
technologies had developed far enough by that time to allow application on a nationwide
scale and that there is a demand in the society for electronic ID cards particularly due to a
necessity for digital signatures. The process following the studies can be divided into four
phases: passing of relevant legal provisions, organisational and technical preparations, roll-
out and uptake of ID cards.
The “legal phase” took longer than anticipated as topics of electronic identity and digital
signatures were still uncommon and not much studied at that time. The working group
responsible for preparing a draft of the Digital Signatures Act started its work in 1997 and it
took almost three years for them to finish the job.
The preparation phase saw the formation of two new companies in 2001, primarily for the
sake of participating in the ID card project: the establishment of AS Sertifitseerimiskeskus by
two largest banks of Estonia and two important telecom companies, and the creation of a
Baltic subsidiary of Swiss-based company TRÜB AG in Estonia. The last-minute decision to
deliver a chip- and certificate-equipped ID card to all citizens in Estonia was made by Prime
Minister Mart Laar in October 2001. That decision, initiated by Linnar Viik, advisor to Prime
Minister on information technology matters, played a crucial role in the success story of
Estonian ID card.
The first ID card of the Republic of Estonia was issued on 28 January 2002 to the President
of the Republic of Estonia. The milestone of 1 million cards was surpassed in October 2006
and from this time on the number of active cards has remained between 1.0 and 1.1 million.
a
On 1 October 2010 Police Board, Central Criminal Police, Personal Protection Service, Border Guard Administration,
and Citizenship and Migration Board were merged into the Police and Border Guard Board.
26 INFOÜHISKOND INFORMATION SOCIETY
28.
EESTI ID-KAART IDCARD IN ESTONIA
During the roll-out phase, several software releases have been issued in order to make
usage of the ID card easy and comprehensive, including wide distribution of digital signing
software. Low uptake of electronic usage of the ID card became an issue in 2006, resulting
in a new program “Computer Security 2009”.
Timeline and most 1996 – CMB started the ID card project
important events in the 1997 – Feasibility study and technical study were conducted for the uptake of ID card
development process
1998 – Initial piloting of ID card in CMB
1999 – The Identity Documents Act was passed
2000 – Plan for introduction of eID card was approved by the Government
2000 – the Digital Signatures Act was passed; the State Register of Certificates (SRC) was
established
2001 – Political discussion – to make ID card a mandatory document and supply everyone
with certificates
2001 – Set-up of AS Sertifitseerimiskeskus that became the winner of public procurement
and was registered with the SRC; Trüb AG became the winner of public procurement
and was selected as ID card manufacturer
2002 – First eID card was issued, a common digital signature system was launched
2003 – eID Installer was launched
2006 – Initial eID card roll-out was completed
2006 – The program “Computer Security 2009” was launched; 27,000 eID users
2007 – Mobile-ID was introduced
2009 – 300,000 eID users due to the program “Computer Security 2009”.
National ID card
The ID card contains the holder's surname, given name(s), sex, citizenship, date of birth,
place of birth, personal identification code (PIC), photo, signature, date of issue and date of
expiry and document number of ID card. For resident aliens with valid papers, the ID card
also contains residence and work permit or right of residence data. In addition to many
security features, the card has a machine-readable code.
ID card front cover
INFOÜHISKOND INFORMATION SOCIETY 27
29.
EESTI ID-KAART IDCARD IN ESTONIA
ID card back cover
Sources: AS Sertifitseerimiskeskus, the Police and Border Guard Board
Estonian ID card contains a data file, which is unprotected and includes the same personal
data that are visibly printed on the front cover and back cover of ID card. The most important
of them are name and Personal Identification Code (PIC) of the cardholder. This allows for
quick retrieval of personal data when the card is inserted in a terminal/smartcard reader, e.g.
when using the ID card as a loyalty card, as an entrance card to libraries, sport clubs etc., or
for quick registration to an event or for entering premises.
Initially ID cards were issued for a lifetime of ten years with certificate validity of three years.
Renewal of certificates is free of charge for end users and the process can be performed
over the Internet. Since 2006 both certificates and the card have a lifetime of five years.
(Figure 1)
Mobile-ID
In addition to the eID on the national ID card, in May 2007 a Mobile-ID was introduced to
Estonian market by the Estonian largest mobile operator EMT in co-operation with AS
Sertifitseerimiskeskus. The two other largest mobile operators Elisa and Tele2 started to
offer Mobile-ID services in December 2009. In order to get a Mobile-ID, the user needs to
replace his SIM-card by a PKI-capable one (PKI – Public Key Infrastructure). The user
needs to “activate” his Mobile-ID with his ID card. Thereby issuance of the Mobile-ID is
bound to the security and quality of the ID card. Mobile-ID certificates contain the same
personal information as the ID card certificates.
Mobile-ID provides certain advantages for the end user compared to the ID card: the user
does not need a smartcard reader or any specific software.
Applications of ID card
Besides lots of online services in case of which ID cards can be applied, there are two
remarkable applications to be mentioned separately:
ID-ticketing. Over 120,000 users carry the ID card every day to prove their
entitlement to travelling in public transportation in Tartu, Tallinn and surroundings.
Tickets for one to two hours, or for one, three, ten, thirty or ninety days can be
28 INFOÜHISKOND INFORMATION SOCIETY
30.
EESTI ID-KAART IDCARD IN ESTONIA
obtained using the Internet, mobile or landline phone, or paying in cash in more than
80 sales points. Checking officers are carrying GPRS-enabled handheld terminals
for quick and automatic entitlement checking.
Partial replacement of driver’s documents. Almost all police cars in Estonia are
equipped with devices for querying information from the driver’s license database,
car insurance databases and Motor Vehicle Registration Centre. When a car driver
has his ID card with him, it would allow checking the identity and retrieving all other
relevant information.
All main web-based applications requiring strong user authentication make use of the ID
card both in public and private sector. Most sites supporting ID card login also support
Mobile-ID. (Figure 2)
In the public sector, one of the most notable services is the Citizen Portal, which links to the
majority of available public services via a single point of entrance. Another important service
is provided by the Estonian Tax and Customs Board allowing tax declarations online for
natural persons as well as companies.
ID card is also an enabler of Internet voting (iVoting), which is an official method of voting in
Estonia and produces binding results. It was introduced in 2005 for elections of local
governments and repeated in 2007 for elections of the Parliament of Estonia. (Figure 3)
One of the most popular e-services accessible with the ID card is e-school (e-kool). Internet
banking is the most popular e-service in the private sector, although logging into Internet
banks with an ID card is not the most popular option. In the financial sector, the Estonian
Central Securities Register and Pension Register also make use of ID card authentication.
Telecom companies (e.g. Elion, EMT, Tele2) and utility companies (water, gas and
electricity companies) make use of the ID card authentication in their self-service
environments.
A list of sites accepting ID card authentication can be found on http://id.ee/?id=11456.
Digital signatures with eID
One of the main reasons for introducing the ID card was the implementation of the Digital
Signatures Act and provision of means for digital signing for Estonian residents. Software
tools intended for end users and system integrators were released in 2002, they are
accessible free of charge, and have so far been developed further on a constant basis. As a
result, Estonians are sharing a common understanding of digitally signed documents in file
form, fully standardized and widely accepted by everyone, including courts.
A piece of software called DigiDoc Client, allowing for digital signature creation and
verification, comes with a package of the ID card software and it can be installed on every
computer with a smartcard reader attached.
Application of this software has resulted in massive use of digital signing as digital
signatures created with those tools are legally equivalent to a hand-written signature. There
are cases in the law where digital signatures are considered even to be stronger than
handwritten ones (e.g. in the establishment of companies). Digital signatures are massively
pushed by Internet banks as all transactions are required to be signed digitally (in case the
user logged in with his ID card or Mobile-ID passwords).
Personalization of ID card is carried out by AS TRÜB Baltic that requests certificates from
AS Sertifitseerimiskeskus. The latter also provides after-service (PIN renewal, certificate
renewal, etc.) through the bank offices (Swedbank and SEB) operating as registration
authorities. In Estonia, ID card certificates are currently issued only by AS
Sertifitseerimiskeskus.
Promotion of the use of applications
Sertifitseerimiskeskus has been the centre of eID support, promotion and excellence from
the very launch of the ID card. Sertifitseerimiskeskus operates a 24/4 phone support (short
number 1777) initially designated for certificate suspension only but providing full end-user
support nowadays. The ID card focused website www.id.ee contains comprehensive
INFOÜHISKOND INFORMATION SOCIETY 29
31.
EESTI ID-KAART IDCARD IN ESTONIA
information for end users and developers on a wide range of eID topics. This includes self-
training application, problem solver, massive amount of well-structured information, etc.
The ID card software has been available on the website https://installer.id.ee since 2003.
The Installer is an intelligent application which analyses configuration of the computer (incl.
attached smartcard reader if any) and installs all essential software with one-click button.
Essential software covers smartcard reader drivers for more than twenty different readers,
middleware for the ID card, web plug-ins for web-based signing, service certificates, card
management utility and DigiDoc Client for digital signing and digital signature verification in
the desktop environment.
Future perspectives
In the future, the ID card chip will evidently be updated. A next-generation ID card is
envisaged to be launched during 2011. Together with that also European Union residence
permits will be issued and those will contain an RFID chip with biometric information such as
in the electronic passports. This innovation, however, will not change anything with regard to
the definition of the eID and the electronic functionalities and applications for the ID card. As
the mobile operators EMT, Tele2 and Elisa have launched their Mobile-IDs, this will probably
result in more attention to the Mobile-ID field and wider usage of respective applications in
the future.
30 INFOÜHISKOND INFORMATION SOCIETY
32.
E-MAKSUAMET/E-TOLL E-TAX BOARD/ E-CUSTOMS
E-MAKSUAMET/E-TOLL – MAKSU- JA TOLLIAMETI
ISETEENINDUSKESKKOND
Tiina Lindroos
Maksu- ja Tolliamet
Maksu- ja Tolliamet (MTA) oli esimene Eesti riigiasutus, kes hakkas oma klientidele
internetiteenuseid pakkuma.
Ideed interneti teel pakutavatest teenustest hakati ellu viima 1999. aastal, kui pangad tegid
jõupingutusi, et suunata kliente internetipankadesse, mistõttu internetipankade klientide arv
kasvas jõudsalt. See oli märk, et võrgu kaudu pakutavate avalike teenuste laiema
juurutamisega saab kokku hoida hulga raha, seda enam, et pangad olid võrgukasutajate
harimisel ära teinud suure töö.
E-maksuameti/e-tolli 2000. aasta märtsis said füüsilised isikud esimest korda esitada oma tuludeklaratsioonid
algus elektroonselt Hansa- ja Ühispanga internetipanga kaudu. Eeldatavast 300 000
tuludeklaratsioonist loodeti saada elektroonselt 10 000. Projekti õnnestumist näitab see, et
kokku esitati elektroonselt 11 760 tuludeklaratsiooni, seega loodetust 10% enam.
Samal aastal sai alguse internetiteenuste pakett e-maksuamet/e-toll, kus nii füüsiline kui ka
juriidiline isik saab esitada, vaadata ja parandada deklaratsioone (käibedeklaratsioon
(KMD), tulu- ja sotsiaalmaksudeklaratsioon (TSD) ja füüsilise isiku tuludeklaratsioon
(FIDEK)), esitada käibemaksu tagastuse ja ümberkande taotlusi, vaadata saldosid ja
kontokaarte, saada infot teda huvitava isiku maksuvõla või selle puudumise kohta ning saata
kirju, mis loeti oma käega allkirjastatuks.
Murrangulised aastad 2003. aastaks olid ettevõtted e-maksuameti/e-tolli omaks võtnud. 2003. aasta lõpu seisuga
2003–2004 oli 63% käibedeklaratsioonidest ja 53% tulu- ja sotsiaalmaksudeklaratsioonidest esitatud
elektroonselt. Tuludeklaratsioonide esitanute osatähtsus aga oli teiste deklaratsioonide
esitanute omaga võrreldes siiski väike – 2002. aasta tuludeklaratsiooni esitas elektroonselt
kõigest 21% maksumaksjatest.
Aastal 2003 uuendati tuludeklaratsiooni põhjalikult – juurutati INF-deklaratsioonidel põhinev
deklaratsioonide eeltäitmine. INF-deklaratsioonidel kajastatakse maksusoodustusi
puudutavat informatsiooni, mis kantakse füüsilise isiku tuludeklaratsioonile, seega ei pea
füüsiline isik tõendama aasta jooksul tehtud kulusid, millelt on seadusega lubatud tulumaksu
tagasi küsida. Samal aastal anti teenusstandardiga lubadus tagastada enammakstud
tulumaks e-maksuametis/e-tollis deklaratsiooni esitanud klientidele viie tööpäeva jooksul.
2004. aastal loodi MTA kontaktkeskus elektroonse teenuse kasutajate abistamiseks. Tänu
sellele kasvas elektroonilise tuludeklaratsiooni esitanute arv 2002.–2004. aastal peaaegu
kolm korda (59%-ni) ja 2010. aastal esitas tuludeklaratsiooni elektroonselt 92,4%
maksumaksjatest.
2007. aasta sügisel lõppes veel üks oluline etapp e-maksuameti/e-tolli arengus – alates
2000. aastast muutumatu vormiga püsinud ja nii funktsionaalselt kui ka visuaalselt oma aja
ära elanud kollakasroheline e-keskkond tegi läbi uuenduskuuri. Nüüd on e-maksuamet/e-toll
üles ehitatud MTA visuaalse kontseptsiooni järgi ning on teenuste kasutamise
lihtsustamiseks loogilise menüüstruktuuri ja rollipõhise lähenemisega, s.t teenused on
rühmitatud era- ja ärikliendi vajaduste järgi.
Arvestussüsteemi Alates 2009. aastast on MTA-s kasutusel uus arvestussüsteem, mis pakub maksu-
uued põhimõtted kohustuste ja nende täitmise kohta senisest tunduvalt detailsemat infot ning muudab
maksuarvestuse arusaadavamaks. MTA avas igale isikule ühe ettemaksukonto. See on
konto, millel MTA haldab maksumaksja rahalisi toiminguid (nt raha laekumine, nõuete
tasumine, raha tagastamine jne). Ettemaksukontole raha kandmise aeg on isiku enda
otsustada ning maksude ja maksete ning muude maksuseadusest tulenevate rahaliste
kohustuste tasumiseks on kliendil vaid üks personaalne viitenumber. Kohustus arvestatakse
kontolt maha automaatselt kohustuse tähtaja saabudes. Kliendi rahalised kohustused
arvestatakse ettemaksukontolt maha nende tekkimise järjekorras, kusjuures 1. jaanuaril
2009 kehtima hakanud maksukorralduse seaduse § 105 järgi võetakse ühe ja sama
tähtpäevaga nõuete täitmisel aluseks maksuliigipõhine järjestus.
INFOÜHISKOND INFORMATION SOCIETY 31
33.
E-MAKSUAMET/E-TOLL E-TAX BOARD/ E-CUSTOMS
Tolli e-teenuste integreerimine e-maksuametisse/e-tolli
2002. aasta novembris ühendati Maksuameti ja Tolliameti IT-osakonnad, mis pani aluse tolli
veebipõhiste teenuste arendamisele ja hilisemale tolli e-teenuste integreerimisele
e-maksuametisse/e-tolli.
Oluline samm MTA e-teenuste arenduses tehti 1. mail 2006, kui e-maksuametis/e-tollis tuli
kasutusele veebipõhine tollideklaratsioonide töötlemise süsteem Complex ja teda toetavad
alamsüsteemid (lubade taotlemine, aruannete esitamine, tagatiste jälgimine) ning töö
lõpetas veebiväline tollideklaratsioonide töötlemise süsteem Asycuda, mis oli kasutusel
olnud alates 1999. aastast. Järk-järgult on e-maksuametisse/e-tolli lisandunud uusi
tolliteenuseid. Alates 2011. aastast on tollideklaratsioonide esitamine interneti teel
kohustuslik kõigile Euroopa Liidu tolliklientidele.
Üleeuroopaliste infosüsteemidega liitumine
Euroopa Liitu (EL) astumisega 1. mail 2004 liideti Eesti tollitariifistiku infosüsteem (ETT)
teistes liikmesriikides juba kasutusel olnud tollitariifistiku infosüsteemiga (TARIC) ja Eesti
transiidiinfosüsteem EL-is kasutusel oleva transiidisüsteemiga (ENCTS).
Üleeuroopaliste elektrooniliste tollisüsteemide rakendamiseks asuti 2005. aastal e-valitsuse
arenduskontseptsiooni ühe osana ellu viima EL-i e-tolli mitmeaastast strateegilist plaani
(Multi-Annual Strategic Plan). Kontseptsiooni aluseks on Lissaboni strateegia, mille EL-i
liikmesriigid 2000. aastal kümneaastase reformikavana heaks kiitsid ja mille eesmärk on
muuta EL maailma kõige konkurentsivõimelisemaks ja dünaamilisemaks teadmistepõhiseks
majanduskeskkonnaks.
2007. aastal võeti kasutusele elektroonne süsteem TIR-konventsiooni alusel toimuvate
transiitvedude andmete töötlemiseks (E-TIR).
2009. aastal viidi ellu osa mitmeaastasest strateegilisest plaanist. 1. juulil tulid kasutusele
üleeuroopaline impordi kontrolli süsteem (ICS – Import Control System), ekspordi kontrolli
süsteem (ECS – Export Control System) ja täiendatud funktsioonidega transiidisüsteem
(NCTS), et tagada ühiskonna kaitse riskipõhiste kontrollmeetmete kaudu EL-is.
Järgnevalt on esitatud e-maksuameti/e-tolli olulisemate teenuste kasutuselevõtt ajalises
järjestuses.
Olulisemate teenuste 2000 algus – internetis tuludeklaratsiooni esitamise võimalus füüsilistele isikutele
kasutuselevõtu 2000 lõpp – internetiteenuste pakett nii füüsilistele kui ka juriidilistele isikutele
kronoloogia
2003–2007 – INF-deklaratsioonid
2003 – tuludeklaratsiooni eeltäitmine
2004 – aktsiisideklaratsioonid; VIES-süsteem EL-i liikmesriikide käibemaksukohustuslase
numbri kontrollimiseks; liitumine EL-i tollitariifistiku süsteemiga TARIC ja transiidisüsteemiga
NCTS
2005 – üleeuroopalise e-tolli arendustööde algus; liitumine portaaliga X-tee
2006 – tollideklaratsioonid
2007 – maamaksu andmed internetis; e-maksuameti/e-tolli uue, tänapäevase keskkonna
loomine, TIR-vedude andmete töötlemine
2009 – uue arvestussüsteemi kasutuselevõtt, üleeuroopaliste impordi kontrolli süsteemi
(ICS), ekspordi kontrolli süsteemi (ECS) ja täiendatud funktsioonidega transiidisüsteemi
(NCTS) kasutuselevõtt, seejuures asendas NCTS süsteemid ENCTS ja E-TIR
2010 – riigisisese aktsiisikaupade järelevalve süsteemi JVIS, üleeuroopalise aktsiisikaupade
liikumise kontrolli süsteemi EMCS ja Tallinnas ettevõtlusega tegelevatele isikutele
müügimaksu deklaratsiooni lisandumine
E-maksuameti/e-tolli E-maksuamet/e-toll on mugav ja kiire ning selle kaudu saab maksuasjad korda ajada
kasulikkus kellaajast ja asukohast olenemata. Dokumendid saab esitada ilma maksuametisse kohale
tulemata ja vajaliku info kätte ilma ametniku vahenduseta.
Riigiametitevaheline andmete ristkasutus tähendab andmeesitajatele seda, et riigile juba
teadaolevaid andmeid ei ole vaja uuesti esitada, sest asutused saavad tööks vajalikud
andmed MTA hallatavast andmekogust.
32 INFOÜHISKOND INFORMATION SOCIETY
34.
E-MAKSUAMET/E-TOLL E-TAX BOARD/ E-CUSTOMS
E-maksuamet/e-toll aitab kokku hoida nii maksudeklaratsioonide ja maksuteadete
trükkimisele ja postitamisele kuluvat raha kui ka deklaratsioonide sisestamisele, vigaste
deklaratsioonide töötlemisele ning vastavate teatiste saatmisele kuluvat inimressurssi.
2010. aastal laekus elektrooniliselt üle 513 000 tuludeklaratsiooni (92,4% tulu-
deklaratsioonidest). Kui arvestada, et ühe deklaratsiooni andmebaasi sisestamiseks kulub
umbes neli minutit (s.o 15 deklaratsiooni tunnis), siis ainuüksi tuludeklaratsioonide
sisestamisel säästsime 34 200 töötundi. Deklaratsioonide trükkimisele kulus 2000. aastal üle
1,6 miljoni krooni, 2009. aastal aga 173 000 krooni.
Andmetöötluse automatiseerimine ja andmete ristkasutus võimaldab jälgida maksulaekumisi
reaalajas, tuua välja võimalikke maksuriske ja tänu infosüsteemidesse programmeeritud
kontrollireeglitele vähendab see inimliku eksimise võimalust.
E-maksuamet/e-toll pani aluse andmekogude ristkasutamisele. 2001. aastal kaasati
kasusaajana Sotsiaalkindlustusamet, Keskkriminaalpolitsei, Riigihangete Amet, Haigekassa
ja kohtutäiturid ning maksuamet töötas andmete ristkasutamiseks välja konkreetse asutuse
vajadustest lähtuvad e-teenuste paketid.
2005. aastal liitus MTA portaaliga X-tee (infosüsteemide andmevahetuskiht), mis tagab
riigiasutustele turvalise teabevahetuse. Riigiametitele, kel on maksukorralduse seaduse järgi
õigus teha päringuid maksukohustuslaste registris, on viidud päringud X-teesse.
Riigiametitevaheline andmete ristkasutus tagab kiire, ajakohase ja turvalise infovahetuse,
säästes inimressurssi ning posti- ja paberikulu.
Maksu- ja Tolliameti e-teenuste areng
MTA e-teenuseid täiendatakse kasutajate ettepanekutest lähtudes pidevalt, sest aja jooksul
klientide vajadused muutuvad. Praegu teevad inimesed keskmiselt üle 95% toimingutest
elektrooniliselt, mis tähendab, et nad on muudatused hästi vastu võtnud ja ootavad just
mugavusteenuste arengut. 2010. aastal hakati analüüsima võimalust lisada
e-maksuametisse/e-tolli süsteem, millega äriklient saaks sõlmida e-teenuste kasutamise
lepingut, volitada e-teenuste kasutajat või taotleda talle kasutajaõigusi. Eeldatavasti valmib
volituste/kasutajaõiguste andmise süsteem 2011. aasta lõpuks ja sellega luuakse ärikliendile
võimalus sõlmida e-teenuste kasutamise leping elektroonselt ja anda oma töötajatele või
võtta neilt ära kasutajaõigusi turvaliselt e-maksuameti/e-tolli keskkonnas ametnike
vahenduseta. Projekti eduka elluviimise korral muutub e-teenustele ligipääs veelgi
lihtsamaks.
Peale selle on elektroonsete teenuste pidev areng tingitud seaduste muudatustest.
E-maksuameti/e-tolli projektiga loodi tugev alus infoühiskonna arendamiseks avalikus
sektoris tasemel, mis vastaks võimalikult hästi kasutajate vajadustele ja peaks sammu
infotehnoloogia arenguga.
Koostöös pankadega ja vajaduse korral ka erasektori abi kasutades loodi süsteem, mis on
mõeldud selleks, et teha riigi kodanike ja ettevõtete teenindamine ning andmevahetuse
haldamise süsteem tõhusamaks. E-maksuamet/e-toll ei ole piiratud ja isoleeritud
infosüsteem, vaid paindlik lahendus, mida on võimalik kasutajate uute nõudmiste kohaselt
edasi arendada ning teiste süsteemidega liita. Seega on e-maksuametil/e-tollil
märkimisväärne panus nii maksude administreerimise kui ka terve avaliku sektori töö
tõhusamaks muutmisel.
Erakliendi teenused e-maksuametis/e-tollis
Enam kasutatavad Erakliendi valikus on enim kasutatav teenus füüsilise isiku tuludeklaratsiooni esitamise,
teenused vaatamise ja printimise võimalus.
Suurt osa kliente puudutab maamaksuteenus, mille kaudu on võimalik maamaksuteadet
vaadata ja printida või jälgida kliendile kuuluvaid kinnistuid, maksustamise infot ja tasutavat
maamaksu summat, loobuda paberil maamaksuteatest ning tellida info maamaksuteate
koostamise kohta oma e-posti aadressile.
Olulised ja informatiivsed teenused eraisikule on väljamaksete ja tasumiste rubriigis, sest
nende abil on võimalik pidevalt jälgida, kas tööandja on deklareerinud temale tehtud
INFOÜHISKOND INFORMATION SOCIETY 33
35.
E-MAKSUAMET/E-TOLL E-TAX BOARD/ E-CUSTOMS
väljamaksed korrektselt ja tasunud sellelt kinnipeetud maksud ja maksed. Füüsilisele isikule
on nähtavad tööandjatelt temale tehtud väljamaksed ja kinnipeetud tulumaks kuude kaupa,
tööandja arvestatud ja tasutud sotsiaalmaksu andmed, Sotsiaalkindlustusametile üle kantud
sotsiaalmaks ning arvestatud ja tööandja tasutud andmete erinevused. Samuti on esitatud
andmed tööandja deklareeritud ja makstud ning MTA-lt Eesti Väärtpaberikeskusele (EVK)
edasi kantud kogumispensioni kohta ning tasutud ja EVK-le üle kantud sotsiaalmaksu osa.
Nõuete ja kohustuste rubriigis on erakliendil võimalik jälgida nõuete saldot ja
ettemaksukontol olevat summat ning tehtud toiminguid. Ettemaksukontol olevat summat
saab kasutada nõuete tasumiseks või taotleda tagasi oma pangakontole.
Metsainfo rubriik on raieõiguse ning metsamaterjali ostu ja müügi tehingute teatiste
esitamiseks ja puudutab nii metsa müüvaid metsaomanikke kui ka neid, kes ostavad
ümarpuitu küttepuuks või muuks otsatarbeks üle 20 tihumeetri aastas.
Raskeveokimaksu rubriigis saab vaadata Eesti Riiklikus Autoregistrikeskuses isiku nimel
registreeritud raskeveoki(te) andmeid ja nende alusel tasutavat raskeveokimaksu.
Erakliendi valikus on deklaratsioonidest olemas ka tulu- ja sotsiaalmaksu ning kohustusliku
kogumispensioni ja töötuskindlustusmaksete deklaratsioon (TSD), mille esitab füüsiline isik
juhul, kui ta on teise füüsilise isiku (nt lapsehoidja) tööandja. Elektri- ja kütuseaktsiisi
deklaratsioon tuleb esitada, kui füüsiline isik kasutab oma majapidamises enda toodetud
elektrienergiat või kui ta tarbib elektrit sellise liini kaudu, mis ei ole ühendatud
võrguettevõtjaga.
Peale selle on eraisikul võimalik täita reisija deklaratsiooni tollideklaratsioonide töötlemise
süsteemis Complex ja kinnitada aktsiisikauba soetamisel tehingut aktsiiskauba järelevalve
süsteemis JVIS.
Seadistuste rubriigis on võimalik muuta püsiparooli, lugeda sõlmitud e-teenuste lepingut,
kiirviidete all tõsta enam kasutatavad teenused esilehele ning muuta kontaktandmeid.
Rubriigis „Teated MTA-le” saab saata turvaliselt kirju ja küsimusi, mis loetakse oma käega
allkirjastatuks.
Ärikliendi teenused e-maksuametis/e-tollis
Deklaratsioonid E-maksuametis/e-tollis saab esitada järgmisi deklaratsioone: käibedeklaratsioon, kauba
ühendusesisese käibe aruanne (VD), kauba ühendusesisese käibe muutmise aruanne
(VDP) ja kauba ühendusesisese käibe aruande hetkeseis (VDA), tulu- ja sotsiaalmaksu-
ning kohustusliku kogumispensioni ja töötuskindlustusmaksete deklaratsioon,
INF-deklaratsioonid, aktsiisideklaratsioonid (alkoholiaktsiis, ühekordne alkoholiaktsiis,
energiatoote aktsiis, ühekordne kütuseaktsiis) ning müügimaksu deklaratsioon Tallinnas
ettevõtlusega tegelevatele isikutele.
Joonis 1 E-maksuameti/e-tolli kaudu esitatud maksudeklaratsioonid, 2000–2010
Figure 1 Tax returns submitted via e-tax/e-customs, 2000–2010
100 %
90
80
70
60
50
40
30
20
10
0
2000 2001 2002 2003 2004 2005 2006 2007 2008 2009 2010
Käibedeklaratsioon Tulu- ja sotsiaalmaksudeklaratsioon
Value added tax return Income and social tax return
Tuludeklaratsioon
Income tax return
Allikas: Maksu- ja Tolliamet
Source: Tax and Customs Board
34 INFOÜHISKOND INFORMATION SOCIETY
36.
E-MAKSUAMET/E-TOLL E-TAX BOARD/ E-CUSTOMS
Maksuarvestus- Nõuete ja kohustuste rubriigis on järgmised teenused: nõuete saldode vaatamine, nõuete ja
teenused nendega seotud toimingute otsing valitud ajavahemiku kohta, ettemaksukonto saldo
kuvamine, ettemaksukonto toimingute otsing (nt raha liikumise jälgimine valitud
ajavahemikul); tagastus- ja ümberkandetaotlused ning võimalus jälgida taotluste staatust ja
ajalugu; saldopäringud; maamaksu andmed ning võimalus loobuda paberteatest ja tellida
info maamaksuteate kohta oma e-posti aadressile.
Mugavusteenused Seadistuste rubriigis on võimalik vaadata sõlmitud lepingut, muuta kontaktandmeid ja
vajaduse korral parooli, kiirviidete kaudu seadistada esilehele teenuste otselinke, muuta
esindatavate nimesid nii, et need oleksid rippmenüüs reastatud kasutajale sobivas,
tähestikulises järjestuses (mugav teenus raamatupidamisteenuseid pakkuvale ettevõttele)
Rubriigis „Teated MTA-le” on võimalik saata MTA-le teade ja lugeda saabunud/saadetud
teateid. Selles rubriigis saadetud teated/kirjad loetakse oma käega allkirjastatuks.
E-maksuametis/-e-tollis pakutakse järgmisi tolliteenused.
Tolliteenused Complex – tollideklaratsioonide ja reisija deklaratsioonide esitamise süsteem isikutele, kes
ekspordivad kaupa väljapoole EL-i ja/või impordivad kaupa väljastpoolt EL-i. Süsteem on
mõeldud ka varude teadete esitamiseks.
Eesti Tollitariifistik (ETT) – päring isikutele, kes peavad kaubavahetust EL-i väliste riikidega.
ETT võimaldab teha veebipõhiseid päringuid kauba impordil/ekspordil kasutatavate
kaubakoodide, rakendatavate abinõude ja valuutakursside kohta ning arvutada
impordimakse.
ECS2 (Export Control System) – ekspordi kontrolli süsteem võimaldab kauba väljaveol
EL-ist esitada ülddeklaratsioone, kui tollideklaratsiooni esitamine ei ole nõutav. ECS2BRD
(Export Control System Border) – ekspordi kontrolli süsteem piiril võimaldab esitada teateid
selle kohta, et eksporditav kaup on saabunud väljumistolliasutusse (mere- ja õhutranspordi
korral). OMF (Outward Manifest) – väljumismanifestide töötlemise süsteem on mõeldud
laeva/lennuki lastimanifestide ja väljumisteadete esitamiseks.
ICS (Import Control System) – impordi kontrolli süsteem võimaldab esitada kauba
sissetoomise ülddeklaratsioone, kaupade loendeid ja kaubamanifeste.
NCTS (New Computerized Transit System) – turvalisuse ja julgeoleku meetmete
rakendamiseks töösse tulnud täiendatud funktsioonidega transiidisüsteem asendas alates
01.12.2003 transiidideklaratsioonide elektroonseks esitamiseks kasutusel olnud süsteemi
ENCTS (Estonian New Transit System) ja alates 01.07.2007 asendab TIR-veo
elektroonsete andmete edastamiseks kasutusel olnud TIR-süsteemi.
EORI (Economic Operators Registration and Identification System) – EL-i riikides kasutatav
ettevõtjate registreerimise ja identifitseerimise süsteem, milles registreeritud numbrit tuleb
1. juulist 2009 kasutada kaupade importimisel, transiitvedudel, eksportimisel ja/või muudel
tollitoimingutel.
Aktsiisikaupade JVIS – riigisisene aktsiisikaupade tollijärelevalve infosüsteem, mis võimaldab esitada
järelevalve eelteadet, teadet ja taotlust.
infosüsteemid
EMCS (Excise Movement and Control System) – EL-i riikide vaheline aktsiisikaupade
liikumise ja kontrolli süsteem kauba lähetamiseks ning vastuvõtmiseks ajutise
aktsiisivabastuse korral. Süsteem võimaldab esitada saatedokumenti eSL, muuta sihtkohta
ja lähetamise kellaaega ning vormistada vastuvõtuteadet.
INFOÜHISKOND INFORMATION SOCIETY 35
37.
E-MAKSUAMET/E-TOLL E-TAX BOARD/ E-CUSTOMS
E-TAX BOARD / E-CUSTOMS – SELF-SERVICE
ENVIRONMENT OF THE ESTONIAN TAX AND
CUSTOMS BOARD
Tiina Lindroos
Estonian Tax and Customs Board
The Estonian Tax and Customs Board (ETCB) was the first state authority in Estonia that
started to offer web services to its clients.
The idea of offering internet-based services was first realised in 1999 when banks made
efforts to direct their clients into Internet banks, due to which the number of Internet bank
clients started to increase quickly. This showed that wider introduction of internet-based
public services would enable to cut costs to a considerable extent, considering also that
banks had gone to great lengths to educate web users.
Beginning of e-tax / In March 2000, for the first time natural persons got a possibility to submit their electronic
e-customs income tax returns via the Internet banks of Hansapank and Ühispank. Out of the expected
300,000 income tax returns, it was anticipated that 10,000 would be submitted by electronic
means. The success of the project was evident in the number of income tax returns
submitted electronically, i.e. 11,760, which was 10% more than hoped.
In the same year, the e-tax/e-customs packet of web services was launched, where both
natural and legal persons could submit, view and correct their tax returns (value-added tax
returns (form KMD), declarations of income and social tax (form TSD) and income tax
returns of natural person (form FIDEK)), submit applications for the refund of value-added
tax and transfers of overpaid amounts, view balances and account cards, obtain information
about potential tax arrears of persons of interest and send emails, which were deemed to be
signed by hand.
Critical years By 2003, Estonian companies had accepted e-tax/e-customs. As at the end of 2003, 63% of
2003–2004 value-added tax returns and 53% of income and social security tax returns were submitted
by electronic means. However, the proportion of those who submitted income tax returns
was still low compared to other declarations – in 2002, only 21% of taxpayers submitted
their income tax returns electronically.
In 2003, income tax return underwent a thorough renewal – pre-filling of forms based on INF
declarations was introduced. INF declarations reflect data on tax incentives, which are
entered in the income tax return of a natural person, thus the latter is not required to certify
the expenses he/she has incurred during the year and which are subject to income tax
refund pursuant to law. In the same year, the service standard was supplemented with a
promise to return overpaid income tax to clients who submitted their tax return via e-tax/e-
customs within five working days. In 2004, a contact centre of the Estonian Tax and
Customs Board was established to assist the users of electronic services. As a result, the
number of taxpayers who submitted their income tax returns electronically grew almost three
times from 2002 to 2004 (to 59%), and in 2010, already 92.4% of taxpayers submitted
electronic income tax returns.
In the autumn of 2007, another important stage in the development of e-tax/e-customs was
completed – the yellowish green e-environment that had not been changed since 2000 had
both functionally and visually exhausted itself, and thus it underwent a renewal. Today, the
e-tax/e-customs has been structured using the visual concept of the Tax and Customs
Board offering logical menus and role-based approaches to facilitate the use of services, i.e.
services have been grouped according to the needs of private and business clients.
New calculation Since 2009, the Estonian Tax and Customs Board has been using a new calculation system,
principles which provides more detailed information than before about tax liabilities and discharge
thereof, and makes accounting for taxation purposes more understandable. The Board
opened one prepayment account for each person. It is an account, on which the Board
administers financial operations of the taxpayer (i.e. collection of money, fulfilment of claims,
refund, etc.). Taxpayers decide when to transfer money to their prepayment account. The
client has only one personal reference number for transferring taxes, fees and other
36 INFOÜHISKOND INFORMATION SOCIETY
38.
E-MAKSUAMET/E-TOLL E-TAX BOARD/ E-CUSTOMS
monetary obligations arising from tax related legislation to the prepayment account.
Monetary obligations are deducted from the account automatically as their due date arrives.
Monetary obligations of a client shall be performed in the order the obligations are created,
whereas pursuant to § 105 of the Taxation Act, which entered into force on 1 January 2009,
the claims with one and the same due date shall be fulfilled on the basis of the order set for
tax types.
Integration of customs e-services into e-tax/e-customs
In November 2002, the IT-departments of the Tax Board and the Customs Board were
joined, which prepared the ground for the development of web-based services and
subsequent integration of the customs e-services into e-tax/e-customs.
An important day in the development of e-services of the Estonian Tax and Customs Board
was 1 May 2006, when a web-based system for processing customs declarations called
Complex and related supporting accessory systems (application of permits, submission of
reports, keeping an eye on securities) were integrated into e-tax/e-customs, and the non-
web-based system for processing customs declarations called Asycuda, which had been in
use since 1999, was taken out of operation. New customs services have gradually been
added to e-tax/e-customs. Since 2011, the submission of customs declarations via the
Internet is mandatory to all customs clients within the European Union.
Joining pan-European information systems
Upon accession to the European Union (EU) on 1 May 2004, the Estonian Master Tariff
System (ETT) was integrated into the online customs tariff database (TARIC) that was
already being used by other Member States, and the Estonian transit information system
was integrated into the transit system used in the EU (ENCTS).
To adopt the pan-European electronic customs system, the Multi-Annual Strategic Plan of
the EU e-customs was implemented in 2005 as part of the development concept of e-
government. The concept is based on the Lisbon Strategy, which the EU Member States
approved as a ten-year reform plan in 2000, and which is aimed at turning the EU into the
world’s most competitive and dynamic knowledge-based economy.
In 2007, an electronic system was taken into use for processing data concerning transit
operations carried out under TIR Convention (E-TIR).
A part of the Multi-Annual Strategic Plan was implemented in 2009. On 1 July, the European
Import Control System (ICS), the Export Control System (ECS) and the New Computerised
Transit System (NCTS) were adopted in order to ensure protection for the society through
using risk-based control measures in the EU.
Take-up of most important e-tax/e-customs services in chronological order is presented
below.
Chronology of most 2000, beginning – possibility to submit natural person income tax returns over the Internet
important services 2000, end – package of web services for both natural and legal persons
2003–2007 – INF declarations
2003 – pre-filling of income tax return
2004 – excise duty returns, VIES-system to check VAT registration numbers within the EU
Member States, joining the EU customs tariff system TARIC and the transit system NCTS
2005 – start of development of pan-European e-customs, joining the portal X-road
2006 – customs declarations
2007 – web-based land tax data; creation of a new, modern environment for e-tax/e-
customs, processing of TIR operations data
2009 – adoption of a new calculation system, the pan-European Import Control System
(ICS), the Export Control System (ECS) and the New Computerized Transit System (NCTS),
thereby NCTS replaced the systems ENCTS and E-TIR.
INFOÜHISKOND INFORMATION SOCIETY 37
39.
E-MAKSUAMET/E-TOLL E-TAX BOARD/ E-CUSTOMS
2010 – introduction of the internal Excise Movement and Control System JVIS, the pan-
European Excise Movement and Control System EMCS, and the sales tax return for
enterprises operating in Tallinn.
Benefits of e-tax/ E-tax/e-customs is a convenient and time-saving environment that enables to settle one’s
e-customs tax matters regardless of the time and place. Documents can be submitted without actually
coming to the ETCB office and necessary information can be accessed without contacting
an official.
Interbase cross-usage of data by state authorities means that the data already held by the
state shall not be submitted again, for the state authorities obtain necessary data from a
database managed by the ETCB.
E-tax/e-customs helps to save money spent on printing and posting of tax returns and tax
notices, money spent on entering declarations, processing incorrect returns as well as on
the human resources engaged in sending respective notices. In 2010, over 513,000 income
tax returns (92.4% of income tax returns) were submitted electronically. Considering that
entering one declaration in the database takes approximately four minutes (i.e. 15
declarations per hour), we have saved 34,200 working hours only with that operation. Over
1.6 million kroons were spent on printing declarations in 2000 and 173,000 kroons in 2009.
Automation of data processing and interbase cross-usage of data enables to observe tax
collection in real time, point out potential tax risks, and, owing to the control rules
programmed in the information systems, reduce human error.
E-tax/e-customs has laid foundations for interbase cross-usage of data. In 2001, the system
also started to benefit the Social Insurance Board, Central Criminal Police, Public
Procurement Office, Health Insurance Fund and the bailiffs, and the ETCB developed e-
service packages for interbase cross-usage of data considering particular needs of particular
authorities.
In 2005, the ETCB joined the portal X-road (data exchange layer of information systems),
which provides state authorities with safe information exchange. Inquiries by the state
authorities, who pursuant to the Taxation Act have the right to make inquiries in the register
of taxable persons, now go through X-road. The interbase cross-usage of data by state
authorities ensures quick, timely and safe information exchange, cutting the costs spent on
human resources, posting services and paper.
Development of e-services of the Estonian Tax and Customs
Board
E-services provided by the Estonian Tax and Customs Board are constantly being improved,
taking into account user proposals, for the clients’ needs are constantly changing. Today,
people conduct an average of over 95% of their operations by electronic means, meaning
that they have adjusted well to the changes and are expectant of the development of
comfort services. In 2010, the ETCB started to analyse a possibility to offer business clients
the chance to enter into an e-services contract, authorise e-service users or apply for
respective user rights through e-tax/e-customs. Presumably, the system providing such
authorisations/ user rights will be completed by the end of 2011, giving business clients the
opportunity to enter into e-services contracts electronically and provide their employees with
(or deprive them of) user rights in a safe manner in the environment of e-tax/e-customs
without having to contact the officials. Successful execution of the project will further
facilitate access to e-services.
Moreover, continuous development of electronic services is also conditioned by
amendments to legislation.
The project of e-tax/e-customs prepared the ground for the development of information
society in the public sector at a level which would best suit the needs of users and would
keep up with the development of information technology.
In cooperation with banks and, as much as needed, with the private sector, a system was
established, which was aimed at making the servicing of citizens and companies and data
exchange management system more efficient. E-tax/e-customs is not a limited or isolated
38 INFOÜHISKOND INFORMATION SOCIETY
40.
E-MAKSUAMET/E-TOLL E-TAX BOARD/ E-CUSTOMS
information system, but a flexible solution, which can be developed further to meet the
needs of users and integrated it into other systems. Thus, e-tax/e-customs contributes
considerably to tax administration as well as making the work of the whole public sector
more efficient.
Private client services in e-tax/e-customs
Most popular services Among private clients the most popular services concern submission, viewing and printing of
natural person income tax returns.
A large number of clients also use the land tax service, which enables to view and print land
tax notices or view the registered immovable possessed by the client, taxation information
and the amount of land tax payable, dispense with land tax notices on paper and order
information about the preparation of land tax notices to one’s email.
Important and informative services for private persons can be found in the section “Data
from employers”, enabling to keep an eye on whether employers have declared payments
made to private persons in a correct manner, and paid taxes and other fees withheld from
payments. Natural persons can view payments received from employers and income tax
withheld by months, and data on social tax calculated and paid by the employer, social tax
transferred to the Social Insurance Board, and differences in the data calculated and paid by
the employer. Furthermore, data on mandatory funded pension declared and paid by the
employer and transferred from the ETCB to the Estonian Central Register of Securities
(ECRS) as well as the social tax paid and transferred to the ECRS can also be viewed there.
In the section “Claims and liabilities”, private clients can view balances of claims and their
prepayment account balance and performed operations. The prepayment account balance
can be used for the payment of claims and refund, or transfer of overpaid amounts to one’s
bank account can be applied for.
The forest information section is intended for the publication of notices about cutting rights
as well as timber purchase and sale transactions and it concerns forest owners selling the
forest as well as those who buy roundwood for heating or other purposes in the quantities
over 20 cubic metres per year.
The section for heavy goods vehicle tax allows viewing data on heavy goods vehicles
registered on the person’s name in the Estonian Motor Vehicle Registration Centre and the
heavy goods vehicle tax paid on them.
Declarations of private clients include declarations of income and social tax as well as
unemployment insurance premiums and contributions to mandatory funded pension (TSD),
which are submitted by a natural person if he/she is employer for another natural person
(e.g. child minders). Electricity and fuel excise duty declarations are submitted if natural
persons use self-produced electricity in their household or if they purchase electricity via a
power line that is not connected with network operator.
Furthermore, private persons can fill out traveller’s declaration in the customs declarations’
processing system Complex, and in the event of purchasing excise goods, confirm the
transaction in the internal excise movement and control system JVIS.
Under “Settings” one can change the password, read the e-services contract entered into,
and under “Shortcuts” one can bring most frequently used services to the front page and
change contact data. Under “Messages to Tax and Customs Board”, one can securely send
letters and questions, which shall be deemed to be signed by hand.
Business client services in e-tax/e-customs
Declarations In e-tax/e-customs, clients can submit the following declarations: value added tax returns,
intra-Community supply statements (form VD), amendments to intra-Community supply
statements (form VDP) and current intra-Community supply statements (form VDA),
enterprise's declarations of income and social tax (form TSD), unemployment insurance
premiums and contributions to mandatory funded pension, INF–declarations, excise duty
returns (alcohol excise, single alcohol excise, fuel excise duty, single fuel excise duty) and
sales tax return for enterprises operating in Tallinn. (Figure 1)
INFOÜHISKOND INFORMATION SOCIETY 39
41.
E-MAKSUAMET/E-TOLL E-TAX BOARD/ E-CUSTOMS
Tax calculation The following services can be found under ”Claims and liabilities“: viewing of balances of
services claims, claims and related operations inquiry within a selected period, viewing of
prepayment account balance, prepayment account operations inquiry (e.g. transfers of
money within a selected period); applications for the refund or transfer of overpaid amounts
and a chance to observe the status and history of applications; inquiries concerning
statements of balance; land tax data and a chance to dispense with land tax notices on
paper and order information on land tax notice to one’s email address.
Comfort services Under “Settings” one can view contracts entered into, amend one’s contact data and
password, if necessary, whereas shortcuts enable to create direct links onto the first page to
selected services, change the names of the principals so that they are displayed in the drop-
down menu in an alphabetic order (a suitable service for companies providing accounting
services).
Under “Messages to Tax and Customs Board” one can send messages to the ETCB and
read received/sent messages. In this section, the messages/emails sent in e-tax/e-customs
are deemed to be signed by hand.
Customs services The following customs services are available in e-tax/-e-customs.
Complex – customs declarations and traveller’s declarations submission system for persons
who export goods outside the EU and/or import goods from outside the EU. The system is
also designed for submitting stock notices.
Estonian Master Tariff System (ETT) – inquiry for persons, who trade with countries outside
the EU. ETT enables to make web-based inquiries about CN codes used in the import or
export of goods, measures and exchange rates applied, and calculate import duties.
ECS2 (Export Control System) – this export control system enables to submit summary
declarations upon exporting goods outside the EU, if the submission of customs declaration
is not mandatory.
ECS2BRD (Export Control System Border) – this export control system on border enables to
submit notices about the arrival of exported goods at the customs office of exit (in the case
of maritime and air transport).
OMF (Outward Manifest) – the outward manifest processing system is meant for submitting
cargo manifests of ships/aircrafts and exit reports.
ICS (Import Control System) – this import control system enables to submit entry summary
declarations, lists of goods and goods manifests.
NCTS (New Computerized Transit System) – this new transit system with added functions to
implement safety and security measures replaced on 1 December 2003 the earlier system
ENCTS (Estonian New Transit System), which had previously been used for the electronic
submission of declarations for transit, and as of 1 July 2007, it also replaces the TIR-system
that was previously used for the electronic submission of TIR transport.
EORI (Economic Operators Registration and Identification System) – economic operators
registration and identification system used in the EU countries, the registered numbers of
which shall be used in the import, transit, export and/or other customs operations starting
from 1 July 2009.
Information systems of JVIS – the customs supervision information system for internal excise goods that enables to
excise goods submit advance notices, notices and applications.
supervision
EMCS (Excise Movement and Control System) – the EU excise goods movement and
control system for sending and receiving goods in the event of temporary exemption from
excise duty. The system enables to submit accompanying documents eSL, change the
destination and sending time, and formalise receipt notices.
40 INFOÜHISKOND INFORMATION SOCIETY
42.
E-ÄRIREGISTRI ETTEVÕTJAPORTAAL E-COMMERCIALREGISTER COMPANY REGISTRATION PORTAL
E-ÄRIREGISTRI ETTEVÕTJAPORTAAL KUI TÕHUS
BÜROKRAATIAVÄHENDAJA
Vesta Laansoo
Registrite ja Infosüsteemide Keskus
E-äriregistri ettevõtjaportaal on Registrite ja Infosüsteemide Keskuse (RIK) loodud portaal,
mille kaudu ettevõtjad saavad suhelda maakohtute registriosakondadega ilma notari abita
või registriosakonnas kohapeal käimata. RIK on Justiitsministeeriumi haldusala asutus, mille
eesmärk on luua integreeritud e-teenuseid pakkuv innovaatiline keskkond riigi haldus-,
õigus- ja kriminaalpoliitika efektiivsemaks toimimiseks.
RIK haldab ja arendab mitut riigile ja kodanikule olulist registrit ning infosüsteemi. Nende
hulgas on nii e-äriregister, e-notar ja e-kinnistusraamat kui ka mitu õigusinfosüsteemi
(kohtuinfosüsteem, enne tähtaega vanglast vabanenute elektrooniline järelevalve,
kriminaalhooldusregister, riiklik kriminaalmenetlusregister, kinnipeetavate register,
e-toimik jt). RIK teeb koostööd ka teiste riikide IT asutuste ja -struktuuridega ning Euroopa
Liidu sisene koostöö laieneb pidevalt. RIK-i spetsialistide välja töötatud lahendused ja
arendused on äratanud huvi paljudes riikides nii Euroopas kui ka mujal.
E-äriregistri E-äriregistri ettevõtjaportaalile on avaldatud rahvusvahelist tunnustust ja portaali nimel on
ettevõtjaportaal isegi maailmarekord. Rekord püstitati 2009. aastal InnoEstonia konverentsil, kus kontrollitud
tingimustes loodi uus äriühing 18 minuti ja 3 sekundiga. Teadaolevalt on see kõige kiiremini
loodud osaühing maailmas. Ettevõtjaportaali saavad peale Eesti kodanike kasutada ka
paljude teiste riikide elanikud. Praegu on e-äriregistri ettevõtjaportaali võimalik sisse logida
Soome, Belgia ja Portugali ID-kaardiga, Leedu mobiil-ID abil ning RIK loodab, et peatselt
lisandub neile veelgi uusi riike. See võimalus on laiendanud e-äriregistri ettevõtjaportaali
potentsiaalsete kasutajate arvu 20 miljoni kasutajani. Juba praegu on märgata välismaiste
ettevõtjate huvi e-äriregistri ettevõtjaportaali vastu, kuivõrd eespool mainitud riikide ID-dega
on portaali sisenetud peaaegu 900 korral.
Peale selle, et e-äriregistri ettevõtjaportaal on rahvusvaheline ja lihtsustab oluliselt
ettevõtjaks saamist Eestis, on portaal märgatavalt vähendanud bürokraatiat kohalikul
tasandil ehk kohtu registriosakondades. Kui 2007. aastal esitasid ettevõtet alustada soovijad
elektrooniliselt vaid 23% kõikidest esmakandeavaldustest, siis 2010. aasta esimesel poolel
juba 79% (vt tabel nr 1).
Tabel 1 Ettevõtte esmakandeavalduste laekumine, 2007–2010ª
Table 1 Receipt of initial entry petitions from companies, 2007–2010ª
2007 2008 2009 2010 (I pa)
(1st half-year
of 2010 )
Arv % Arv % Arv % Arv %
Number Number Number Number
Paberil ja 12 500 77 9 420 67 12 005 35 2 142 21 On paper and via
e-notarib kaudu the E-Notaryb
Ettevõtjaportaali 3 746 23 4 687 33 22 377 65 8 228 79 Via the Company
kaudu Registration Portal
KOKKU 16 246 100 14 107 100 34 382 100 10 370 100 TOTAL
ª 2010. aasta andmed on aasta esimese poole kohta.
b
E-notar on keskkond, mis aitab notareid nende töös, võimaldades teha usaldusväärseid päringuid riiklikest
registritest, koostada lepinguid, registreerida ametitoiminguid ja edastada kandeid riiklikesse registritesse.
ª The 2010 data refer to the first half of the year.
b
E-Notary is an environment that helps notaries in their work, allowing them to make reliable inquiries from national
registers, prepare contracts, register procedures and forward entries to national registers.
Allikas: äriregistri keskandmebaas
Source: Central Commercial Register
Juhul kui muudatust ei pea vormistama notar, saab e-äriregistri ettevõtjaportaali kaudu
esitada ka avaldusi registriandmete muutmiseks. Muutmiskandeavalduste statistika näitab
esmakandeavaldustega sarnast trendi – üha enam eelistatakse avaldusi esitada
ettevõtjaportaali kaudu (vt tabel nr 2).
INFOÜHISKOND INFORMATION SOCIETY 41
43.
E-ÄRIREGISTRI ETTEVÕTJAPORTAAL E-COMMERCIALREGISTER COMPANY REGISTRATION PORTAL
Tabel 2 Muutmiskandeavaldused, 2007–2010ª
Table 2 Amendment entry petitions, 2007–2010ª
2007 2008 2009 2010 (I pa)
(1st half-year
of 2010 )
Arv % Arv % Arv % Arv %
Number Number Number Number
Paberil ja e-notari 64 978 93 66 699 89 76 330 79 32 692 76 On paper and via
kaudu the E-Notary
Ettevõtjaportaali 5 219 7 8 216 11 20 379 21 10 601 24 Via the Company
kaudu Registration Portal
KOKKU 70 197 100 74 915 100 96 709 100 43 293 100 TOTAL
ª 2010. aasta andmed on aasta esimese poole kohta.
ª The 2010 data refer to the first half of the year.
Allikas: äriregistri keskandmebaas
Source: Central Commercial Register
Majandusaasta RIK on e-äriregistri ettevõtjaportaali aastate jooksul pidevalt täiendanud ning teinud palju
aruannete olulisi ja vajalikke uuendusi. 2010. aasta alguses rakendus portaalis suur uuendus, mis
elektrooniline puudutas ka majandusaasta aruannete elektroonilist esitamist.
esitamine
2009. aastal sai valitsuse tasemel alguse aruandluskorralduse lihtsustamise projekt, mille
eesmärk on vähendada dubleerivat aruandlust ja andmete küsimist. Selleks et kasutajad
saaksid neile vajalikud andmed dubleeriva küsitluseta, on vaja, et aruandluskohustuslaselt
küsitud andmed oleksid kvaliteetsed, omavahel võrreldavad ja kiirelt kättesaadavad.
Elektroonilise aruandluse aluseks on riigi tasandil kokku lepitud taksonoomia. See koosneb
elementide loendist ning sinna juurde kuuluvatest reeglitest ja standarditest, mis
võimaldavad kasutajatel elementide sisu ühtemoodi mõista ning neid infosüsteemides
loetavaks ja töödeldavaks muuta.
Juba alates 2001. aastast on võimalik majandusaasta aruandeid esitada elektrooniliselt
PDF-vormingus. Seda võimalust on aasta-aastalt hakanud kasutama üha rohkem ettevõtjaid
(vt joonis nr 1), kuid PDF-vorming ei võimalda andmeid kohe töödelda.
Joonis 1 Elektrooniliselt esitatud majandusaasta aruanded, 2001–2010
Figure 1 Electronically submitted annual reports, 2001–2010
90 000
Aruandeid kokku
80 000 Reports total
70 000 Elektrooniliselt esitatud
Submitted electronically
60 000
50 000
40 000
30 000
20 000
10 000
0
2001 2002 2003 2004 2005 2006 2007 2008 2009 2010
Allikas/Source: RIK
Alates 2010. aastast on ettevõtjaportaalis kasutuseks avatud RIK-is arendatud e-aruandluse
süsteem, mis kasutab standardit XBRL (eXtensible Business Reporting Language). XBRL
on arvutikeel, mis võimaldab ettevõtjal ja riigil vahetada finants- ja aruandlusandmeid
kiiremini ja tõhusamalt ning seejärel andmeid kiiremini töödelda ja analüüsida, sest andmed
on masinloetavad esitamise hetkest alates. Tegemist on andmevahetusstandardi XBRL
esmakordse laiema kasutuselevõtu projektiga Eestis.
Elektroonilise aruandluse projekt on saanud teoks tänu Euroopa Liidu struktuurifondide
toetusele.
E-aruandluse eelised Üks e-aruandluse olulisi eeliseid on esitatud andmete parem võrreldavus ja andmete põhjal
tehtavate majandusanalüüside suurem täpsus. Erinevalt varasemast on andmed kiiremini
42 INFOÜHISKOND INFORMATION SOCIETY
44.
E-ÄRIREGISTRI ETTEVÕTJAPORTAAL E-COMMERCIALREGISTER COMPANY REGISTRATION PORTAL
kättesaadavad, sest edastatavad andmed on kohe elektrooniliselt töödeldavad. Ära jääb
aeganõudev andmete elektroonilisele kujule viimine, sest aruannete sisulist kontrolli saab
automatiseerida ja tänu sellele väheneb riigi tööjõukulu. Ettevõtjad on e-aruandluse hästi
omaks võtnud – suur osa neist eelistas 2010. aastal aruande esitada ettevõtjaportaali kaudu
XBRL-vormingus. Vaid vähesed ettevõtjad pöördusid aruande esitamiseks notari poole
(vt tabel nr 3). PDF-vormingus said aruande esitada need, kes mingil põhjusel ei saanud
seda teha olemasolevaid vorme täites (nt majandusaasta algas enne 01.01.2009; aruannet
esitati rahvusvahelise standardi järgi vms). 2010. aastal esitati 2009. aasta majandusaasta
aruannetest elektrooniliselt 98,89%.
Tabel 3 2009. aasta majandusaasta aruannete esitamine, 2010ª
Table 3 Submission of 2009 annual reports, 2010ª
Äriühingud MTÜ-d KOKKU
Companies Non-profit TOTAL
associations
Portaali kaudu 63 197 16 043 79 240 Via the portal in XBRL
XBRL-vormingus format
Portaali kaudu PDF- 4 743 191 4 934 Via the portal in PDF
vormingus format
Kõik portaali kaudu 67 940 16 234 84 174 All reports submitted
esitatud aruanded via the portal
Notari kaudu 675 266 941 Via a Notary Public
Esitatud aruandeid 68 615 16 500 85 115 Total number of
kokku submitted reports
Elektrooniliselt 99,0 98,4 98,9 Submitted
esitatud, % electronically, %
a
Seisuga 28. juuli 2010.
a
As of 28 July 2010.
Allikas/Source: RIK
Ühtne aruandlusvorm ja -keskkond teeb esitajale andmete sisestuse ja edastuse
mugavamaks, sest kõikide nõutud andmete esitamiseks on olemas üks kindel koht ja viis.
Aruande esitaja ei pea enam oma aruande vormi ise kujundama. Täites olemasolevad
vormid ettevõtjaportaalis või võttes andmed otse raamatupidamisprogrammist, luuakse
automaatselt aruanne, mida on võimalik digitaalselt allkirjastada ja esitada ning soovi korral
ka printida. Aruanded on kõigile elektrooniliselt kättesaadavad e-äriregistris aadressil
https://ariregister.rik.ee.
Positiivne on, et kasutada saab kõiki kord juba riigile esitatud andmeid ja ettenähtud õiguste
kohaselt võivad neid andmeid tööülesannete täitmisel kasutada kõik huvirühmad (erasektor,
ametkonnad). See aitab vältida olukorda, kus andmeid küsivad eri asutused, mistõttu
ühtesid ja samu andmeid tuleb esitada mitu korda. Samuti võimaldab selline andmete
esitamise lahendus luua automaatkontrollide süsteemi, mis annab esitajale juba andmete
sisestamise ajal märku võimalikest vigadest ja aitab seega tõsta andmete kvaliteeti. Lisaks
aitab see eelduste kohaselt vähendada nende arvukate hoiatuste hulka, mida
aruandekohustuslased igal aastal aruannete puuduste eest saavad. 2009. aastal väljastati
8010 teadet või määrust majandusaasta aruannete puuduste kohta (tabel nr 4).
INFOÜHISKOND INFORMATION SOCIETY 43
45.
E-ÄRIREGISTRI ETTEVÕTJAPORTAAL E-COMMERCIALREGISTER COMPANY REGISTRATION PORTAL
Tabel 4 Ettevõtjatele väljastatud hoiatus- ja trahvimäärused, 2009
Table 4 Warnings and rulings which impose a fine issued to companies, 2009
Väljastatud teate liik Ettevõtjate arv Type of notice issued
Number of companies
Meeldetuletus: majandusaasta 2 265 Reminder: annual report not
aruanne esitamata submitted
Teade majandusaasta aruande 4 258 Notice regarding omissions in
puuduste kohta annual report
Trahvihoiatusmäärus: 3 752 Warning regarding ruling
majandusaasta aruanne imposing a fine: regarding
puudulik omissions in annual report
Trahvihoiatusmäärus: 506 Warning regarding ruling
majandusaasta aruanne imposing a fine: annual report not
esitamata submitted
Hoiatusmäärus registrist 992 Warning regarding deletion from
kustutamiseks: majandusaasta the register: annual report not
aruanne esitamata submitted
Trahvimäärus 11 838 Warning regarding ruling
imposing a fine
Allikas/Source: RIK
Esimene XBRL-rakenduse aasta on näidanud, et aruannete elektrooniline esitamine XBRL-i
vahendusel toimib hästi ja on ka ettevõtjatelt saanud positiivset tagasisidet kui aega säästev
lahendus. Kõigil, kes on esitanud 2010. aastal aruande XBRL-vormingus, on järgmisel
aastal 2009. aasta andmed portaalis juba olemas ja ettevõtjad ei pea kulutama aega
aruande vormistamisele, sest selle teeb nende eest ära portaal.
Ettevõtjaportaali e-aruandluskeskkonna kasutajatele tehti 2010. aastal ka küsitlus, kus
vastajad said aruandluskeskkonna ja selles kasutatavate vormide kohta anda nii üldist kui
ka detailsemat tagasisidet. Küsitlusest saadud infot kasutatakse lisafunktsioonide loomisel,
et teha e-aruandluskeskkond ettevõtjatele ja raamatupidajatele veelgi mugavamaks.
44 INFOÜHISKOND INFORMATION SOCIETY
46.
E-ÄRIREGISTRI ETTEVÕTJAPORTAAL E-COMMERCIALREGISTER COMPANY REGISTRATION PORTAL
THE E-COMMERCIAL REGISTER
COMPANY REGISTRATION PORTAL
AS AN EFFICIENT MINIMIZER OF BUREAUCRACY
Vesta Laansoo
Centre of Registers and Information Systems
The E-Commercial Register Company Registration Portal is a portal created by the Centre
of Registers and Information Systems (RIK), through which entrepreneurs can communicate
with the registration departments of county courts without the aid of a Notary Public and
without visiting the registration department. RIK is a state agency working under the Ministry
of Justice. RIK’s main goal is to provide an innovative and integrated environment of
e-services for a more efficient implementation of governmental administration, law and
criminal policy.
RIK administers and develops several registers and information systems important to both
the state and citizens. These include the E-Commercial Register, E-Notary and E-Land
Register as well as other legal information systems (court information system, electronic
monitoring of prisoners released on parole, Probation Supervision Register, State Register
of Criminal Matters, Prisoner Register, E-file, etc.). RIK cooperates with the IT institutions
and agencies of other states, and internal cooperation within the European Union is
continually expanding. The solutions and developments created by RIK’s specialists have
attracted interest in a lot of states in Europe as well as elsewhere.
E-Commercial Register The E-Commercial Register Company Registration Portal has been recognised
Company Registration internationally and the Portal even holds a world record. The record was set in 2009, when
Portal at the InnoEstonia conference, under controlled conditions, a new company was established
in 18 minutes 3 seconds. This is believed to be the fastest time in which a private limited
company has been established in the world. In addition to Estonian citizens, the Company
Registration Portal can also be used by the citizens of many other states. It is currently
possible to log into the E-Commercial Register Company Registration Portal using Finnish,
Belgian and Portuguese ID cards and Lithuanian mobile-ID, and RIK is hoping that new
countries will be added soon. This possibility has expanded the potential number of users of
the E-Commercial Register Company Registration Portal to 20 million. The interest of
foreign entrepreneurs in the E-Commercial Register Company Registration Portal is already
apparent, as ID cards from the above mentioned states have been used on nearly
900 occasions for accessing the Portal.
Besides the fact that the E-Commercial Register Company Registration Portal is
international and significantly simplifies the process of becoming an entrepreneur in Estonia,
the Portal has significantly reduced bureaucracy on the local level i.e. in court registry
departments. If in 2007 only 23% of those wishing to start a company submitted initial entry
petitions electronically, then in the first half of 2010 the percentage was already 79% (Table
1).
In case an amendment does not have to be formalised by a Notary Public, the
E-Commercial Register Company Registration Portal can also be used to submit petitions
for amending the registry data. Statistics on amendment entry petitions show a similar trend
with initial entry petitions – there is an increasing preference to submit petitions via the
Company Registration Portal (Table 2).
Electronic submission RIK has continuously supplemented the E-Commercial Register Company Registration
of annual reports Portal over the years and has made a lot of significant and necessary updates. At the
beginning of 2010 a major update was implemented in the Portal which also concerned the
electronic submission of annual reports.
In 2009, at the level of the government, a reporting organisation simplification project was
launched, the goal of which is to reduce requests for duplicate reports and data. In order to
enable users to receive required data without duplicate inquiry, it is necessary that the data
requested from the party subject to reporting requirements be of high quality, comparable
and quickly accessible. The basis for electronic reporting is taxonomy agreed upon at the
state level. This is comprised of a list of elements and the accompanying regulations and
INFOÜHISKOND INFORMATION SOCIETY 45
47.
E-ÄRIREGISTRI ETTEVÕTJAPORTAAL E-COMMERCIALREGISTER COMPANY REGISTRATION PORTAL
standards, which allow users to understand the contents of elements in the same manner
and permit them to be read and processed within information systems.
Since 2001, it has been possible to submit annual reports electronically, in PDF format.
Each year, an increasing number of companies have begun to use this possibility (see
Figure 1), although the PDF format does not permit data to be processed immediately.
(Figure 1)
Starting from 2010, the RIK-developed E-Reporting system which uses the standard XBRL
(eXtensible Business Reporting Language) is open for use in the Company Registration
Portal. XBRL is a computer language, which allows the company and the state to exchange
financial and reporting data faster and more efficiently and thereafter process and analyse
data faster, since data are machine readable from the moment they are submitted. This is
the first project involving a wider entry into service of the data exchange standard XBRL in
Estonia.
The E-Reporting project was implemented due to a support from the European Union
structural funds.
Advantages of A significant advantage offered by E-Reporting is a better comparability of submitted data
e-reporting and an increased precision of economic analyses performed on the basis of data. As
opposed to the past, data can now be accessed more quickly, since the forwarded data can
be immediately processed electronically. The time consuming process of converting data
into a computer-readable form is no longer necessary, since the process of checking the
subject matter of reports can be automated and due to that the state’s labour costs
decrease. Companies have been quick in adopting E-Reporting – a large proportion of them
preferred to submit their annual report via the Company Registration Portal in XBRL format
in 2010. Only few companies turned to a Notary Public for submitting their report (see Table
3). Those who were unable, for some reason, to complete the existing forms (e.g. their
financial year began before 01.01.2009; the report was submitted according to the
international standard, etc.) could submit the report in PDF format. In 2010, 98.89% of
annual reports for 2009 were submitted electronically. (Table 3)
A common reporting form and reporting environment makes the submitting and forwarding
of data more comfortable for the submitter, since there is a single and definite location and
method available for submitting any required data. The submitters of reports no longer have
to prepare the format of the report themselves. By completing the existing forms in the
Company Registration Portal or taking the data directly from an accounting programme, the
report is created automatically, which can then be digitally signed and submitted and printed
if wished. Reports are electronically available to everyone in the E-Commercial Register at
the address https://ariregister.rik.ee.
A positive note is that all data that have been submitted to the state once can be used, and
in accordance with prescribed rights the data may be used by all interested parties (private
sector, agencies) in performing their work assignments. This helps to prevent a situation
where data are requested by different agencies, as a result of which the same data must be
submitted several times. This solution regarding data submission also allows for the creation
of an automatic control system, which provides the submitter with a notice about possible
errors at the time of entering the data and thereby helps to enhance the quality of data. In
addition, this helps to reduce a large number of warnings which persons required to submit
reports receive each year due to omissions in their reports. In 2009, as many as
8,010 notices or rulings were issued regarding omissions in annual reports. (Table 4)
The first year featuring the XBRL application has shown that the electronic submission of
reports via XBRL takes place smoothly and it has also received positive feedback from
companies as a time saving solution. For all those who submitted a report in XBRL format in
2010, the data for 2009 will already be available in the Portal next year and companies do
not have to spend time on preparing the report, since the Portal does this for them.
Furthermore, in 2010, a survey was conducted among the users of the Company
Registration Portal's E-Reporting Environment, where the respondents were able to provide
general as well as detailed feedback on the reporting environment and about the forms used
therein. The information obtained from the survey will be used in creating additional
functions, in order to make the E-Reporting Environment even more comfortable for
companies and accountants.
46 INFOÜHISKOND INFORMATION SOCIETY
48.
eSTAT – VEEBIPÕHINEANDMEESITUSKANAL eSTAT – WEB-BASED CHANNEL FOR DATA PROVISION
eSTAT – VEEBIPÕHINE ANDMEESITUSKANAL
Tuulikki Sillajõe
Statistikaamet
Statistikaameti ülesanne on pakkuda avalikkusele teavet Eesti keskkonna, rahvastiku,
sotsiaalsfääri ning majanduse seisundi ja trendide kohta. Et seda ülesannet täita, teeb
Statistikaamet statistikatöid, s.t kogub ja töötleb andmeid ning avaldab riiklikku statistikat
valitsuse kinnitatud ulatuses ja etteteatatud ajal, lähtudes rahvusvaheliselt tunnustatud
kvaliteedikriteeriumidest.
Riikliku statistika tegemiseks vajalikke andmeid on majandusüksustelt (äriühingud, riigi- ja
kohaliku omavalitsuse asutused, kasumitaotluseta organisatsioonid, füüsilisest isikust
ettevõtjad jt – edaspidi „majandusüksused”) läbi aegade kogutud peamiselt
paberaruannetega. Aastaid käis andmekogumine nii, et Statistikaamet saatis
aruandekohustuslastele posti teel paberaruandevormid, mille need pärast täitmist omakorda
postiga tagasi saatsid. Seejärel oli mõnda aega võimalik esitada samu aruandeid ka
Statistikaameti veebilehelt allalaaditavatel MS Exceli vormidel. 2006. aastal lisandus neile
kahele andmeesitusvõimalusele veel üks – internetipõhine statistiliste aruannete koostamise
ja edastamise kanal eSTAT (vt http://www.stat.ee).
2010. aasta lõpu seisuga laekub eSTATi kaudu üle 70% majandusüksuste aruannetest.
Selle tulemuseni jõudmisest annab ülevaate allpool olev joonis.
Joonis 1 Majandusüksuste aruannete esitamise viisid, jaanuar 2008 – november 2010
Figure 1 Channels for submission of reports by economic entities, January 2008 – November 2010
%
100 Paber
Paper
80
Excel
60 eStat
40
20
0
I II III IV I II III IV I II III IV
2008 2009 2010
eSTATi kasutajad
Eeskätt on eSTAT Statistikaameti aruandekohustuslaste töövahend. Andmeesitajate
a
koormuse minimeerimiseks kasutatakse riiklikus statistikas valikvaatlusi , seega ei pea
Statistikaametile igal aastal andmeid esitama kõik majandusüksused. Vajadus ja võimalus
kasutada andmeesituseks eSTATi on ainult nendel majandusüksustel, keda Statistikaamet
on aruandekohustusest teavitanud.
Kuigi andmeedastaja on majandusüksus, peab eSTATi siseneja olema eraisik. Üks isik
(kontaktisik, nt raamatupidamisfirmas töötav raamatupidaja) võib esitada mitme
majandusüksuse aruandeid ning ühe majandusüksuse aruandeid võib esitada ka mitu isikut
(nt raamatupidaja, personalitöötaja ja firma juht koostavad erinevaid aruandeid). Kes
konkreetselt majandusüksuse nimel aruandeid esitada ja muuta saab, selle määrab
majandusüksuse ametlik esindaja. Et majandusüksuse kontaktisikud saaksid eSTATi kaudu
andmeid esitada, loob Statistikaamet majandusüksusele peakasutaja, kes saab omakorda
a
Valikvaatlus tähendab seda, et ettevõtted jagatakse teatavate tunnuste, nt suuruse ja tegevusala järgi rühmadesse ja
igas rühmas tehakse juhuslik valik (statistiline meetod). Andmeid kogutakse ainult juhuvalikusse sattunutelt. Iga aasta
kohta koostatakse selline nimekiri uuesti. Et enamik suuri ettevõtteid peab arvestama, et nad kuuluvad sellesse
nimekirja peaaegu alati, siis keskmisel või väikesel ettevõttel on tõenäosus mitu aastat järjest aruandekohustuslaste
hulka kuuluda väiksem.
INFOÜHISKOND INFORMATION SOCIETY 47
49.
eSTAT – VEEBIPÕHINEANDMEESITUSKANAL eSTAT – WEB-BASED CHANNEL FOR DATA PROVISION
õiguse luua kasutajaid. Seega võivad eSTATiga varem või hiljem kokku puutuda peaaegu
kõik majandusüksused ning nende esindajatena omakorda väga paljud isikud.
Kui eSTATi kasutuselevõtu alguses sai selle kaudu esitada 21 aruannet, siis nüüdseks saab
seal esitada kõiki majandusüksuste statistilisi aruandeid. Praegu on eSTATis üle 30 000
peakasutaja, kes on umbes kaks kolmandikku Statistikaametile aruandeid esitavatest
majandusüksustest.
Tabel 1 eSTATi kasutamise aktiivsus, 2006–2010ª
Table 1 Activeness in using eSTAT, 2006–2010ª
Aasta Aruandeid Peakasutajaid Esitatud aruandeid
(seisuga 31.12)
Year Number of reports Number of main users Number of
(as of 31.12) submitted reports
2006 21 3 500 23 400
2007 77 6 700 53 600
2008 127 13 200 100 600
2009 139 24 100 168 100
2010 150 30 000 160 900
a
2010. aasta andmed on seisuga 31.10.2010.
a
Data for 2010 as of 31 October.
eSTATi võimalused
Andmeesitajale pakub eSTAT mugavat aruandevormide täitmise ja andmete esitamise
võimalust. Eriti mahukate aruannete puhul saab need genereerida otse ettevõtte
raamatupidamissüsteemist ja edastada Statistikaametile eSTATi kaudu. Peale selle saab
majandusüksus eSTATis ülevaate kõigist statistilistest aruannetest, mis tal Statistikaametile
esitada tuleb. Andmeesitaja saab eSTATi kaudu esitatavad aruanded täita ja edastada
sidusrežiimis. eSTATi kaudu esitatavate aruannete puhul on muu hulgas võimalik kontrollida
aruannetes olevaid andmeid ja parandada aruandevormi täitmisel tekkinud vead.
Andmeesitajal on võimalik näha kõiki aruandeid, mis ta on varem eSTATis esitanud, ning
näha saab ka neid aruandeid, mis majandusüksus on esitanud paberil või Exceli vormingus
ja mis Statistikaamet on ise infosüsteemi kandnud.
Andmete edastamine eSTATis on turvaline, sest rakendatakse tänapäevaseid
infoturbemeetmeid. eSTATi saab siseneda üksnes ID-kaardiga või internetipanga
(hanza.net, U-Net, Sampo-pank) kaudu ning kasutaja arvuti ja eSTATi vaheline ühendus
krüpteeritakse.
Tänu eSTATile on vähenenud nende andmete maht, mida Statistikaameti töötajad peavad
käsitsi sisestama. Andmete töötlemine on muutunud kiiremaks ja statistika jõuab kiiremini
avalikkuse ette. Üks olulisemaid ja laiemaid eSTATist saadavaid kasusid on see, et tänu
esitatavate andmete kvaliteedi paranemisele suureneb ka nende põhjal tehtavate
analüüside usaldusväärsus.
eSTATi loomisega paralleelselt tehti muudatusi ka Statistikaameti klienditoe korralduses.
Pikka aega oli andmeesitajate teenindamine Statistikaametis ainult aruandepõhine –
statistilise aruande kohta tekkinud küsimuste korral oli võimalik pöörduda
valdkonnastatistiku poole. Nii tagati väga professionaalne teenindus ühe aruande piires.
Erialaasjatundjate abi on võimalik kasutada praegugi, kuid n-ö teisese klienditoena. Koos
eSTATiga rakendus keskne andmeesitaja klienditugi, mille kaudu lahendatakse enamik
tekkinud probleeme. Kõikide valdkondade (nt ehitus, kaubandus, palk jne) aruannete kohta
saab infot klienditoe telefoninumbril 625 9100 ja e-posti aadressil klienditugi@stat.ee. Nii on
klienditeenidus muutunud andmeesitajale mugavamaks ja Statistikaameti seisukohalt
ülevaatlikumaks ning valdkonnaspetsialistid võidavad aega oma põhiülesannete täitmiseks.
48 INFOÜHISKOND INFORMATION SOCIETY
50.
eSTAT – VEEBIPÕHINEANDMEESITUSKANAL eSTAT – WEB-BASED CHANNEL FOR DATA PROVISION
eSTATi tulevik
Peale nende võimaluste, mis eSTATis juba olemas, on kavas uuendused, et teha süsteem
andmeesitajale veelgi mugavamaks. Kavas on muuta eSTAT pelgast aruannete esitamise
kanalist ka riikliku statistika levitamise kanaliks, mis tutvustaks igale majandusüksusele just
selle tegevusala või suurusjärgu ettevõttele huvi pakkuvaid statistikatooteid.
Täiesti uus arengusuund on Statistikaametis veebipõhine andmekogumine füüsilistelt
isikutelt eSTATi kaudu. Seda võimalust pakuti 2010. aasta alguses olnud rahva ja
eluruumide loenduse prooviloendusel, mille puhul eelistas küsimustiku eSTATis täita 21%
valimis olnud inimestest, ning oktoobris–novembris toimunud põllumajandusloendusel.
Mõlemal juhul avati loenduse alguses eSTAT ja sülearvutiga küsitleja käis ainult nende
juures, kes polnud kindlaks kuupäevaks veebis küsimustikku täitnud. Sama meetodit plaanib
Statistikaamet pärast 2011. aasta rahva ja eluruumide loendust rakendada ka teistes isiku-
uuringutes.
Elektroonilise andmekogumise võimaluse arendamine on üks Statistikaameti strateegilisi
eesmärke praegusel strateegiaperioodil. Sellise eesmärgi seadmise vajadus tuleneb soovist
arendada partnerlust andmeesitajatega, pakkudes neile võimalikult ajakohast ja mugavat
andmeesitamisvõimalust. Interneti kasvav populaarsus annab põhjust uskuda, et eSTAT
jääb kasutusse pikemaks ajaks.
INFOÜHISKOND INFORMATION SOCIETY 49
51.
eSTAT – VEEBIPÕHINEANDMEESITUSKANAL eSTAT – WEB-BASED CHANNEL FOR DATA PROVISION
eSTAT – WEB-BASED CHANNEL FOR DATA
PROVISION
Tuulikki Sillajõe
Statistics Estonia
The task of Statistics Estonia is to notify the public of the environmental, demographic,
social and economic situation in Estonia and respective trends. To this end, Statistics
Estonia takes individual statistical actions, i.e. collects and processes data and publishes
official statistics to the extent and at a time approved by the Government in accordance with
internationally acknowledged quality criteria.
For the purpose of producing official statistics, data have for years been collected from
economic entities (enterprises, state and local government agencies, non-profit
organisations, sole proprietors, etc. – hereinafter referred to as ”economic entities”) using
mainly questionnaires on paper. Statistics Estonia used to address questionnaires by post to
reporting entities who sent completed questionnaires back to Statistics Estonia. During a
period that followed, economic entities enjoyed the possibility of submitting statistical reports
on forms in MS Excel format to be downloaded from Statistics Estonia’s web site. In 2006, in
addition to the above two variants, another channel for data provision was taken into use – a
web-based channel for compiling and transmitting statistical reports called eSTAT (see
http://www.stat.ee).
As at the end of 2010, over 70% of statistical reports by economic entities are submitted to
Statistics Estonia via eSTAT. Figure 1 displays the trend that has led us to such an
achievement. (Figure 1)
Users of eSTAT
eSTAT is, first and foremost, a tool designed for economic entities who are obliged to submit
official statistical reports to Statistics Estonia. Only a part of all economic entities are liable to
submit reports to Statistics Estonia because, with a view to reducing response burden,
a
sample surveys are used in official statistics. Therefore, only those economic entities have
the possibility of using eSTAT as a data provision channel that have been informed by
Statistics Estonia of their obligation to submit statistical reports.
Although a respondent is an economic entity, only a private person has the right to log on to
eSTAT. One person (a contact person, e.g. an accountant working with an accounting
company) can submit reports in the name of several respondents, and reports concerning
one respondent may be submitted by several persons (e.g. an accountant, personnel worker
and company manager complete different reports). An official representative of the
economic entity shall determine who specifically can submit and amend statistical reports on
behalf of the particular economic entity. In order to enable contact persons of an economic
entity to submit data via eSTAT, Statistics Estonia creates the so-called main user for the
economic entity. The main user, in turn, has the right to create users. Thus, almost all
economic entities may, sooner or later, have to deal with eSTAT, and in turn lots of persons,
as representatives of economic entities, may also have a possibility to deal with eSTAT.
Right upon the launch of eSTAT, it was possible to submit 21 different statistical reports via
eSTAT. Now it is possible to submit via that channel all statistical reports designed for
economic entities. The number of main users of eSTAT has reached over 30,000 accounting
for about two thirds of all economic entities submitting statistical reports to Statistics Estonia
(Table 1).
a
Sample survey means that in each economic activity within each enterprise size group data are collected only from
those enterprises that have fallen in the sample (so-called random sampling, a special statistical method). Such a list
of enterprises is drawn up for each year over again. While big enterprises mostly find themselves in the sample, then
medium-sized or small enterprises may be subject to submitting a statistical report to Statistics Estonia in a particular
year, but not necessarily for several years in succession.
50 INFOÜHISKOND INFORMATION SOCIETY
52.
eSTAT – VEEBIPÕHINEANDMEESITUSKANAL eSTAT – WEB-BASED CHANNEL FOR DATA PROVISION
Possibilities of eSTAT
Respondents can comfortably compile and submit statistical reports via eSTAT. In case of
extra voluminous statistical reports, a possibility will be added to generate the reports
directly from the enterprise’s accounting system and transmit them via eSTAT to Statistics
Estonia. Besides that, in eSTAT respondents can view a list of all statistical reports their
enterprise has to submit to Statistics Estonia, compile and transmit the reports online, check
and correct them immediately upon compiling, view the reports the enterprise has submitted
earlier either on paper or in Excel format or which Statistics Estonia itself has entered in the
information system.
eSTAT enables secure data transmission. Security is guaranteed by implementation of
modern means of IT security measures. One can log onto eSTAT either using an ID-card or
through Internet bank (hanza.net, U-net, Sampo bank) and the connection between a
computer and eSTAT is encrypted.
Due to eSTAT, the share of manual data entry has decreased at Statistics Estonia. As a
result, data processing has become faster and the processed statistical data are more
quickly made available to the public. A major and broader benefit of using eSTAT is that due
to a better quality of data subject to submission, analyses based on these data are also
more credible and reliable.
In parallel with launching eSTAT, also the customer support service was reorganised at
Statistics Estonia. For a long time, servicing of respondents at Statistics Estonia had been
report-based, i.e. for questions about each statistical report a respondent could contact a
specialist in a particular statistical domain. In this way, a highly professional servicing
concerning one particular report was guaranteed. Currently, it is also possible to use
specialists’ help, but only if needed, i.e. in the form of secondary client service. In connection
with the implementation of eSTAT, an integrated call centre, which is able to solve the bulk
of problems raised, was established. Today, respondents can call at +372 625 9100 and e-
mail to klienditugi@stat.ee for questions and information about all the reports to be
submitted by enterprises irrespective of the domain (e.g. construction, trade, wages and
salaries, etc.). So, customer service has become handier for respondents and more clearly
arranged from Statistics Estonia’s view. Besides, the statistical domain specialists have won
additional time for performing their main tasks.
Future of eSTAT
In addition to the available scope, further developments are planned for eSTAT to make the
system even more user-friendly for respondents. There are plans to develop eSTAT into an
official statistics dissemination channel as well, apart from the one meant for submission of
statistical reports. Each enterprise will have the possibility of viewing statistical products that
are of interest specifically to their economic activity or enterprise size group.
An entirely new direction of development for Statistics Estonia is web-based data collection
from natural persons via eSTAT. Such a possibility was made available for the pilot
Population and Housing Census at the beginning of 2010, when 21% of persons included in
sample preferred to answer Census questions via eSTAT; as well as during the Agricultural
Census conducted this November and December. In both cases, first a web-based
questionnaire was made available at the beginning of the Census, and traditional
interviewers with laptops later on visited only the persons who had not filled in the web-
based questionnaire by a certain date. The same method is planned to be applied also
during the actual 2011 Population and Housing Census and further on in other individual
surveys.
Development of electronic data collection constitutes one of the strategic goals for Statistics
Estonia in the current strategy period. Necessity for such a goal arose from the intention to
evolve partnership with data providers by supplying them with the most modern and suitable
service for data provision. A rapid spread and popularity of the Internet gives every reason
to believe that eSTAT will remain in use for long.
INFOÜHISKOND INFORMATION SOCIETY 51
53.
INFOTEHNOLOOGIA KASUTAMINE USEOF INFORMATION TECHNOLOGY
INFOTEHNOLOOGIA KASUTAMINE
Mari Soiela
Statistikaamet
Infotehnoloogia kasutamist vähemalt kümne töötajaga ettevõtetes uurib Statistikaamet
alates 2001. aastast. 2010. aastal osales uuringus 3100 ettevõtet. Infotehnoloogia
kasutamist 16–74-aastaste elanike hulgas ja leibkondades uurib Statistikaamet tööjõu-
uuringu lisana alates 2005. aastast ning 2010. aastal osales selles uuringus 4000 inimest.
Infotehnoloogia vaatluste aluseks olid Eurostati küsimustikud „Community Survey on ICT
usage in enterprises (e-commerce)” ja „Community Survey on ICT usage in households and
by individuals”, mille põhjal koostati küsimustikud „Infotehnoloogia ettevõttes” ja
„Infotehnoloogia leibkonnas”. Eesmärk oli saada üldinfot infotehnoloogiavahendite, interneti
kasutamise, e-kaubanduse ja mitmesuguste interneti- või arvutikasutusoskuste kohta.
Infotehnoloogia kasutamist uurivad statistikaorganisatsioonid samade küsimustike alusel
kõigis Euroopa Liidu (EL) riikides.
Internetiühenduse levik
Keegi ei kujuta tänapäevases Eestis enam ette, et ettevõte saaks tegutseda ilma arvuti ja
internetita. Arvutit kasutavate ja internetiühendusega ettevõtete osatähtsus on saavutanud
lae, sest kasvuruumi enam eriti ei ole. Arvutit ja internetti kasutavad peaaegu kõik vähemalt
kümne hõivatuga ettevõtted ja nii on see olnud juba viimased kolm aastat. Leidub veel
üksikuid ettevõtteid, kes saavad läbi arvutita. Enamasti kasutavad need ettevõtted
asjaajamiseks ja aruandluseks raamatupidamisfirmade teenuseid või tegeleb sellega
emafirma.
Tabel 1 Interneti püsiühendusega ettevõtted tegevusala jägi, 2006–2010
Table 1 Enterprises with fixed broadband connection to the Internet by economic activity, 2006–2010
(protsenti – percentages)
2006 2007 2008 2009 2010
Tegevusala Economic activity
Põllumajandus, metsamajandus ja 69,7 79,9 80,1 85,8 89,4 Agriculture, forestry
kalapüük and fishing
Mäetööstus 77,3 70,5 93,5 81,3 83,7 Mining and quarrying
Töötlev tööstus 74,0 75,7 86,9 85,9 87,5 Manufacturing
Elektrienergia, gaasi, auru ja 86,5 93,1 90,1 92,2 93,7 Electricity, gas, steam and air
konditsioneeritud õhuga varustamine conditioning supply
Veevarustus; kanalisatsioon; jäätme- 76,6 81,5 85,5 76,4 84,7 Water collection, treatment and
ja saastekäitlus supply
Ehitus 72,6 76,4 87,1 82,0 84,0 Construction
Hulgi- ja jaekaubandus; 76,8 80,9 89,5 87,9 89,1 Wholesale and retail trade; repair
mootorsõidukite ja mootorrataste of motor vehicles and motorcycles
remont
Veondus ja laondus 76,8 79,4 83,0 84,2 86,6 Transportation and storage
Majutus ja 67,4 71,7 83,3 84,0 82,2 Accommodation and
toitlustus food service activities
Info ja 90,1 89,3 98,1 95,0 92,9 Information and communication
side
Finants- ja 86,7 82,2 92,9 90,9 88,5 Financial and insurance activities
kindlustustegevus
Kinnisvarategevus 75,6 62,9 73,6 77,4 88,2 Real estate activities
Kutse-, teadus- ja 81,9 86,5 95,2 92,0 94,3 Professional, scientific
tehnikategevus and technical activity
Haldus- ja 70,0 75,1 86,4 92,1 84,8 Administrative and support service
abitegevused activities
Haridus 76,1 76,1 95,6 94,9 91,7 Education
Tervishoid ja sotsiaalhoolekanne 81,4 87,8 97,1 88,4 90,2 Human health and
social work activities
Kunst, meelelahutus 75,4 79,3 79,3 84,8 90,6 Arts, entertainment
ja vaba aeg and recreation
Muud teenindavad tegevused 50,0 54,1 88,2 82,9 98,8 Other service activities
KOKKU 75,0 78,1 87,6 86,1 87,8 TOTAL
52 INFOÜHISKOND INFORMATION SOCIETY
54.
INFOTEHNOLOOGIA KASUTAMINE USEOF INFORMATION TECHNOLOGY
Internetiühenduse puhul on oluline näitaja ka selle kiirus. Pakutavad kiirused suurenevad
pidevalt, võimaldades ka suurema mahuga info jagamist internetis. See omakorda nõuab
järjest suuremaid andmeedastuskiiruseid. Kitsasribaühenduse puhul luuakse interneti-
ühendus teenusepakkuja sissehelistamiskeskuse numbrile helistades. Kasutades
sissehelistamisteenust telefoniliini kaudu, on liin kinni, ISDN-ühenduse puhul aga saab
samal ajal ka helistada. Lairibaühendus (nt DSL Digital Subscriber Line’i tüüpi ühendused,
internetiühendus kaabelmodemi kaudu) on oluliselt kiirem kui kitsasribaühendus. Üht kaablit
mööda edastatakse samal ajal mitut signaali, näiteks mööda üht kaabel-TV koaksiaalkaablit
jõuab televiisorini sadu teleprogramme ja sama kaablit kasutatakse ka internetiühenduseks.
DSL-tehnoloogia (nt ADSL) puhul kasutatakse andmeedastuseks telefoniliine.
2010. aasta jaanuaris oli kümnest ettevõttest üheksal internetiühenduse liikidest
püsiühendus. Endiselt kasutasid ettevõtted enim DSL-püsiühendust. Aeglasemaid
internetiühenduse liike (sissehelistamine, ISDN, mobiilne ühendus) kasutati vähem ja koos
püsiühendusega. Suurenenud on mobiilse interneti kasutajate arv – 2009. aastal kasutas
seda kaks, 2010. aastal kolm ettevõtet kümnest. Mobiilsidevõrgud on arendanud 3G- ja
3,5G-tehnoloogial põhinevaid internetiühendusi, mis võimaldavad kasutada mobiilset
lairibaühendust peale mobiiltelefoni ka sülearvutil. Et mobiilse lairiba kasutamine ei ole
seotud ainult ühe kindla asukohaga, on paljudel juhtudel võimalik selle abil loobuda
fikseeritud lairibaühendusest, eriti väiksemates ettevõtetes.
a
Joonis 1 Interneti püsiühendusega ettevõtted Euroopa Liidus, jaanuar 2009
Figure 1 Enterprises with fixed broadband connection to the Internet in the European Union, January
a
2009
Soome — Finland
Malta — Malta
Hispaania — Spain
Prantsusmaa — France
Belgia — Belgium
Rootsi — Sweden
Saksamaa — Germany
Luksemburg — Luxembourg
Holland — Netherlands
Eesti — Estonia
Suurbritannia — United Kingdom
Sloveenia — Slovenia
Itaalia — Italy
Küpros — Cyprus
Portugal — Portugal
EL-27 — EU-27
Kreeka — Greece
Taani — Denmark
Slovakkia — Slovakia
Tšehhi — Czech Republic
Iirimaa — Ireland
Austria — Austria
Ungari — Hungary
Bulgaaria — Bulgaria
Läti — Latvia
Poola — Poland
Leedu — Lithuania
Rumeenia — Romania %
0 10 20 30 40 50 60 70 80 90 100
a
EMTAK 2008 tegevusalade C–N alla kuuluvad ettevõtted (v.a finants- ja kindlustustegevus ning veterinaaria), milles
on vähemalt kümme hõivatut.
a
Enterprises included in the economic activities of EMTAK 2008 (NACE Rev.2) from C to N (except financial and
insurance activities and veterinary activities) with at least ten persons employed.
Allikad: Statistikaamet, Eurostat
Sources: Statistics Estonia, Eurostat
Eurostati andmetel oli 2009. aastal EL-i riikide ettevõtetest internetiühendus 93%-l,
sealjuures 82%-l püsiühendus. Internetiühendusega ettevõtete osatähtsus oli suurim
Soomes (100%), Austrias, Slovakkias ja Taanis (kõigis kolmes 98%). Püsiühenduse
kasutajaid oli kõige rohkem Soomes (94%), Maltal, Hispaanias (mõlemas 93%) ja
Prantsusmaal (92%). Eurostati vaadeldavate tegevusalade puhul oli 2009. aasta jaanuaris
internetiühendus 95%-l ja püsiühendus 86%-l Eesti ettevõtetest.
INFOÜHISKOND INFORMATION SOCIETY 53
55.
INFOTEHNOLOOGIA KASUTAMINE USEOF INFORMATION TECHNOLOGY
Koduse internetiühendusega leibkondade osatähtsus suureneb pidevalt – 2009. aasta
a
I kvartalis oli kodus internetiühendus 63%-l leibkondadest , 2010. aasta I kvartalis 68%-l.
Linnalistes asulates on kodune internetiühendus levinum kui maa-asulates, kuid see vahe
jääb iga aastaga järjest väiksemaks. Kodune internetiühendus on rohkem levinud lastega
leibkondades. Üksi elavatest täiskasvanutest said kodus internetiühenduseta hakkama üle
poole. Lastega leibkondadest, kus oli vähemalt kaks täiskasvanut, puudus 2010. aasta
I kvartalis kodus internetiühendus vähem kui kümnendikul. Peamiselt nimetati
internetiühenduse hankimise takistusena puudulikku interneti kasutamise oskust ning
seadmete ja ühendusega seotud kulusid.
Nagu ettevõtetes on ka leibkondade koduse internetiühenduse puhul valdavalt tegemist kiire
püsiühendusega. Kui ettevõtetes on levinuim DSL-tüüpi püsiühendus, siis leibkondades on
võrdselt levinud nii DSL- (telefonikaabli kaudu) kui ka muud tüüpi (kaabeltelevisioon jt)
püsiühendus. Linnalistes asulates on püsiühendus kaabeltelevisiooni kaudu mõnevõrra
rohkem levinud kui püsiühendus telefonikaabli kaudu. Maa-asulates on seevastu ülekaalus
interneti püsiühendus telefonikaabli kaudu. Telefonikaabli kaudu loodava internetiühenduse
puhul on peamiselt tegemist ADSL-ühendusega ja muudel juhtudel kaabeltelevisiooni
pakutava internetiühendusega. Kaabeltelevisiooni pakkujatel on oma teenust lihtsam
osutada tiheda asustusega piirkondades. See seletab ka, miks kaabeltelevisiooni on rohkem
linnalistes asulates.
Tabel 2 Koduse internetiühendusega leibkonnad tüübi ja elukoha järgi, I kvartal 2006–2010
Table 2 Households connected to the Internet at home by type of household and place of residence,
1st quarters of 2006–2010
(protsenti – percentages)
2006 2007 2008 2009 2010
Leibkonna tüüp Type of household
Üks täiskasvanu 24,9 33,0 37,3 37,5 45,0 One adult
Üks täiskasvanu lastega 45,6 51,5 77,7 82,0 83,8 One adult with children
Kaks täiskasvanut 32,2 37,9 42,1 52,6 60,8 Two adults
Kaks täiskasvanut lastega 71,4 81,9 88,9 92,1 92,9 Two adults with children
Kolm või enam täiskasvanut 63,3 72,5 79,4 82,4 87,5 Three or more adults
Leibkonna elukoht Household’s place of
residence
Linnaline asula 49,7 56,2 61,2 65,9 69,1 Urban settlement
Maa-asula 35,5 44,3 50,2 55,8 64,8 Rural settlement
Kõik leibkonnad 45,6 52,9 58,1 63,0 67,8 All households
Eurostati andmetel oli EL-is 2009. aasta I kvartalis internetiühendus 65%-l ja püsiühendus
56%-l leibkondadest. Kõige levinum oli kodune internetiühendus Hollandis, kus see oli
üheksal leibkonnal kümnest. Kodune interneti püsiühendus oli levinuim Rootsis, kus see oli
kaheksal leibkonnal kümnest. Eestis oli internetiühendusega leibkondade osatähtsus EL-i
keskmisest väiksem, seevastu püsiühendusega leibkondade osatähtsus üle keskmise.
Seega, kui Eesti leibkond plaanib hankida internetiühenduse, siis võetakse juba
püsiühendus. Internetiühenduse, eriti püsiühenduse levikut kasutatakse sotsiaalse sidususe
hindamiseks, kuna internetiühenduse abil on elanikel võimalus sekkuda ühiskonnaellu.
Siinjuures on väga oluline vähem kindlustatud elanike sotsiaalne sidusus, mistõttu vaatluse
alla on võetud ka internetiühenduse leviku ja leibkonna sissetulekute vaheliste seoste
uurimine. Sissetuleku järgi on leibkonnad jagatud riigiti kvartiilidesse. Selle põhjal võib väita,
et sissetulek mõjutab internetiühenduse hankimist tuntavalt. EL-is oli koduse
internetiühendusega leibkondade osatähtsuste vahe neljandas (suurima sissetulekuga) ja
esimeses kvartiilis 50 protsendipunkti (87% ja 37%). Kõige väiksem vahe oli Taanis –
7 protsendipunkti –, Eestis oli erinevus 61 protsendipunkti (93% ja 32%).
a
Leibkond on ühel aadressil elav ja ühist raha kasutav inimeste rühm, kelle liikmed ka ise tunnistavad end ühes
leibkonnas olevaks. Leibkond erineb perekonnast, mis rajaneb sugulus- või hõimlussuhetel.
54 INFOÜHISKOND INFORMATION SOCIETY
56.
INFOTEHNOLOOGIA KASUTAMINE USEOF INFORMATION TECHNOLOGY
Joonis 2 Koduse interneti püsiühendusega leibkonnad Euroopa Liidus, I kvartal 2009
Figure 2 Households with fixed broadband connection to the Internet at home in the European Union,
1st quarter of 2009
Rootsi — Sweden
Holland — Netherlands
Taani — Denmark
Soome — Finland
Luksemburg — Luxembourg
Suurbritannia — United Kingdom
Saksamaa — Germany
Malta — Malta
Belgia — Belgium
Eesti — Estonia
Austria — Austria
Prantsusmaa — France
Sloveenia — Slovenia
EL-27 — EU-27
Iirimaa — Ireland
Hispaania — Spain
Poola — Poland
Ungari — Hungary
Leedu — Lithuania
Läti — Latvia
Tšehhi — Czech Republic
Küpros — Cyprus
Portugal — Portugal
Slovakkia — Slovakia
Itaalia — Italy
Kreeka — Greece
Bulgaaria — Bulgaria
Rumeenia — Romania %
0 10 20 30 40 50 60 70 80
Allikad: Statistikaamet, Eurostat
Sources: Statistics Estonia, Eurostat
2010. aasta I kvartalis oli arvuti- ja internetikasutajate osatähtsus 16–74-aastaste Eesti
elanike hulgas võrreldes 2009. aasta I kvartaliga kolme protsendipunkti võrra suurem. Kui
16–34-aastastest kasutasid arvutit ja internetti peaaegu kõik, siis vanuse kasvades
internetikasutajate osatähtsus vähenes. 55–64-aastastest kasutasid 2010. aasta I kvartalis
arvutit ja internetti pooled, 65–74-aastastest veerand. Samal ajal oli 65–74-aastaste hulgas
arvuti- ja internetikasutajate osatähtsus eelneva aasta sama ajaga võrreldes kümne
protsendipunkti võrra suurem.
Enim kasutatakse internetti kodus (9,2 internetikasutajat 10-st). Töö juures on internetti
kasutanud alla nelja internetikasutaja kümnest. Interneti kasutamine töö juures on levinum
kõrgema haridustasemega inimeste hulgas, kõige vähem levinud on see madalama haridus-
tasemega internetikasutajate hulgas. Üks põhjuseid on seejuures asjaolu, et viimati
mainitute hulka kuuluvad ka õppurid, kes ei käi tööl.
EL-i elanikest kasutas 2009. aasta I kvartalis internetti 65%, Eesti oli selles pingereas
kümnes. Peamiselt on see tingitud väikesest internetikasutajate osatähtsusest vanemate
elanike hulgas. EL-i kõige usinamad internetikasutajad on Rootsi ja Hollandi elanikud, kelle
hulgas on internetti kasutanud üheksa inimest kümnest. Neis riikides on interneti kasutamine
levinud ka vanemate elanike seas – üle poole 65–74-aastastest on internetti kasutanud.
Suurem erinevus kui Eestis oli 65–74-aastaste ja 16–24-aastaste internetikasutajate
osatähtsuse vahel Sloveenias, Lätis, Leedus ja Poolas. Kõige väiksem on
internetikasutajate osatähtsus Rumeenias, kus 2009. aasta I kvartalis kasutas internetti vaid
kolmandik 16–74-aastastest. Kui Eestis kasutasid mehed ja naised internetti enam-vähem
võrdselt (naised pisut rohkem), siis EL-is oli meeste hulgas internetikasutajate osatähtsus
suurem kui naiste seas (vastavalt 68% ja 62%). Meeste ja naiste vaheline erinevus oli
suurim Itaalias (vastavalt 51% ja 41%), Portugalis (51% ja 42%), Austrias (76% ja 67%),
Luksemburgis (91% ja 82%) ja Kreekas (47% ja 38%).
INFOÜHISKOND INFORMATION SOCIETY 55
57.
INFOTEHNOLOOGIA KASUTAMINE USEOF INFORMATION TECHNOLOGY
Tabel 3 Internetikasutajad soo, elukoha, vanuse ja hõiveseisundi järgi, 2006–2010
Table 3 Use of the Internet by sex, place of residence, age and labour status, 2006–2010
(protsenti – percentages)
2006 2007 2008 2009 2010
Sugu Sex
Kokku 61,2 63,6 66,2 71,2 74,1 Total
Mehed 61,8 63,7 66,5 70,9 73,5 Males
Naised 60,7 63,5 65,9 71,5 74,7 Females
Elukoht Place of residence
Linnaline asula 63,3 65,2 67,9 72,6 74,6 Urban settlement
Maa-asula 56,4 59,9 62,4 68,0 72,9 Rural settlement
Vanuserühm Age group
16–24 93,6 93,0 94,7 97,9 98,0 16–24
25–34 83,3 86,3 89,4 95,1 95,5 25–34
35–44 72,1 77,8 80,0 85,9 90,0 35–44
45–54 55,8 56,9 60,3 66,6 71,1 45–54
55–64 29,4 32,3 36,6 46,2 47,1 55–64
65–74 10,9 13,8 15,6 13,7 23,8 65–74
Hõiveseisund Labour status
Töötajad ehk (tööga) 71,3 73,0 75,7 83,5 85,3 Employed persons
hõivatud
Töötud 44,3 59,3 71,1 71,0 76,5 Unemployed persons
Mittetöötavad 98,1 98,4 99,4 98,9 99,5 Students (not in the
(üli)õpilased labour force)
Mittetöötavad 19,1 23,2 27,0 31,9 37,8 Retired (not in the
pensionärid labour force) and other
jt mitteaktiivsed inactive
Joonis 3 Internetikasutajad Euroopa Liidus, I kvartal 2009
Figure 3 Internet users in the European Union, 1st quarter of 2009
Rootsi — Sweden
Holland — Netherlands
Luksemburg — Luxembourg
Taani — Denmark
Suurbritannia — United Kingdom
Soome — Finland
Saksamaa — Germany
Belgia — Belgium
Austria — Austria
Eesti — Estonia
Slovakkia — Slovakia
Prantsusmaa — France
Iirimaa — Ireland
EL-27 — EU-27
Läti — Latvia
Sloveenia — Slovenia
Hispaania — Spain
Tšehhi — Czech Republic
Ungari — Hungary
Malta — Malta
Leedu — Lithuania
Poola — Poland
Küpros — Cyprus
Portugal — Portugal
Itaalia — Italy
Kreeka — Greece
Bulgaaria — Bulgaria
Rumeenia — Romania %
0 10 20 30 40 50 60 70 80 90
Allikad: Statistikaamet, Eurostat
Sources: Statistics Estonia, Eurostat
Interneti kasutamise eesmärgid
Seitsmel Eesti ettevõttel kümnest oli veebisait, millel tutvustatakse peamiselt oma tooteid ja
teenuseid. Sagedamini oli veebileht suurematel ettevõtetel. Kõige rohkem oli veebilehega
ettevõtteid haridus- ning finants- ja kindlustusvaldkonnas – oma veebisait oli olemas
peaaegu kõigil nende valdkondade ettevõtetel. Kõige vähem oli veebilehega ettevõtteid
põllu- ja metsamajanduse ning kalapüügi tegevusalal – vaid viiendikul.
56 INFOÜHISKOND INFORMATION SOCIETY
58.
INFOTEHNOLOOGIA KASUTAMINE USEOF INFORMATION TECHNOLOGY
Eesti elanikud kasutavad internetti peamiselt veebiväljaannete lugemiseks, interneti-
panganduseks, e-postinduseks ja infootsinguks. Neil eesmärkidel kasutas 2010. aasta
I kvartalis internetti üheksa internetikasutajat kümnest. Toodete ja teenuste kohta otsis infot
kaheksa internetikasutajat kümnest. Kui kõigist internetikasutajatest otsis 2010. aasta
I kvartalis interneti kaudu tööd kolmandik, siis töötute internetikasutajate hulgas peaaegu
kõik. Internetti mängudeks kasutajate osatähtsus väheneb vanuse ja ka haridustaseme
kasvades ning mehed kasutavad internetti mängudeks rohkem kui naised. Sama tendents
on ka veebiraadio ja -televisiooni kasutamisel.
Interneti kasutamise oskustest on Eesti elanike hulgas enim suurenenud interneti kaudu
helistamine – viimase kolme aasta jooksul on internetti helistamiseks kasutanud
16–74-aastaste internetikasutajate osatähtsus suurenenud kaks korda (2007. aasta
I kvartalis 29%, 2010. aasta I kvartalis 59%). Kui otsingumootorit on kasutanud ja e-kirjale
faili lisanud enamik internetikasutajaid, siis failivahetusprogramme on kasutanud iga kolmas
ja veebilehte koostanud vaid iga kuues. Ka neid võimalusi kasutavad sagedamini nooremad
inimesed. 16–24-aastaste ja mittetöötavatest üliõpilastest internetikasutajate hulgas on
failivahetusprogramme kasutanud iga teine ja veebilehte koostanud iga kolmas.
Kui elektronposti kasutasid 2009. aasta I kvartalis sama usinalt ka teised EL-i elanikud, siis
internetipanga teenuste kasutamine ja veebiväljaannete lugemine on EL-is vähem levinud –
seda tegid vaid pooled EL-i internetikasutajatest. Majutusteenuste ja reisimise kohta on
EL-is internetist infot otsinud pooled, Eestis aga vaid veerand internetikasutajatest.
Avaliku sektori rakenduste kasutamine
Ka avaliku sektori veebisaitidel pakutavat ja saitide tehnilisi lahendusi arendatakse pidevalt.
Sooviga vähendada paberikulu kasutavad ettevõtted avaliku sektori pakutavaid e-suhtluse
võimalusi aina aktiivsemalt. Üha enam laadivad ettevõtted blankette alla ja tagastavad neid
interneti teel. Avaliku sektori veebisaitidelt otsis 2009. aastal infot ja laadis sealt blankette
alla kaheksa ettevõtet kümnest. Seitse ettevõtet kümnest on blankette ka tagastanud
interneti teel.
Eesti elanikud tunnevad avaliku sektori veebilehtede vastu vähem huvi kui ettevõtted –
avaliku sektori veebilehtedelt otsis 2010. aasta I kvartalis infot kuus internetikasutajat
kümnest. Blankette laadisid internetist alla ja tagastasid interneti teel pooled. Avaliku sektori
veebilehtede vastu on aasta-aastalt hakanud huvi tundma üha rohkem internetikasutajaid,
peale selle suureneb pidevalt ka internetikasutajate osatähtsus, seega võib öelda, et elanike
huvi avaliku sektori veebilehtede vastu üha suureneb.
ID-kaardi kasutamist vähemalt kümne hõivatuga ettevõtetes uurib Statistikaamet alates
2008. aastast. Selle aja jooksul on ID-kaardi kasutajate arv suurenenud ligi kaks korda. Kui
2008. aasta jaanuaris kasutas ID-kaarti kolmandik vähemalt kümne hõivatuga ettevõtetest,
siis 2010. aasta jaanuaris kaks kolmandikku. Rohkem kasutavad ID-kaarti suured ettevõtted.
Enim kasutatakse ID-kaarti digitaalallkirja andmiseks ja kasutaja tuvastamiseks
infosüsteemides. Kõige rohkem kasutavad ID-kaarti tervishoiu- ja sotsiaalhoolekande-,
finants- ja kindlustus- ning kutse-, teadus- ja tehnikategevusega ettevõtted, kõige vähem
aga majutus- ja toitlustusettevõtted.
Automaattöötlust võimaldavate e-arvete kasutamist on uuritud alates 2007. aastast. Kui
2007. aastal oli e-arveid saanud ettevõtete osatähtsus kaks korda suurem kui e-arveid
saatnud ettevõtete oma (vastavalt kümnendik ja viiendik), siis 2010. aastal nende ettevõtete
osatähtsus ühtlustus – mõlemaid oli vähemalt kümne töötajaga ettevõtete seas umbes
kolmandik.
E-kaubandus
Üldlevinud on arvamus, et Eesti on eesrindlik e-riik ja Eesti elanikud usinad internetiteenuste
tarbijad. E-kaubanduse statistika seda aga ei kinnita. Kümne või enama hõivatuga
ettevõtetest ostis 2008. aastal interneti kaudu (vähemalt 1% koguostudest) iga kuues, EL-i
ettevõtetest iga neljas. Kõige rohkem interneti kaudu oste teinud ettevõtteid oli Rootsis (ligi
pooled ettevõtted), järgnesid Belgia ja Iirimaa. Kõige vähem on internetis oste teinud
Rumeenia ja Bulgaaria ettevõtted. EL-i ettevõtted on interneti vahendusel ostnud peamiselt
INFOÜHISKOND INFORMATION SOCIETY 57
59.
INFOTEHNOLOOGIA KASUTAMINE USEOF INFORMATION TECHNOLOGY
oma riigi ettevõtetelt, veidi vähem teistest EL-i riikidest ja kõige vähem väljastpoolt EL-i. Vaid
Küprose, Malta ja Luksemburgi ettevõtete hulgas oli rohkem neid, kes tegid interneti kaudu
oste EL-ist, kui neid, kes ostsid oma riigist.
Kaupu ja teenuseid müüs (rohkem kui 1% müügitulust) 2008. aastal interneti kaudu nii Eesti
kui ka EL-i ettevõtetest iga kümnes. Suuremate ettevõtete hulgas oli oma kaupu ja
teenuseid interneti kaudu müünuid rohkem kui väiksemate ettevõtete seas. Tegevusalati oli
kõige rohkem interneti kaudu müünud ettevõtteid nii Eestis kui ka EL-is majutusettevõtete ja
reisiteenuste pakkujate hulgas. Interneti teel kaupu või teenuseid müünud ettevõtteid oli
kõige rohkem Hollandis, Belgias ja Rootsis ning kõige vähem Rumeenias ja Bulgaarias.
EL-i elanikest on interneti kaudu oste teinud üle kolmandiku, Eesti elanikest kuuendik. Kõige
usinamalt tegid 2008. aastal EL-is interneti kaudu oste Suurbritannia elanikud (kaks
kolmandikku), järgnesid Taani, Holland ja Rootsi. Kõige vähem tegid interneti kaudu oste
Rumeenia ja Bulgaaria elanikud. EL-i elanikud ostsid interneti kaudu kõige rohkem reisi- ja
majutusteenuseid, Eestis ürituste pileteid. Kõige rohkem osteti oma riigist, järgnesid teised
EL-i riigid, vähem osteti väljastpoolt EL-i.
Need Eesti elanikud, kes ei ole interneti kaudu oste teinud, nimetasid üheksal juhul kümnest
põhjusena vajaduse puudumist ja kaheksal juhul kümnest eelistust osta kaupa poest, et
seda oma silmaga näha. Neljandik pidas probleemiks turvariske ja sobimatu kauba
tagastamisega seotut.
Allikas
Source
Eurostati andmebaas. (2010). [e-andmebaas]
http://epp.eurostat.ec.europa.eu/portal/page/portal/information_society/data/database
(01.11.2010)
58 INFOÜHISKOND INFORMATION SOCIETY
60.
INFOTEHNOLOOGIA KASUTAMINE USEOF INFORMATION TECHNOLOGY
USE OF INFORMATION TECHNOLOGY
Mari Soiela
Statistics Estonia
Statistics Estonia has surveyed the use of information technology in enterprises with ten and
more persons employed since 2001. In 2010, 3,100 enterprises participated in the survey.
Statistics Estonia conducts the survey of information technology usage among persons aged
16–74 and in households as an annex to the Labour Force Survey since 2005. In 2010,
4,000 persons participated in the survey. The questionnaires of the Statistical Office of the
European Communities (Eurostat) “Community Survey on ICT usage in enterprises
(e-commerce)” and “Community Survey on ICT usage in households and by individuals”
serve as a basis for information technology surveys. On the basis of these questionnaires
the surveys “Information technology in enterprises” and “Information technology in
households” were compiled. The aim was to obtain general information on information
technology equipment, use of the Internet, e-commerce and various skills in using the
Internet and computer. The usage of information technology is studied by statistical
organisations in all European Union (EU) Member States on the basis of harmonised
methodology.
Distribution of Internet connection
In present-day Estonia nobody can imagine that an enterprise could exist without computers
and the Internet. The use of computers and the Internet by enterprises has reached its peak,
because there is no more room for further increase – almost all enterprises with ten and
more persons employed use computers and have Internet connection and this has been so
for the last three years. There still are a few enterprises that can manage without computers.
They mostly use the services of book-keeping firms for managing their public business and
accountancy or the given duties are performed by their parent enterprise. (Table 1)
Considering Internet connection, the speed of Internet connection is an essential indicator.
Provided speeds rise continuously, enabling an increased capacity of content to be shared
on the Internet. This, in turn, requires increasingly higher speeds of data transfer. In case of
narrowband connection, the connection is established by calling to the number of dial-up
centre of service provider. When using dial-up services via ordinary telephone line, the line
is busy during Internet connection; when using ISDN connection it is also possible to call by
phone at the same time. Broadband connection (e.g. DSL Digital Subscriber Line type of
connections, Internet connection via cable TV, etc.) is significantly faster than narrowband
connection. One wire is used for simultaneous transportation of multiple signals, for example
coaxial cable of cable TV is used to transmit hundreds of TV channels and the same cable is
also used for Internet connection. In DSL technology (e.g. ADSL), telephone lines are used
for data transfer.
In January 2010, nine out of ten enterprises had fixed broadband connection. The most
popular type of Internet connection in enterprises was still DSL broadband connection.
Slower types of non-broadband connection (dial-up, ISDN, mobile Internet) were used less
often and frequently in combination with broadband connection. The number of persons
using mobile Internet has increased – in January 2009 it was used by two and in 2010 by
three out of ten enterprises. Mobile connection providers have developed Internet
connection based on 3G- and 3.5G-technologies offering mobile broadband connection via
laptop in addition to mobile phone. Since mobile broadband connection is not tied to one
specific location only, it provides a possibility to abandon the fixed broadband connection in
particular in smaller enterprises. (Figure 1)
According to the data of Eurostat, 93% of enterprises in the EU Member States had access
to the Internet in 2009, thereby 82% had broadband connection. The share of enterprises
with Internet connection was the biggest in Finland (100%), Austria, Slovakia and Denmark
(98% in all three countries). The share of broadband connection users was the largest in
Finland (94%), Malta, Spain (93% in both) and France (92%). Regarding the economic
INFOÜHISKOND INFORMATION SOCIETY 59
61.
INFOTEHNOLOOGIA KASUTAMINE USEOF INFORMATION TECHNOLOGY
activities surveyed by Eurostat, 95% of Estonian enterprises had access to the Internet and
86% had broadband connection in January 2009.
The share of households with Internet connection at home is continuously increasing — in
a
the 1st quarter of 2009, 63% of households had access to the Internet at home, in the 1st
quarter of 2010 — 68%. Internet connection is more widespread in urban than in rural
settlements, but the gap is decreasing year-by-year. Internet connection at home is more
widespread among households with children. More than a half of single adults could
manage without Internet connection at home. Among households with children and two or
more adults, less than a tenth had no Internet connection at home. The main obstacle to
having Internet connection was lack of Internet skills and costs related to equipment and
connection.
Like in enterprises, broadband connection is the most widely spread type of Internet
connection also at home. Whereas in enterprises the DSL-connection is predominant, in
households the DSL (via telephone line) and other types (cable TV, etc.) of Internet
connection are equally popular. In urban settlements broadband connection via cable TV is
more common than DSL connection via telephone line. In rural settlements broadband
connection via telephone line (DSL connection) is predominant. Broadband connection via
telephone line refers mostly to ADSL connection, while other broadband connection stands
mostly for Internet connection offered by cable TV. It is easier for cable TV providers to offer
their services in densely populated areas, which explains the prevalence of cable TV in
urban settlements. (Table 2)
According to the data of Eurostat, in the 1st quarter of 2009, 65% of households had Internet
connection and 56% broadband connection in the EU. Internet connection at home is most
widespread in the Netherlands where nine out of ten households are connected to the
Internet. Broadband connection at home is most widespread in Sweden, where eight out of
ten households have broadband connection. In Estonia, the share of households with
Internet connection is smaller than the EU average, however, the share of households with
broadband connection is larger than the average. Thus, if a household in Estonia intends to
obtain Internet connection, they mostly decide on broadband connection. The penetration of
Internet connection, especially of the broadband connection, is used to assess social
cohesion, as Internet connection enables residents to get involved in social life. Hereby, the
inclusion of less-insured residents is very important, therefore the relation between
household income and access to the Internet has also been examined. Households are
divided into income quartiles by country. This suggests that income has a large influence on
getting Internet connection. In the EU, the share of households with Internet connection
differs in the fourth (with the biggest income) and in the first quartile by 50 percentage points
(87% and 37%, respectively). The gap was the smallest in Denmark – 7 percentage points.
In Estonia the gap was 61 percentage points (93% and 32%, respectively). (Figure 2)
In the 1st quarter of 2010 compared to the 1st quarter of 2009, the percentage of computer
and Internet users had increased three percentage points among the 16–74-year-old
Estonian residents. While in the age group 16–34 almost all persons used the computer and
Internet, the percentage of Internet users decreased with advancing age. Half of persons
aged 55–64 and a quarter of persons aged 65–74 used the computer and Internet in the 1st
quarter of 2010. At the same time, the percentage of computer and Internet users among
persons aged 65–74 had increased ten percentage points compared to the same period of
the previous year.
The Internet is mostly used at home (9.2 out of 10 Internet users). Less than four out of ten
Internet users have used Internet at work. The share of Internet users at work is bigger
among persons with higher education and the smallest among persons with lower
education. One of the reasons lies in the fact that also non-working students belong to this
group.
In the EU, the Internet was used by 65% of persons in the 1st quarter of 2009. Estonia
ranked tenth among the EU countries. It is mostly due to the small share of elderly people
using the Internet. The most eager users of Internet in the EU countries live in Sweden and
a
Household is a group of persons who live at the same address and share joint financial resources and whose
members consider themselves to be members of one household, while family is based on relationship or kinship.
60 INFOÜHISKOND INFORMATION SOCIETY
62.
INFOTEHNOLOOGIA KASUTAMINE USEOF INFORMATION TECHNOLOGY
the Netherlands where the Internet is used by nine out of ten persons. Even elderly people
often use the Internet there – more than a half of persons aged 65–74 there have used the
Internet. A wider gap than that in Estonia between Internet users of the age groups 65–74
and 16–24 was detected in Slovenia, Latvia, Lithuania and Poland. The share of Internet
users was the smallest in Romania, where only one third of population aged 16–74 used the
Internet in the 1st quarter of 2009. Whereas in Estonia men and women used the Internet
almost equally (women a little bit more), in the EU men were more frequent users of the
Internet than women (68% and 62%, respectively). The biggest gap between men and
women using the Internet was detected in Italy (51% and 41%, respectively), Portugal (51%
and 42%), Austria (76% and 67%), Luxembourg (91% and 82%) and Greece (47% and
38%). (Table 3, Figure 3)
Purposes of using the Internet
Seven out of ten enterprises in Estonia had their own web site, mainly used for introducing
own products and services. The share of enterprises with web site was bigger among large
enterprises. By economic activities, education and financial and insurance activities had the
biggest share of enterprises with own web site – almost all of them had it. Agriculture,
forestry and fishing enterprises had the smallest number of enterprises with own web site –
only one fifth of them had one.
Estonian residents use the Internet mostly for reading web publications, internet banking,
e-mailing and for information retrieval. Nine out of ten Internet users used the Internet for
these purposes in the 2nd quarter of 2010. Eight out of ten Internet users looked for
information about products and services on the Internet. While one third of Internet users
used the Internet for looking for a job in the 1st quarter of 2010, almost all unemployed
Internet users used the Internet for seeking for a job. The share of Internet users using the
Internet for playing games decreases with advancing age and higher educational level. Men
tend to use the Internet for playing games more often than women. The same trend applies
also to the use of web radio and television.
Telephoning via the Internet has increased Internet skills among Estonian residents the
most – the percentage of Internet users aged 16–74 who use the Internet for phone calls
has increased two times during the last three years (in the 1st quarter of 2007 – 29%, in the
1st quarter of 2010 – 59%). While the majority of Internet users have used the search
engine and attached files to e-mails, every third Internet user has used peer-to-peer file
share and only every sixth has created a webpage. Younger persons are more eager to use
these tools. Among Internet users aged 16–24 and non-working students every second has
used peer-to-peer file share and every third has created a web page.
While electronic mail was similarly popular also among other residents of the EU in the 1st
quarter of 2009, using of Internet banking and reading of e-publications is less common in
the EU – only a half of Internet users used the Internet for these purposes. Half of Internet
users in the EU have used the Internet for seeking for information related to travel and
accommodation services; but in Estonia only a quarter of all Internet users.
Use of public sector applications
Public authorities also develop the content and technical solutions of their web sites on a
regular basis. In connection with the intention of reducing the consumption of paper,
enterprises use the possibilities of electronic interaction with public authorities more and
more actively. Enterprises download more and more forms and return them via the Internet.
Eight out of ten enterprises obtained information and downloaded forms from the public
authorities’ web sites in 2009. Forms have been returned via the Internet by seven out of ten
enterprises.
Residents of Estonia are less interested in the public sector web sites than enterprises – six
out of ten Internet users looked for information on the web sites of public authorities in the
1st quarter of 2010. A half of Internet users downloaded and returned filled forms via the
Internet. The share of Internet users interested in the web sites of the public sector is rising
INFOÜHISKOND INFORMATION SOCIETY 61
63.
INFOTEHNOLOOGIA KASUTAMINE USEOF INFORMATION TECHNOLOGY
year-by-year, furthermore the share of Internet users is increasing steadily, too. Thus, it can
be stated that residents are more and more interested in the web sites of public authorities.
Since 2008, Statistics Estonia has surveyed the use of ID card in enterprises with ten or
more persons employed. During this period, the use of ID card has increased nearly twofold.
In 2008, ID card was used by one third of the enterprises with ten and more persons
employed, in 2010 ID card was already used by two thirds of them. Use of ID card on the
Internet is more common among large enterprises. Most common is the use of ID card for
giving digital signature, this is followed by authorizing users in information systems. The
most active users of ID card are enterprises of human health and social work activities,
financial and insurance activities and professional, scientific and technical activities. The
least active are enterprises of accommodation and food service activities.
The use of e-invoices in digital format enabling automatic processing has been studied since
2007. While in 2007 the share of enterprises that received e-invoices was two times bigger
than the share of enterprises sending out e-invoices (one tenth and one fifth, respectively),
in 2010 the share of enterprises receiving and sending out e-invoices equalized – about one
third of enterprises with ten and more persons employed in both cases.
E-commerce
Estonia is widely known as a progressive e-country and residents of Estonia as eager users
of Internet services. But, statistics about e-commerce do not confirm this opinion. Every sixth
enterprise with ten or more employees made purchases over the Internet (at least 1% of
total purchases) in 2008, in the EU – every fourth. Sweden had the largest number of
enterprises making purchases over the Internet – nearly a half of enterprises, Belgium and
Ireland followed. Romania and Bulgaria had the smallest share of enterprises making
purchases over the Internet. EU enterprises have bought goods over the Internet mainly
from their own country, a little less from other EU countries and the least from outside the
EU. Enterprises of Cyprus, Malta and Luxembourg were the only ones that bought over the
Internet more from other EU countries than from their own country.
Every tenth enterprise both in Estonia and in the EU sold goods and services over the
Internet (more than 1% of turnover). Among bigger enterprises there were more enterprises
selling goods and services over the Internet than among smaller enterprises. By economic
activities, the biggest number of sellers over the Internet was recorded among
accommodation enterprises and providers of travel services both in Estonia and in the EU.
The biggest number of enterprises selling over the Internet was recorded in the Netherlands,
Belgium and Sweden, and the smallest respective numbers in Romania and Bulgaria.
One third of EU residents and one sixth of the residents of Estonia have made purchases
over the Internet. In 2008, the most eager purchasers via the Internet were residents of the
United Kingdom (two thirds), they were followed by residents of Denmark, the Netherlands
and Sweden. Residents of Romania and Bulgaria were the least active purchasers via the
Internet. The residents of EU bought most actively travel and accommodation related
services over the Internet, the residents of Estonia – tickets to events. Most goods and
services were bought from sellers of own country, other EU countries followed. Less was
purchased from outside the EU.
Nine out of ten residents of Estonia who have not purchased over the Internet pointed out
the lack of need as one of the reasons, and eight out of ten preferred to buy products from
stores in order to have a look at them before buying. One fourth noted security risks and
concerns about returning unsatisfactory goods.
62 INFOÜHISKOND INFORMATION SOCIETY
64.
ELEKTROONILISE SIDE ARENGDEVELOPMENT OF TELECOMMUNICATIONS
ELEKTROONILISE SIDE ARENG
Liivi Adamson
Statistikaamet
Elektroonilise side teenustes on viimasel ajal hakanud üha olulisemat rolli mängima uued
tegevusvaldkonnad. Inimestele pole enam oluline koju või kontorini ulatuv kõneside- või
internetiühendus, vaid elektrooniline side, mis avab juurdepääsu vajalikule informatsioonile
ja meelelahutusele. 2009. aastal vähenesid elektroonilise side turul püsivõrgus tehtud
kõnede arv ja kestus. Kuigi 2009. aastal kahanes ka mobiiltelefonivõrgus tehtud kõnede arv,
siis kõneminutite arv kasvas. 2009. aastal jätkus kaabellevivõrgu turu kasv ja suurenes
interneti kaabelmodemi kasutajate arv.
Elektroonilise side sektor on majanduskriisis teiste valdkondadega võrreldes suhteliselt
edukalt hakkama saanud. 2009. aastal oli sektori käive peaaegu sama suur nagu
2008. aastal. Sideettevõtjad on mõnevõrra paremas olukorras kui teistes valdkondades
tegutsevad ettevõtted, kuna teenuste osutamise eest laekuvad perioodilised rahavood on
küllaltki stabiilsed ning võimaldavad ettevõtjatel tegevust jätkata. (Konkurentsiameti …
2009: 32)
Mobiiltelefoniteenus
Mobiiltelefoniteenuse kiire arengu etapp on läbi saanud ning turg on jõudnud arenenud turu
staadiumisse, kus olemasolev kliendibaas jaotub teenuseosutajate vahel ümber. Selget
mõju on avaldanud ka majanduskriis, mistõttu lõppkasutajad on vaadanud üle oma
kulutused mobiiltelefoniteenusele. (Konkurentsiameti … 2009: 33)
Mobiiltelefonivõrgus tehtud kõnede arv ja kestus suurenes aastatel 2005–2009 pidevalt.
Suhtlemisel eelistatakse mobiiltelefonivõrgu kõnesid, mille kestus ületas 2009. aastal
püsivõrgu kõneminutite arvu üle kahe korra. Siiski oli 2009. aasta suhteliselt stabiilne –
mobiiltelefonivõrgu kõnede arv vähenes eelneva aastaga võrreldes 1%. Samal ajal on
mobiiltelefonivõrgus tehtud kõned muutunud pikemaks. 2009. aastal kestis üks kõne
keskmiselt 1 minut ja 30 sekundit. Saadetud lühisõnumite arv oli 2009. aastal ligi 6%
väiksem kui 2008. aastal.
Tabel 1 Kõned ja lühisõnumid mobiiltelefonivõrgus, 2005–2009
Table 1 Calls and short messages in mobile telephone network, 2005–2009
(miljonit – millions)
2005 2006 2007 2008 2009
Kõned Eesti mobiil- 1 021,8 1 220,7 1 305,2 1 285,0 1 266,6 Calls into Estonian
telefonivõrkudesse mobile networks
võrgusisesed 601,2 727,2 761,5 753,2 761,8 inside one mobile
network
teistesse telefoni- 420,6 493,5 543,7 531,8 504,9 into other mobile
võrkudesse networks
Kõned 71,1 78,4 91,2 101,1 91,7 Calls into permanent
püsivõrku network
Kõned Eestist 14,7 16,8 17,6 22,2 21,1 Calls to foreign
välismaale countries
Kõned välismaalt 20,3 19,6 17,3 24,3 35,6 Calls from foreign
Eestisse countries
Kõned 18,0 23,6 35,3 66,5 82,1 Calls in foreign
välismaal countries
Lühisõnumid 144,8 216,3 214,2 233,0 219,2 Short messages
SMS 143,6 214,5 212,3 231,7 217,8 SMS
MMS 1,2 1,8 1,9 1,5 1,3 MMS
KOKKU 1 290,7 1 575,4 1 680,8 1 732,1 1 716,3 TOTAL
INFOÜHISKOND INFORMATION SOCIETY 63
65.
ELEKTROONILISE SIDE ARENGDEVELOPMENT OF TELECOMMUNICATIONS
Joonis 1 Kõnede kestus, 2002–2009
Figure 1 Duration of calls, 2002–2009
Miljonit minutit
Million minutes
2500
Püsivõrgus
In permanent network
2000
Mobiiltelefonivõrgus
In mobile network
1500
1000
500
0
2002 2003 2004 2005 2006 2007 2008 2009
Mobiil- ja tavatelefonide kasutuselt 100 elaniku kohta oli Eesti 2008. aastal Rahvusvahelise
Telekommunikatsiooni Liidu (International Telecommunication Union) andmetel Euroopas
keskmiste seas – 100 inimese kohta oli kasutuses 158 telefoni.
Joonis 2 Mobiiltelefonivõrgu kliendid ja põhitelefoniliinid 100 elaniku kohta, 2008
Figure 2 Mobile network users and main (fixed) telephone lines per 100 inhabitants, 2008
Luksemburg — Luxembourg
Saksamaa — Germany
Itaalia — Italy
Suurbritannia — United Kingdom
Portugal — Portugal
Kreeka — Greece
Rootsi — Sweden
Leedu — Lithuania
Venemaa — Russia
Taani — Denmark
Iirimaa — Ireland
Austria — Austria
Holland — Netherlands
Bulgaaria — Bulgaria
Küpros — Cyprus
Soome — Finland
Eesti — Estonia
Hispaania — Spain
Tšehhi — Czech Republic
Malta — Malta
Belgia — Belgium
Ungari — Hungary
Sloveenia — Slovenia
Prantsusmaa — France
Austraalia — Australia
Poola — Poland
Rumeenia — Romania
Ameerika Ühendriigid — United States of America
Läti — Latvia
Slovakkia — Slovakia
Kanada — Canada
Maailmas keskmiselt — Average of the world
Hiina — China
0 50 100 150 200 250
Mobiiltelefonivõrgu kliendid 100 elaniku kohta
Mobile network users per 100 inhabitants
Põhitelefoniliinid 100 elaniku kohta
Main (fixed) telephone lines per 100 inhabitants
Allikad: Rahvusvaheline Telekommunikatsiooni Liit, Statistikaamet
Sources: International Telecommunication Union, Statistics Estonia
Aastatel 2005–2008 suurenes mobiiltelefonivõrgu klientide arv pidevalt, 2009. aasta lõpuks
aga kasv peatus ja mobiiltelefonivõrgu klientide arv vähenes varasema aastaga võrreldes
3%. Lepinguliste klientide arv püsis 2009. aastal samal tasemel nagu aasta varem, kuid
kõnekaardi kasutajate arv vähenes 9%. Mobiiltelefonivõrgu klientide hulgas oli 67%
lepingulisi kliente ja 33% kõnekaardi kasutajaid.
64 INFOÜHISKOND INFORMATION SOCIETY
66.
ELEKTROONILISE SIDE ARENGDEVELOPMENT OF TELECOMMUNICATIONS
Joonis 3 Mobiiltelefonivõrgu kliendid, 2005–2009
Figure 3 Mobile network users, 2005–2009
Tuhat
Thousands
1200
Lepingulised kliendid
Contractual mobile
1000 phone customers
Kõnekaardi kasutajad
800 Prepaid card users
600
400
200
0
2005 2006 2007 2008 2009
Telefoniteenus
Kõnede arv ja kestus püsivõrgus aastatel 2005–2009 vähenes ja 2009. aastal oli kõnesid
kolmandiku võrra vähem kui 2005. aastal. Püsivõrgus tehtud kõnede arv vähenes
2009. aastal eelneva aastaga võrreldes 14% ja kestus 8%. Enim vähenes dial-up-kõnede
arv ja kestus, olles vastavalt 57% ja 41% eelneva aasta samast näitajast. Rahvusvaheliste
kõnede arv püsivõrgus suurenes 2009. aastal varasema aastaga võrreldes 5%.
Tabel 2 Kõned püsivõrgus ja telegrammid, 2005–2009
Table 2 Calls in permanent network and telegrams, 2005–2009
2005 2006 2007 2008 2009
Riigisisesed 325,0 289,5 274,4 244,6 209,3 Domestic calls,
kõned, mln millions
soodustariifiga 94,1 76,9 68,1 58,1 51,4 cheap rate
öötariifiga 5,1 5,2 5,1 5,1 4,6 night rate
Rahvusvahelised 38,8 31,9 26,9 25,6 26,9 International calls,
kõned, mln millions
väljaläinud 20,7 18,2 16,0 13,7 13,1 outgoing
sissetulnud 18,2 12,8 11,0 11,9 13,7 incoming
Kõned mobiiltelefoni- 73,0 69,3 61,5 56,8 50,4 Calls into mobile
võrku, mln network, millions
Dial-up-kõneda, mln 5,9 3,6 1,5 0,7 0,4 Dial-up calls a, millions
Telegrammid, tuhat 13 8 7 4 4 Telegrams, thousands
välismaale 11 8 4 4 4 to foreign countries
a
Internetti saamiseks kasutatakse arvutiga ühendatud välist või integreeritud analoogmodemit ja telefoniliini,
et teha sissehelistamine teenusepakkujale. Teenusepakkuja ja kasutaja modemi vahel luuakse ühendus, mis
omakorda suunatakse internetti.
a
For getting Internet access, an external or integrated analogue modem connected to a computer and a telephone line
are used to dial into an Internet service provider's (ISP) node. A modem-to-modem link is established between the
ISP and user’s modems, which is then routed to the Internet.
Kaarditaksofonid
Taksofonide esialgne eesmärk oli lihtsustada suhtlemist ajal, kui eratarbimises olevate
telefonide hulk oli piiratud. Praeguseks on vajadus selle teenuse järele mobiiltelefonide
laialdase leviku tõttu vähenenud. Mullu kahanes kaarditaksofonide hulk poole võrra.
Kaabelleviteenus
Kaabeltelevisiooni teenuse kasutamine on viimastel aastatel stabiilselt kasvanud.
2009. aastal suurenes kaabeltelevisiooni klientide arv eelneva aastaga võrreldes 15 000
võrra ehk 5%. Ligi 60% kaabeltelevisiooni klientidest kasutasid ka interneti kaabelmodemit.
Kaabelmodemiga internetiühendust kasutavate elanike arv kasvas 2009. aastal 22%.
INFOÜHISKOND INFORMATION SOCIETY 65
67.
ELEKTROONILISE SIDE ARENGDEVELOPMENT OF TELECOMMUNICATIONS
xDSL-liinide arv kasvas aastatel 2005–2008 kiiresti, kuid praeguseks on kasv aeglustunud.
2009. aastal oli xDSL-liine 4% rohkem kui 2008. aastal. ISDN-liinide arv kasvas 2009. aastal
eelneva aastaga võrreldes 6%.
Tabel 3 Elektroonilise side teenused, 2005–2009
Table 3 Telecommunication services, 2005–2009
2005 2006 2007 2008 2009
Põhitelefoniliinid, 455 472 490 501 427 Main telephone lines,
tuhat thousands
linnas 369 385 403 415 338 in urban areas
maal 86 87 86 85 89 in rural areas
Erakliente teenindavad 326 329 331 337 278 Private telephone lines,
liinid, tuhat thousands
Kaarditaksofonid 2 112 1 979 1 852 1 383 729 Public phones
Mobiiltelefonivõrgu 1 444,3 1 578,8 1 611,4 1 624,8 1 573,0 Mobile network users,
kliendid, tuhat thousands
lepingulised 820,0 898,7 990,8 1 051,5 1 050,5 contractual mobile
phone customers
ettemaksukaardi 624,3 680,1 620,7 573,3 522,5 prepaid card users
(kõnekaardi) kasutajad
Kaabel-TV kliendid, 211 243 279 304 319 Cable-TV users,
tuhat thousands
interneti kaabelmodemi 53 91 132 153 186 Internet cable
kasutajad modem users
Telefoniliini kaudu 155 158 207 224 299 Internet connection by
loodava telephone lines users,
internetiühenduse thousands
kasutajad, tuhat
püsiühenduse 142 149 202 220 295 permanent
kasutajad connection by
telephone lines users
sissehelistamisteenuse 13 9 4 4 4 Dial-up connection
kasutajad users
ISDN-liinid 50 846 50 534 55 207 56 319 59 868 ISDN lines
xDSL-liinid 101 543 130 565 153 857 181 568 188 735 xDSL lines
Andmeside
Üha enam tarbitakse mitut teenust paralleelselt (lairibateenus, telefoniteenus,
kaabelleviteenus, mobiiltelefoniteenus). Seetõttu on aina populaarsemaks muutunud
sideteenuste komplekslahendused, kus ühe kuutasu eest saab kasutada vähemalt kahte
sideteenust.
2009. aastal suurenes telefoniliini kaudu loodavat internetiühendust kasutavate elanike arv
8%. Enamik neist kasutas interneti püsiühendust. Sissehelistamisteenusega
internetiühenduse kliente oli 3000 – vaid 1% telefoniliini kaudu loodava internetiühenduse
kasutajatest.
Joonis 4 Telefoniliini kaudu loodava internetiühenduse kasutajad, 2003–2009
Figure 4 Internet connection by telephone lines users, 2003–2009
Tuhat
Thousands
300
Püsiühenduse kasutajad
Permanent connection by
250 telephone lines users
200
150
100
50 Sissehelistamisteenuse
kasutajad
0 Dial-up connection users
2003 2004 2005 2006 2007 2008 2009
66 INFOÜHISKOND INFORMATION SOCIETY
68.
ELEKTROONILISE SIDE ARENGDEVELOPMENT OF TELECOMMUNICATIONS
Konkurentsiameti hinnangul pakub fikseeritud andmesidele üha enam konkurentsi mobiilne
lairibaühendus, kuna selle teenuse hinnad ja ühenduskiirused on võrreldavad või kohati
isegi paremad kui fikseeritud andmesideühenduse hinnad. Täielikku asendatavust
takistavad veel mahupiirangud ja ühenduskiiruse kvaliteedi tagamine. (Konkurentsiameti …
2009: 35)
Üha enam kasutatakse ka elektroonilist kirjavahetust ja internetisuhtlust. Seetõttu väheneb
kirjade saatmine aasta-aastalt ja postiteenuseid kasutatakse üha vähem.
Joonis 5 Väljastatud kirisaadetised ja telefonikõned, 2002–2009
Figure 5 Outgoing letters and telephone calls, 2002–2009
Miljonit kirisaadetist Miljonit kõnet
100 Million outgoing letters Million calls
2500
90 2250
80 2000
70 1750
60 1500
50 1250
40 1000
30 750
20 500
10 250
0 0
2002 2003 2004 2005 2006 2007 2008 2009
Väljastatud kirisaadetised Kõned
Outgoing letters Calls
Niisiis iseloomustas elektroonilise side turgu 2009. aastal telefoniteenuse mahtude
vähenemine, mobiiltelefoniteenuse ja kaabelleviteenuse mahtude stabiliseerumine ning
andmesideteenuse kasutajate arvu kasv.
Allikas
Source
Konkurentsiameti aastaraamat 2009. (2009). [www]
http://www.konkurentsiamet.ee/public/AASTARAAMAT_2009.pdf
INFOÜHISKOND INFORMATION SOCIETY 67
69.
ELEKTROONILISE SIDE ARENGDEVELOPMENT OF TELECOMMUNICATIONS
DEVELOPMENT OF TELECOMMUNICATIONS
Liivi Adamson
Statistics Estonia
In telecommunication services, totally new spheres of activity are gaining an increasingly
important role. Fixed telephone and Internet services at home and offices are not as
essential for people as telecommunication that opens access to the necessary information
and entertainment. In 2009, the number and duration of calls in permanent network
decreased in the market of telecommunication services. Although the number of calls in
mobile networks decreased, the duration of calls in mobile networks increased. In 2009, the
number of cable-TV users kept growing and the number of Internet cable modem users
increased.
Compared to other sectors, the telecommunications sector has coped relatively well in the
conditions of economic crisis. The 2009 turnover of the sector was almost the same as in
2008. Communications undertakings have a somewhat better situation than undertakings in
other fields, because their periodic cash flows for services are rather stable and make it
possible to continue their activities (Konkurentsiameti … 2009: 32).
Mobile telephone service
A rapid development phase is over for the mobile telephone service and the market has
reached the stage of a developed market where redistribution of the customer base is taking
place between service providers. Economic crisis has also had its impact, and as a result,
end users have reviewed their mobile telephone service costs (Konkurentsiameti … 2009:
33).
The number and duration of mobile telephone calls increased continuously during 2005–
2009. For communication, people prefer calls in the mobile network. In 2009 the duration of
mobile calls exceeded the duration of calls made in permanent network more than twofold.
However, the year 2009 was relatively stable – the number of mobile telephone calls
decreased by 1% compared to the previous year. At the same time, mobile calls have grown
longer in duration. In 2009 one call lasted on average for 1 minute and 30 seconds. The
number of sent short messages decreased nearly 6% compared to 2008. (Table 1 and
Figure 1)
Regarding the usage of mobile and fixed telephones per 100 inhabitants, Estonia, with its
158 phones per 100 persons, ranked somewhere in the middle in Europe in 2008 according
to the data of International Telecommunication Union. (Figure 2)
In 2005–2009 the number of mobile telephone network users increased continuously, but by
the end of 2009 the growth stopped and the number of mobile network users decreased 3%
compare to the previous year. The number of contractual mobile phone customers stayed at
the same level in 2009 as it had been a year earlier, but the number of prepaid card users
decreased 9%. Among the clients of mobile telephone network, there were 67% of
contractual mobile phone customers and 33% of prepaid card users. (Figure 3)
Telephone service
The number and duration of calls in permanent network decreased in 2005–2009 and in
2009 the number of calls was by one third smaller than in 2005. In 2009 compared to the
previous year, the number of calls in permanent network decreased 14% and the duration of
calls decreased 8%. The number and duration of dial-up calls decreased the most,
comprising 57% and 41%, accordingly, compared to the respective indictors of the previous
year. The number of international calls made in permanent network increased 5% in 2009
compared to the previous year. (Table 2)
68 INFOÜHISKOND INFORMATION SOCIETY
70.
ELEKTROONILISE SIDE ARENGDEVELOPMENT OF TELECOMMUNICATIONS
Public phones
The initial aim of pubic phones was to simplify communication at the time when the number
of phones in private use was limited. By now, a need for this service has decreased due to
an extensive spread of mobile phones. Last year the number of public phones decreased by
a half.
Cable-TV service
The use of cable-TV service has increased steadily in recent years. In 2009, there were
15,000 more cable-TV users or 5% more than a year ago. Nearly 60% of cable-TV users
had also Internet cable modem. The number of Internet cable modem users increased 22%
last year.
During 2005–2008 the number of xDSL lines increased rapidly, but by now the growth has
slowed down. In 2009 there were 4% more xDSL lines than in 2008. In 2009 the number of
ISDN lines increased 6% compared to the previous year. (Table 3)
Data communication
More and more end users use several services in parallel (broadband service, telephone
service, cable television service, mobile telephone service). This has considerably increased
the popularity of communications service packages which embrace at least two types of
communication services for the same monthly fee.
In 2009 the number of inhabitants using Internet connection by telephone lines increased
8%. The majority of customers used permanent Internet connection. 3,000 customers used
dial-up calls for Internet connection which makes up only 1% of the persons using Internet
connection by telephone lines. (Figure 4)
In the opinion of the Estonian Competition Authority, mobile broadband connection makes
competition for fixed data communication increasingly tighter since the service prices and
connection speeds are equal to and sometimes even better than the prices of fixed data
communication connection. Full replacement ability is still hindered by volume limitations
and quality problems concerning the connection speed. (Konkurentsiameti … 2009: 35)
People use e-mails and communication via the Internet more and more widely. In
connection with that, sending of letters decreases year by year and postal services are used
continuously less. (Figure 5)
A decline in the volumes of telephone services, levelling-off of the mobile telephone and
cable-TV service volumes and growth in the number of data communication service users
are the trends characteristic of the telecommunications market in 2009.
INFOÜHISKOND INFORMATION SOCIETY 69
71.
IKT ETTEVÕTETE ARENGDEVELOPMENT OF ICT ENTERPRISES
INFO- JA KOMMUNIKATSIOONITEHNOLOOGIA
SEKTORI ETTEVÕTETE ARENG
Tiina Pärson, Reet Nestor, Merike Põldsaar
Statistikaamet
IKT sektori Info- ja kommunikatsioonitehnoloogia (IKT) sektorisse kuuluvad ettevõtted nii tööstuse kui
määratlus ka teeninduse tegevusaladelt. Nende ettevõtete tooted säilitavad, edastavad või kuvavad
andmeid ja infot elektrooniliselt. IKT sektori tööstusettevõtete hulka kuuluvad
elektronkomponente ja trükkplaate, arvuteid ja arvuti välisseadmeid, sideseadmeid,
tarbeelektroonikat ning magnet- ja optilisi andmekandjaid tootvad ettevõtted. Need on
töötleva tööstuse tegevusala ettevõtted, mille toodangut kasutatakse infotöötluses ja sides,
sealhulgas ülekandmiseks ja kuvamiseks, või mille tooted kasutavad elektroonilist töötlust
materiaalsete nähtuste tuvastamisel, mõõtmisel ja/või salvestamisel või füüsikaliste
protsesside juhtimisel. IKT teenindussektorisse kuuluvad tegevusalad infotöötluse ja side
talitluse võimaldamiseks elektrooniliste vahenditega nii info- ja sidetehnika müügi kui ka
telekommunikatsiooni ja arvutiteeninduse vallast.
IKT sektori tegevusalade koosseis on kokku lepitud Majanduskoostöö ja Arengu
a
Organisatsiooni (OECD) infoühiskonna töörühmas . Tegevusalati on ettevõtted jaotatud
Eesti majanduse tegevusalade klassifikaatori (EMTAK 2008) järgi (vt lisa artikli lõpus).
Artiklis on esitatud IKT sektori ettevõtete finantsmajandusliku tegevuse andmeid, mis on
kogutud riikliku statistilise aruandega EKOMAR („Ettevõtte kompleksne kalendriaasta
aruanne”). IKT sektori ettevõtete andmeid on võrreldud kõikide mittefinantsteenuseid
pakkuvate ettevõtete omadega. IKT sektori tööstusettevõtteid on võrreldud kogu töötleva
tööstuse omadega (EMTAK-is tegevusala jagu C) ja IKT sektori teenindusettevõtteid kogu
teenindusvaldkonna omadega. Teeninduses on EMTAK-i järgi järgmised tegevusalad:
kaubandus, veondus ja laondus; majutus ja toitlustus; info ja side; kinnisvaraalane tegevus;
kutse-, teadus- ja tehnikaalane tegevus; haldus- ja abitegevused; arvutite, tarbeesemete ja
kodutarvete parandus (EMTAK-is jaod G, H, I, J, L, M, N ja osa S95).
IKT sektori Eestis tegutses 2008. aastal IKT sektoris 1849 ettevõtet – vaid napp 3% kõigist ettevõtetest.
ettevõtted 2005. aastaga võrreldes on IKT sektor suurenenud kolmandiku ehk 470 ettevõtte võrra.
Ettevõtete tegevuse laienemine teeninduse tegevusaladele on omane ka IKT sektorile –
tänu teenindusettevõtete arvu suurenemisele kasvas kogu IKT sektori ettevõtete arv.
Tööstusettevõtete arv IKT sektoris ei ole analüüsitavate aastate jooksul eriti muutunud, neid
on olnud umbes 80.
60% Eesti IKT sektori ettevõtetest pakub programmeerimisteenuseid, arvutikonsultatsioone
või arvutisüsteemide ja andmebaaside halduse ning muid infotehnoloogia- ja
arvutiteenuseid. Programmeerimisteenuseid pakub seejuures ligi kolmandik IKT sektori
ettevõtetest. Sellised teenused on näiteks arvutiprogrammide struktuuri ja sisu
projekteerimine ning programmikoodi kirjutamine süsteemi- ja rakendustarkvara,
andmebaaside või veebilehtede loomiseks ja juurutamiseks ning tarkvara modifitseerimine,
testimine, toetus ja kohandamine tarkvara funktsionaalsuse tagamiseks kliendi
arvutisüsteemi keskkonnas.
a
http://www.oecd.org/dataoecd/49/17/38217340.pdf
70 INFOÜHISKOND INFORMATION SOCIETY
72.
IKT ETTEVÕTETE ARENGDEVELOPMENT OF ICT ENTERPRISES
Tabel 1 IKT sektori ettevõtete arv, 2005–2008
Table 1 Number of enterprises in ICT sector, 2005–2008
Tegevusala 2005 2006 2007 2008 Kind of activity
IKT sektor kokku 1380 1635 1812 1849 ICT sector total
IKT sektori tööstusettevõtted 77 89 80 78 ICT sector in manufacturing
elektronkomponentide ja 29 36 35 37 manufacture of electronic
trükkplaatide tootmine components and boards
arvutite ja arvuti 16 14 16 19 manufacture of computers
välisseadmete tootmine and peripheral equipment
sideseadmete 23 24 21 15 manufacture of
tootmine communication equipment
tarbeelektroonika 9 12 6 6 manufacture of consumer
tootmine electronics
magnet- ja optiliste 0 3 2 1 manufacture of magnetic
andmekandjate tootmine and optical media
IKT sektori teenindusettevõtted 1303 1546 1732 1771 ICT sector in services
info- ja sidetehnika 254 313 295 264 wholesale of information and
hulgimüük communication equipment
tarkvara kirjastamine 31 35 44 33 software publishing
telekommunikatsioon 98 93 109 107 telecommunications
programmeerimine, 740 881 1067 1103 computer programming,
konsultatsioonid jms consultancy and related
tegevused activities
andmetöötlus, veebihosting 85 112 122 163 data processing, hosting and
jms tegevused; related activities; web portals
veebiportaalide tegevus
arvutite ja sideseadmete 95 112 95 101 repair of computers and
parandus communication equipment
IKT sektori IKT sektor andis 2008. aastal tööd ligi 18 000 inimesele ehk ligikaudu 4%-le kõikide
tööhõive ettevõtete töötajatest. Koos ettevõtete arvu kasvuga on suurenenud ka IKT sektori
teenindusettevõtete töötajate arv – 2005. aastaga võrreldes kolmandiku võrra. Töötleva
tööstuse ettevõtete töötajate arv IKT sektoris vaadeldud aastatel aga vähenes.
Joonis 1 IKT sektori töötajate arv, 2005–2008
Figure 1 Number of employees in ICT sector, 2005–2008
18 000 IKT sektor kokku
16 000 ICT sector total
14 000
IKT sektori
12 000 teenindusettevõtted
10 000 ICT sector's service
enterprises
8 000
IKT sektori tööstusettevõtted
6 000
ICT sector's manufacturing
4 000 enterprises
2 000
0
2005 2006 2007 2008
2008. aastal oli kolmandik IKT sektori töötajatest hõivatud töötleva tööstuse ja kaks
kolmandikku teenindusettevõtetes. Nelja aasta jooksul on toimunud olulised muutused –
2005. aastal olid need näitajad 45% töötlevas tööstuses ja 55% teeninduses. Veerand kogu
IKT sektori töötajatest on palgal programmeerimise tegevusala ettevõtetes, mille töötajate
koguarv suurenes nelja aasta jooksul üle pooleteise korra.
IKT sektori ettevõttes töötas keskmiselt kümme inimest ehk pisut enam kui keskmises Eesti
ettevõttes. Iseäranis suur erinevus tööjõumahukuses oli tööstuse tegevusaladel. IKT sektori
tööstusettevõtte keskmine hõivatute arv oli üle kolme korra suurem kui kogu töötleva
tööstuse keskmine – vastavalt 77 ja 22 inimest. IKT sektori tööstusettevõtete suurt tööhõivet
mõjutasid peamiselt suured sideseadmeid tootvad ettevõtted. Teenindusettevõtted on neile
omaselt väiksema töötajate arvuga, mida IKT sektoris ilmestavad suure töötajate arvuga
telekommunikatsiooniettevõtted.
INFOÜHISKOND INFORMATION SOCIETY 71
73.
IKT ETTEVÕTETE ARENGDEVELOPMENT OF ICT ENTERPRISES
Teenindusettevõtete arvukus on määrav ka kogu IKT sektori jaotuse kujunemisel ettevõtete
suuruse järgi. 90% IKT sektorist on alla kümne hõivatuga ehk mikroettevõtted. Töötleva
tööstuse ettevõtetest on tegevusalale omasemalt IKT sektoris olulisel kohal väike-, keskmise
suurusega ja suurettevõtted, mille osatähtsus on kokku umbes 40%.
Joonis 2 IKT sektori ettevõtete osatähtsus hõivatute arvu suurusrühma järgi, 2008
Figure 2 Percentage of enterprises in ICT sector by employment size class, 2008
%
100
250+ hõivatut
250+ persons emoployed
80
50–249 hõivatut
50–249 persons employed
60
10–49 hõivatut
10–49 persons employed
40
1–9 hõivatut
1–9 persons employed
20
0
IKT sektor kokku IKT sektori IKT sektori
ICT sector total tööstusettevõtted teenindusettevõtted
ICT sector's ICT sector's
manufacturing service enterprises
enterprises
IKT toodangu ja IKT sektori müügitulu oli 2008. aastal üle 30 miljardi krooni. Neli viiendikku sellest andsid
teenuste müük teenindus- ja ühe viiendiku tööstusettevõtted. Suurima müügituluga on telekommunikat-
siooni tegevusala, mille käive on ligi pool IKT sektori teenindusettevõtete ja ligi 40% kogu
IKT sektori müügitulust.
2007. aastaga võrreldes IKT sektori müügitulu kasv 2008. aastal aeglustus, kuid oli siiski
kiirem kui kogu ettevõtete sektori oma. Kasvu tagasid IKT sektori tööstusettevõtted, mille
müügitulu kasvutempo kiirenes. 2008. aastal müüsid IKT sektori tööstusettevõtted toodangut
11% rohkem kui aasta varem, peamiselt tänu elektronkomponente ja sideseadmeid
tootvatele ettevõtetele. IKT sektori teenindusettevõtete müügitulu kasv jäi hoolimata
telekommunikatsiooniteenuseid pakkuvate ettevõtete pidevast müügikasvust tagasi-
hoidlikumaks – müügitulu oli vaid 1% suurem kui 2007. aastal.
Eesti IKT sektori tööstusettevõtete toodangus on suur osatähtsus elektronkomponentidel –
pooljuhtidel, pooljuhtseadistel, elektroonilistel integraallülitustel ning trükkplaatidel ja
kiipkaartidel –, mida müüakse eelkõige välisturul. Nõudlus elektronkomponentide järele on
aasta-aastalt kasvanud, kuid viimane ülemaailmne kriis avaldas tugevat mõju ka
elektroonikatööstusele, mistõttu 2009. aastal olid paljud IKT sektori tööstusettevõtted
välisnõudluse puudumise tõttu sunnitud tootmismahtusid vähendama.
Tabel 2 Põhiliste elektronkomponentide tootmine, 2005–2009
Table 2 Manufacture of main electronic components, 2005–2009
2005 2006 2007 2008 2009
Pooljuhtdioodid, 7,6 8,6 11,3 24,0 20,7 Production of diodes,
tuhat tk transistors, thousand pcs.
Trükkplaadid, 2707,5 3005,2 3431,2 5525,0 3965,6 Loaded printed circuits,
tuhat tk thousand pcs.
Kiipkaardid, 22,0 70,0 314,7 199,0 192,0 Smart cards, thousand
tuhat tk pcs.
Teine suurem toodete rühm on arvutid ja arvuti välisseadmed ning sideseadmed. Erinevalt
elektroonikakomponentide tootmisest läheb Eesti arvutitööstuse ettevõtete toodang
peamiselt siseturule. Arvutite tootmine hakkas kiiresti kasvama 2000. aastate esimeses
pooles ja eriti kiire oli kasv aastatel 2004–2005, kui toodeti üle 70 000 arvuti. Stabiilne kasv
jätkus ka järgmisel kolmel aastal. 2009. aastal vähenes arvutite tootmine olulisel määral,
seda peamiselt kodumaise turu nõudluse languse tõttu.
72 INFOÜHISKOND INFORMATION SOCIETY
74.
IKT ETTEVÕTETE ARENGDEVELOPMENT OF ICT ENTERPRISES
Tabel 3 Arvutite tootmine, 2005–2009
Table 3 Manufacture of computers, 2005–2009
2005 2006 2007 2008 2009
Arvutid, tuhat tk 70,4 57,1 59,3 46,7 25,2 Production of computers,
thousand pcs.
Omatoodangu müük, 70,4 56,1 58,1 44,2 23,7 Sold producion,
tuhat tk thousand pcs.
Omatoodangu müük, 522 096 471 989 445 614 308 592 147 316 Sold production,
tuhat krooni thousand kroons
omatoodangu 4 787 12 305 28 650 6 570 3 739 exports, thousand
eksport, tuhat kroons
krooni
Peale elektronkomponentide, arvutite ja sideseadmete kuuluvad IKT sektori tööstus-
ettevõtete toodangusse ka heli- ja visuaalsignalisatsiooni- ning optikaseadmete detailid.
Oluline koht toodangus on lasertehnikal, mida turustatakse peamiselt välisriikides.
Kui keskmiselt saadi pool töötleva tööstuse müügitulust ekspordist, siis IKT sektori
tööstusettevõtted müüsid väljapoole Eestit neli viiendikku toodetest. IKT sektori
tööstustoodangu müük välismaale kasvatab ekspordi osatähtsuse IKT sektoris tervikuna
kõigi tegevusalade keskmisest suuremaks.
Ka IKT sektori teenindusettevõtted, mis põhiliselt on pakkunud oma teenuseid kodumaistele
tarbijatele, on hakanud leidma üha rohkem välismaiseid kliente – 2008. aastal müüdi
välismaale juba viiendik teenuseid. Määrav roll on selles telekommunikatsiooni- ja
programmeerimis- ning konsultatsiooniettevõtetel, kelle eksporditulu oli kolmveerand kogu
IKT sektori teenindusettevõtete eksporditulust. Olulisel määral on vähenenud info- ja
sidetehnika hulgimüük ekspordiks.
2008. aastal saadi kolmandik kogu IKT sektori müügitulust ekspordist. Poole üle 10 miljardi
krooni suurusest tulust andsid töötleva tööstuse ja teise poole teenindusettevõtted.
Joonis 3 IKT sektori ekspordi osatähtsus müügitulus, 2005–2008
Figure 3 Share of ICT sector’s exports in net sales, 2005–2008
%
90
80 Ettevõtlus kokku
Enterprises total
70
IKT sektor kokku
60
ICT sector total
50
40
30
20
10
0
2005 2006 2007 2008
%
90
Töötlev tööstus kokku
80 Manufacturing total
70 IKT sektori tööstus-
ettevõtted
60
ICT sector's manufacturing
50 enterprises
40 Teenindus kokku
Services total
30
IKT sektori teenindus-
20 ettevõtted
10 ICT sector's service
enterprises
0
2005 2006 2007 2008
INFOÜHISKOND INFORMATION SOCIETY 73
75.
IKT ETTEVÕTETE ARENGDEVELOPMENT OF ICT ENTERPRISES
IKT sektori Hoolimata sellest, et IKT sektori ettevõtteid on vaid 3% kõigist ettevõtetest ja nad annavad
tööviljakus 4% ettevõtete müügitulust, on nende panus lisandväärtuse loomisel kaks korda suurem –
6–7%. Seejuures luuakse pool kogu IKT sektori lisandväärtusest telekommunikatsiooni
tegevusalal.
2008. aastal toodeti IKT sektoris iga ettevõtluses hõivatu kohta lisandväärtust keskmiselt
292 000 krooni. IKT sektori ettevõtete tööviljakus on olnud märksa suurem kui kogu
ettevõtete sektori keskmine, ületades seda näitajat ligi kaks korda. IKT sektori suuremat
tööviljakust mõjutab enim kõrge tootlikkusega telekommunikatsiooni tegevusala, kus loodi
hõivatu kohta viis korda enam lisandväärtust kui ettevõtete sektoris keskmiselt ja ligi kolm
korda enam kui IKT sektori ettevõtetes keskmiselt. 2008. aastal loodi telekommunikatsiooni-
ettevõtetes lisandväärtust hõivatu kohta 1,5 miljonit krooni ehk ligi kümnendiku võrra rohkem
kui 2007. aastal.
IKT sektori tööstusettevõtete tööviljakus on kogu töötleva tööstuse tegevusala keskmisest
madalam – 2008. aastal oli see 10% väiksem. Kuigi IKT sektori tööstusettevõtete tööviljakus
kasvas aastatel 2005–2008 olulisel määral, on kogu töötleva tööstuse sektori areng olnud
kiirem.
Kui ettevõtete keskmine tööviljakuse kasvutempo, mis hakkas aeglustuma juba
2007. aastal, näitas 2008. aastal majanduskriisi tõttu langustendentsi, siis IKT sektorit kriis
ei mõjutanud. IKT sektori kasv jätkus ka 2008. aastal, eelkõige tänu tööstusettevõtete
tööviljakuse kasvule. IKT sektori teenindusettevõtete niigi suur tööviljakus on kasvanud
aeglasemalt. Pidurdanud on seda viimastel aastatel info- ja sidetehnika hulgimüügi
tegevusala ettevõtted, kelle tööviljakus on majanduskriisi ajal lisandväärtuse vähenemise ja
hõivatute arvu suurenemise tõttu langenud.
Joonis 4 IKT sektori tööviljakus, 2005–2008
Figure 4 Productivity in ICT sector, 2005–2008
Tuhat krooni
Thousand kroons
700
Ettevõtlus kokku
600 Enterprises total
500 IKT sektor kokku
ICT sector total
400
300
200
100
0
2005 2006 2007 2008
Tuhat krooni
700 Thousand kroons
Töötlev tööstus kokku
600 Manufacturing total
500 IKT sektori tööstus-
ettevõtted
400 ICT sector's manufacturing
enterprises
300 Teenindus kokku
Services total
200
IKT sektori teenindus-
100 ettevõtted
ICT sector's service
enterprises
0
2005 2006 2007 2008
IKT sektor IKT sektori suuruse mõõtmiseks kasutab OECD majandusnäitajate võrdluses põhiliselt
rahvusvahelises kahte näitajat – IKT sektori osatähtsus lisandväärtuse ja tööjõu järgi. Viimased
võrdluses võrdlusandmed on olemas aastate 2006–2007 kohta. Et Eesti varasemad OECD-le esitatud
andmed arvutati majanduse tegevusalade klassifikaatori vana versiooni (NACE Rev.1.1)
järgi ning uues klassifikaatoris (NACE Rev.2) on IKT sektori tegevusalade määratlemisel
olulisi erinevusi, erinevad tulemused eespool toodud Eesti andmetest (vt lisa artikli lõpus).
74 INFOÜHISKOND INFORMATION SOCIETY
76.
IKT ETTEVÕTETE ARENGDEVELOPMENT OF ICT ENTERPRISES
Lisandväärtuse osatähtsuse kohta on OECD-l olemas viimased andmed 2006. aastast ja
23 riigilt. IKT sektori tegevusalade lisandväärtus töötlevas tööstuses oli neis riikides
keskmiselt 7,2%. Eesti IKT sektori tööstusettevõtete panus lisandväärtuse loomisesse jäi
küll OECD riikide keskmisele alla, kuid erinevus ei olnud suur. Lisandväärtuse osatähtsus jäi
vaadeldud riikide seas 2,3% (Hispaania) ja 21,1% (Korea) vahele. Ka naaberriigis Soomes
kui ühes IKT liiderriigis annavad IKT sektori tööstusettevõtted viiendiku kogu töötleva
tööstuse lisandväärtusest. Mõlema mainitud, esirinnas oleva riigi näitajasse annavad
suurima panuse sideseadmete tootmise tegevusala ettevõtted.
Joonis 5 IKT tegevusalade lisandväärtuse osatähtsus töötlevas tööstuses, 2006
Figure 5 Share of ICT activities’ value added in manufacturing, 2006
Korea — Korea
Soome — Finland
Jaapan — Japan
Ungari — Hungary
Iirimaa — Ireland
Rootsi — Sweden
Ameerika Ühendriigid — United States of America
OECD keskmine — OECD average
Suurbritannia — United Kingdom
Eesti — Estonia
Austria — Austria
Saksamaa — Germany
Prantsusmaa — France
Taani — Denmark
Kanada — Canada
Norra — Norway
Itaalia — Italy
Holland — Netherlands
Sloveenia — Slovenia
Portugal — Portugal %
0 5 10 15 20 25
Allikas/Source: OECD
Teenindussektoris on näitajad ühtlasemad ja ka Eesti IKT sektori teenindusettevõtete
lisandväärtuse osatähtsus ei erine OECD riikide keskmisest. Arvestades nii IKT sektori
tööstus- kui ka teenindusettevõtete lisandväärtuse osatähtsust, oli OECD riikide IKT sektori
lisandväärtuse osatähtsus kogu ettevõtlussektoris keskmiselt 8,4%. Tänu IKT sektori
tööstusettevõtete märkimisväärsele tähtsusele oli kõrgeim näitaja Soomel – 14,8%.
Joonis 6 IKT tegevusalade lisandväärtuse osatähtsus teeninduses, 2006
Figure 6 Share of ICT activities’ value added in services, 2006
Iirimaa — Ireland
Sloveenia — Slovenia
Soome — Finland
Suurbritannia — United Kingdom
Soome — Sweden
Holland — Netherlands
Ungari — Hungary
Norra — Norway
Ameerika Ühendriigid — United States of America
OECD keskmine — OECD average
Taani — Denmark
Kanada — Canada
Itaalia — Italy
Prantsusmaa — France
Eesti — Estonia
Portugal — Portugal
Korea — Korea
Saksamaa — Germany
Austria — Austria
Jaapan — Japan %
0 2 4 6 8 10 12 14
Allikas/Source: OECD
INFOÜHISKOND INFORMATION SOCIETY 75
77.
IKT ETTEVÕTETE ARENGDEVELOPMENT OF ICT ENTERPRISES
IKT sektori suuruse mõõtmisel tööjõu andmete põhjal on OECD-s kasutusel kaks näitajat:
IT-spetsialistide osatähtsus ja IT-spetsialistide ning eri- ja tavakasutajate osatähtsus kogu
töötajaskonnas. 2007. aastal oli IT-spetsialistide osatähtsus kõige suurem Šveitsis ja
Rootsis – vastavalt 5,2% ja 4,9%. IT-spetsialistide ning eri- ja tavakasutajate ühisarvestuses
tõusis esikohale Luksemburg 30,6%-ga. Eesti asus 21,8%-ga pingerea keskel. Ainult
IT-spetsialistide osatähtsuse arvestuses oli Eesti 2,6%-ga tagasihoidlikul kohal, jäädes
liidritest kaugele ja edestades vaadeldud riikidest vaid Türgit, Kreekat ja Iirimaad.
76 INFOÜHISKOND INFORMATION SOCIETY
78.
IKT ETTEVÕTETE ARENGDEVELOPMENT OF ICT ENTERPRISES
DEVELOPMENT OF ENTERPRISES IN THE
INFORMATION AND COMMUNICATION
TECHNOLOGIES SECTOR
Tiina Pärson, Reet Nestor, Merike Põldsaar
Statistics Estonia
Definition of the Information and communication technologies (ICT) sector includes enterprises from
ICT sector manufacturing and service activities. The products of these enterprises are intended to fulfil
or enable the functioning of information processing and communication by electronic means,
including transmission and display. ICT sector’s manufacturing enterprises produce
electronic components and boards, computers and peripheral equipment, communication
equipment, consumer electronics, and magnetic and optical media. These are
manufacturing enterprises, the products of which are used in information processing and
communication by electronic means, including for transmission and display, or the products
of which use electronic processing for identification, measurement and/or saving of material
phenomena or for control of physical processes. ICT services sector includes activities that
are intended to enable the functioning of information processing and communication by
electronic means in the field of wholesale of information and communication equipment as
well as in the field of telecommunications and computer related activities.
The list of economic activities of ICT sector are defined by the Working Party on Indicators
a
for the Information Society in the Organisation for Economic Cooperation and Development
(OECD). Enterprises have been divided into groups by economic activity according to the
Estonian Classification of Economic Activities (EMTAK), which is based on the NACE
(Statistical Classification of Economic Activities in the European Community) Rev. 2 (see the
Annex at the end of the article).
The article presents financial data of ICT sector enterprises, which have been collected on
the basis of the official annual statistical questionnaire EKOMAR. Comparisons are drawn
between the data of ICT sector enterprises and all non-financial enterprises, ICT sector’s
manufacturing enterprises and enterprises of the whole manufacturing activity (EMTAK C),
ICT sector’s service enterprises and enterprises of the entire services activity. According to
EMTAK, services embrace the following activities: wholesale and retail trade, transport and
storage; accommodation and food service; information and communication; real estate
activity; professional, scientific and technical activity; administrative and support service
activities; and repair of computers and personal and household goods (G, H, I, J, L, M, N
and S95 in EMTAK).
Enterprises of ICT In 2008, there were 1,849 operating enterprises in the ICT sector in Estonia accounting for
sector merely 3% of all enterprises. ICT sector has increased by a third or by 470 enterprises
compared to 2005. Enlargement of enterprises’ operations to service activities is also
characteristic of ICT sector, which explains an increase in the total number of ICT
enterprises. In ICT sector, the number of manufacturing enterprises has remained more or
less the same during the years analysed — around 80 enterprises.
60% of the Estonian ICT sector enterprises provide computer programming or consultancy
services, computer facilities management and other information technology and computer
services. The enterprises providing computer programming services account for nearly a
third of ICT sector’s enterprises. Such services include, for example, designing of the
structure and content of software, and writing of the computer code necessary to create and
implement systems software and related software applications, databases or web pages, as
well as modifying, testing, supporting and customising of software so that it is functional
within the clients' information system environment. (Table 1)
Employment in There were almost 18,000 employees in ICT sector in 2008 which makes nearly 4% of the
ICT sector total number of employees in all enterprises. In parallel with an increase in the number of
enterprises, the number of employees has also increased in ICT sector’s service
enterprises. This number has increased by a third compared to the 2005. At the same time,
a
http://www.oecd.org/dataoecd/49/17/38217340.pdf
INFOÜHISKOND INFORMATION SOCIETY 77
79.
IKT ETTEVÕTETE ARENGDEVELOPMENT OF ICT ENTERPRISES
the number of persons employed in ICT sector’s manufacturing enterprises decreased
during the years under observation (Figure 1).
In 2008 a third of persons employed in ICT sector worked for manufacturing enterprises and
two thirds for service enterprises. Considerable changes have taken place during the last
four years – in 2005 the respective indicators were 45% in manufacturing and 55% in
services. A quarter of the whole work force in ICT sector is employed by enterprises of
computer programming activity. In this activity, the total number of employees grew more
than 1.5 times over four years.
On average ten employees worked in an ICT sector enterprise, which is a little bit more than
in an average Estonian enterprise. A noticeably large difference in terms of labour intensity
could be detected in manufacturing activities, where the average number of employees was
more than three times bigger than the average of all manufacturing enterprises – 77 and 22
persons, respectively. High employment in ICT sector’s manufacturing enterprises was
mainly influenced by large enterprises manufacturing communication equipment. Service
enterprises are typically with fewer employees. Telecommunication enterprises that usually
have a large number of employees are an exception in ICT sector.
The large number of service enterprises determines the overall structure of ICT sector by
size class of enterprise. Micro enterprises or enterprises with less than ten persons
employed make up 90% of ICT sector. With respect to manufacturing enterprises, small,
medium and large enterprises play an important role in ICT sector accounting for
approximately 40% all in all. (Figure 2)
Sale of ICT products In 2008, net sales of ICT sector amounted to over 30 billion kroons. Four fifths of this sum
and services was created by service and one fifth by manufacturing enterprises. The biggest net sales
were recorded in the telecommunications activity, the turnover of which made up almost a
half of the ICT sector service enterprises’ net sales and almost 40% of the total ICT sector
net sales.
In 2008 compared to 2007, the growth in ICT sector net sales slowed down, but was
nevertheless faster than in the whole enterprises sector. The growth was ensured by ICT
sector’s manufacturing enterprises, where the growth rate of net sales even accelerated. In
2008, ICT sector’s manufacturing enterprises sold 11% more production compared to the
year before, mainly due to producers of electronic components and communication
equipment. Increase in the net sales of ICT sector’s service enterprises remained more
modest in spite of a constant increase in the sales of telecommunication services – the
respective net sales were only by 1% bigger than in 2007.
Electronic components such as diodes, semiconductor devices, electronic integrated
circuits, loaded electronic boards and smart cards which are mainly sold to the external
market have a major proportion in the production of ICT sector’s manufacturing enterprises
in Estonia. The demand for electronic components has increased year by year, but the last
global crisis affected strongly also to the electronics industry, and as a result, lots of ICT
sector’s manufacturing enterprises had to reduce their volume of production as there was no
external demand. (Table 2)
The second major group of ICT production consists of computers, peripheral equipment and
communication equipment. Contrary to electronic components, the production of Estonian
computer industry is mainly addressed to the domestic market. A rapid increase in
producing computers started in the first half of 2000s and was especially fast during 2004–
2005 when production surpassed the threshold of 70,000 units. A steady increase continued
for the next three years. In 2009 the production of computers decreased substantially,
mainly due to an insufficient demand on the domestic market. (Table 3)
Besides electronic components, computers and communication equipment, the production
of ICT sector’s manufacturing enterprises includes also different parts and accessories of
sound and video equipment and optical instruments. Lasers – mostly sold to foreign
countries – also hold a remarkable place.
While, on average, a half of the manufacturing production net sales was received from
exports, then ICT sector’s manufacturing enterprises sold abroad four fifths of their
production. Exports of ICT sector’s manufacturing production increases the share of exports
in ICT sector as a whole over the average of all activities.
78 INFOÜHISKOND INFORMATION SOCIETY
80.
IKT ETTEVÕTETE ARENGDEVELOPMENT OF ICT ENTERPRISES
ICT sector’s service enterprises, which have mainly served domestic customers so far, have
also found more foreign clients, and in 2008 already a fifth of their services were sold
abroad. Thereby, a dominant role is held by telecommunications, computer programming
and consulting enterprises whose revenue from exports comprised two thirds of the total
revenue earned by ICT sector’s service enterprises from exports. Wholesale exports of
information and communication equipment have decreased to a considerable extent.
In 2008, a third of net sales in the whole ICT sector were obtained from exports. It was split
up equally — a half of the more than 10 billion kroons worth revenue was gained by ICT
manufacturing enterprises, and the second half by ICT service enterprises. (Figure 3)
Productivity of the ICT Irrespective of the fact that ICT sector’s enterprises account for only 3% of all enterprises
sector and give 4% of the net sales of all enterprises, their contribution to the creation of value
added is two times bigger i.e. 6–7%. Thereby, a half of ICT sector’s value added is created
by the telecommunications activity.
In 2008 the value added created per person employed in ICT sector comprised on average
292,000 kroons. In ICT sector, labour productivity has been remarkably higher than the
average of all enterprises, exceeding the respective indicator by nearly two times.
Telecommunications activity that is characterised by high productivity and where the created
value added was by five times bigger than the average indicator of all enterprises and by
nearly three times bigger than the average of an ICT enterprise has contributed the most to
the higher labour productivity of ICT sector. In 2008 the value added per person employed in
the telecommunications activity amounted to 1.5 million kroons, which was by nearly a tenth
more than in 2007.
Labour productivity in ICT sector’s manufacturing enterprises is lower than the average
indicator of the whole manufacturing activity — in 2008 it was 10% lower. Despite a
considerable increase in the labour productivity of ICT sector’s manufacturing enterprises
during 2005–2008, development of the whole manufacturing activity has been quicker.
Although the average growth rate of labour productivity of all enterprises, which started to
slow down already in 2007 and showed a falling trend in the conditions of economic
recession of 2008, ICT sector remained untouched by the crisis. Growth in ICT enterprises’
labour productivity continued also in 2008, mainly thanks to the growing labour productivity
of ICT manufacturing enterprises. Labour productivity in ICT sector’s service enterprises,
which had been at a high level already earlier, grew more slowly. In the last years, it was
hindered by wholesale of information and communication equipment where labour
productivity has decreased due to the decline in value added and concurrent increase in the
number of persons employed. (Figure 4)
ICT sector in To characterise the size of ICT sector, OECD uses two main indicators — share of ICT
international sector by value added and by employment – for comparing economic indicators. The latest
comparison information is available for 2006–2007. As earlier data on Estonia forwarded to OECD were
calculated according to the preceding version of classification of economic activities (NACE
Rev.1.1) and the new classification (NACE Rev. 2) considerably differs from the previous
one in terms of itemization of ICT sector’s activities, thus Estonia’s data in OECD
comparisons differ from the data used above (see the Annex at the end of the article).
The latest information about the proportion of value added available for OECD dates back to
2006 and concerns 23 countries. Value added of manufacturing among ICT sector’s
activities was on average 7.2% in these countries. In Estonia the contribution of ICT sector’s
manufacturing enterprises to the creation of value added remained lower than the average
of OECD countries, but the difference was not large. The indicator ranged from 2.3% in
Spain to 21.1% in Korea. Also in the neighbouring country Finland, that is considered one of
the leader countries in ICT, ICT sector’s manufacturing enterprises account for a fifth of the
whole value added of manufacturing. The most important activity in creation of value added
for both forefront countries mentioned is manufacture of communication equipment. (Figure
5)
In the services sector indicators are more even, and the proportion of value added of
Estonian ICT sector’s service enterprises does not differ from the average of OECD
countries either. Combining the proportions of both ICT sector’s manufacturing enterprises
and service enterprises, the percentage of ICT sector’s value added of OECD countries in
INFOÜHISKOND INFORMATION SOCIETY 79
81.
IKT ETTEVÕTETE ARENGDEVELOPMENT OF ICT ENTERPRISES
the whole enterprises sector was on average 8.4%. Finland announced the highest indicator
14.8% thanks to the high importance of ICT sector’s manufacturing enterprises. (Figure 6)
In measuring the size of ICT sector by labour force data, OECD uses two indicators — the
share of IT specialists and the share of IT specialists, advanced and basic users as a
percentage of total employment. According to the 2007 data, the share of IT specialists was
the highest in Switzerland and Sweden – 5.2% and 4.9%, respectively. By taking into
account, in addition to IT specialists, also advanced and basic users, the first position was
achieved by Luxembourg with its 30.6%. Estonia was in the middle of the ranking with its
21.8%. But, when only IT specialists were taken into account, then Estonia’s place in the
ranking remained modest — 2.6% and Estonia lagged behind the best countries and left
behind only Turkey, Greece and Ireland.
80 INFOÜHISKOND INFORMATION SOCIETY
82.
IKT ETTEVÕTETE ARENGDEVELOPMENT OF ICT ENTERPRISES
Lisa
Annex
IKT sektori tegevusalad EMTAK 2008 ja EMTAK 2003 järgi
ICT sector’s activities according to NACE Rev. 2 and NACE Rev 1.1
NACE EMTAK Tegevusala Kind of activity
Rev. 2 2008
IKT tegevusalad töötlevas tööstuses ICT activities in manufacturing
26.1 261 Elektronkomponentide tootmine ja trükkplaatide tootmine Manufacture of electronic components and boards
26.2 262 Arvutite ja arvuti välisseadmete tootmine Manufacture of computers and peripheral equipment
26.3 263 Sideseadmete tootmine Manufacture of communication equipment
26.4 264 Tarbeelektroonika tootmine Manufacture of consumer electronics
26.8 268 Magnet- ja optiliste andmekandjate tootmine Manufacture of magnetic and optical media
IKT tegevusalad teeninduses ICT activities in services
46.5 465 Info- ja sidetehnika hulgimüük Wholesale of information and communication equipment
46.51 4651 Arvutite, arvuti välisseadmete ja tarkvara hulgimüük Wholesale of computers, computer peripheral equipment
and software
46.52 4652 Elektroonika- ja telekommunikatsiooniseadmete ning Wholesale of electronic and telecommunications
nende osade hulgimüük equipment and parts
58.2 582 Tarkvara kirjastamine Software publishing
58.21 5821 Arvutimängude kirjastamine Publishing of computer games
58.29 5829 Muu tarkvara kirjastamine Other software publishing
61 61 Telekommunikatsioon Telecommunications
61.10 6110 Traatsideteenuste osutamine Wired telecommunications activities
61.20 6120 Traadita sideteenuste osutamine Wireless telecommunications activities
61.30 6130 Satelliitsideteenuste osutamine Satellite telecommunications activities
61.90 6190 Muu telekommunikatsioon Other telecommunications activities
62 62 Programmeerimine, konsultatsioonid jms tegevused Computer programming, consultancy and related
activities
62.01 6201 Programmeerimine Computer programming activities
62.02 6202 Arvutialased konsultatsioonid Computer consultancy activities
62.03 6203 Arvutisüsteemide ja andmebaaside haldus Computer facilities management activities
62.09 6209 Muud infotehnoloogia- ja arvutialased tegevused Other information technology and computer service
activities
63.1 631 Andmetöötlus, veebihosting jms tegevused; Data processing, hosting and related activities; web
veebiportaalide tegevus portals
63.11 6311 Andmetöötlus, veebihosting jms tegevused Data processing, hosting and related activities
63.12 6312 Veebiportaalide tegevus Web portals
95.1 951 Arvutite ja sideseadmete parandus Repair of computers and communication equipment
95.11 9511 Arvutite ja arvuti välisseadmete parandus Repair of computers and peripheral equipment
95.12 9512 Sideseadmete parandus Repair of communication equipment
NACE EMTAK Tegevusala Kind of activity
Rev 1.1 2003
IKT tegevusalad töötlevas tööstuses ICT activities in manufacturing
30 30 Kontorimasinate ja arvutite tootmine Manufacture of office machinery and computers
31.3 313 Kaabli ja isoleeritud juhtmete tootmine Manufacture of insulated wire and cable
32 32 Raadio-, televisiooni- ja sideseadmete ja -aparatuuri Manufacture of radio, television and communication
tootmine equipment and apparatus
33.2 332 Mõõte-, kontroll-, katse-, navigatsiooni- jms riistade ja Manufacture of instruments and appliances for
seadmete tootmine, v.a tootmisprotsesside juhtseadmed measuring, checking, testing, navigating and other
purposes, except industrial process control equipment
33.3 333 Tootmisprotsesside juhtseadmete tootmine Manufacture of industrial process control equipment
IKT tegevusalad teeninduses ICT activities in services
51.84 5184 Arvutite, arvuti välisseadmete ja tarkvara hulgimüük Wholesale of computers, computer peripheral equipment
and software
51.86 5186 Muude elektrooniliste osade ja seadmete hulgimüük Wholesale of other electronic parts and equipment
64.2 642 Telekommunikatsioon Telecommunications
71.33 7133 Kontorimasinate ja -seadmete rentimine, k.a arvutid Renting of office machinery and equipment, including
computers
72 72 Arvutiteenindus Computer and related activities
INFOÜHISKOND INFORMATION SOCIETY 81
83.
IKT EESTI VÄLISKAUBANDUSESICT IN FOREIGN TRADE OF ESTONIA
INFO- JA KOMMUNIKATSIOONITEHNOLOOGIA EESTI
VÄLISKAUBANDUSES
Riina Kerner
Statistikaamet
Info- ja kommunikatsioonitehnoloogia (IKT) kaupu võib määratleda kui tooteid, mis
säilitavad, edastavad või kuvavad andmeid ja informatsiooni elektrooniliselt.
Majanduskoostöö ja Arengu Organisatsioon (OECD) jaotas IKT kaubad kaubakoodide
alusel rühmadesse esimest korda 2003. aasta detsembris (Guide … 2009: 88). Samas
muutuvad need tooted ja rühmad kaubakoodide pideva vahetumise tõttu, sest tehnoloogia
edastamise võimalused arenevad tänapäeva üleilmastuvas maailmas kiiresti. Siinne
analüüs põhineb 2008. aastal OECD-s korrigeeritud IKT kaupade jaotusel
(Information … 2009: 7), milles need kaubad on jaotatud neljaks: kommunikatsiooni-
vahendid, arvutid ja arvuti välisseadmed, tarbeelektroonika ning muud IKT kaupade
komponendid ja tooted.
Analüüsides IKT kaubavahetuse aegridu, tuleb arvestada, et kaubavahetust on mõõdetud
jooksevhindades. Samal ajal on teada, et just IKT kaupade hinnad langevad kiiresti, kuid
samal ajal nende kvaliteet paraneb pidevalt. Seetõttu on IKT kaubavahetuse mõõtmine
raskendatud ning erineb suuresti tooraine ja teistesse kategooriatesse kuuluvate kaupade
mõõtmisest.
Eesti IKT kaubavahetus aastatel 2005–2009
Eestist eksporditi 2009. aastal IKT kaupu 5,1 miljardi krooni eest (5% Eesti koguekspordist).
IKT kaupu imporditi Eestisse 6,8 miljardi krooni eest (6% Eesti koguimpordist). Et eksport oli
impordist väiksem, tekkis IKT kaubavahetuses 1,7 miljardi kroonine puudujääk.
2009. aastal langes IKT kaupade ekspordi käive 2008. aastaga võrreldes 34% ehk
2,6 miljardi krooni võrra ja impordi käive 39% ehk 4,3 miljardi krooni võrra. IKT kaupade
ekspordi ja impordi käibe langus oli kiirem kui kogu Eesti kaubavahetuse oma – kogueksport
oli 2009. aastal 24% ja -import 34% väiksem kui aasta varem.
Ajavahemikus 2005–2009 oli IKT väliskaubanduse käive suurim 2005. aastal, kui eksport oli
üle kolme ja import üle kahe korra suurem kui 2009. aastal. IKT kaupade eksport oli
2005. aastal koguni 18% Eesti koguekspordist ja IKT kaupade import 14% koguimpordist.
IKT kaubavahetuse puhul on Eestis paljuski tegemist just kaupadega, mida imporditakse siia
töötlemiseks ja seejärel eksporditakse (allhanketegevus). Seega näitab IKT kaupade suur
osatähtsus 2005. aastal seda, et allhanketöödel oli Eesti kaubavahetuses pärast Euroopa
Liitu (EL) astumist oluline osa. Et 2009. aastal nende kaupade osatähtsus nii ekspordis kui
ka impordis vähenes, võib järeldada, et Eesti allhangete osatähtsus on märgatavalt
vähenenud kogu kaubavahetuses.
IKT kaubavahetuse puudujääk näitab hästi Eesti majanduse struktuurseid muutusi. 2005. ja
2006. aastal oli IKT kaubavahetuse puudujääk väike, sest enamik imporditud IKT kaupu
re-eksporditi Eestist pärast töötlemist. Aastatel 2007 ja 2008 puudujääk suurenes, seega
neil aastatel oli Eestis ka suurem sisenõudlus IKT kaupade järele. 2009. aastal IKT
kaubavahetuse puudujääk aga vähenes, mis tähendab, et nende kaupade sisemaine
tarbimine kahanes.
82 INFOÜHISKOND INFORMATION SOCIETY
84.
IKT EESTI VÄLISKAUBANDUSESICT IN FOREIGN TRADE OF ESTONIA
Joonis 1 Eesti IKT kaubavahetus, 2005–2009
Figure 1 Estonia’s trade in ICT goods, 2005–2009
Miljardit krooni
Billion kroons
20
IKT import
ICT imports
15
IKT eksport
ICT exports
10
5
0
IKT bilanss
ICT balance
-5
2005 2006 2007 2008 2009
Joonis 2 IKT kaupade osatähtsus Eesti kaubavahetuses, 2005–2009
Figure 2 Share of ICT goods in Estonia’s trade, 2005–2009
%
18
Eksport
16
Exports
14
12
Import
10 Imports
8
6
4
2
0
2005 2006 2007 2008 2009
Kommunikatsioonivahenditel (sh mobiiltelefonid ja nende osad) oli 2009. aastal Eesti IKT
kaupade ekspordis suurim osatähtsus – 72% (2005. aastal 89%). IKT kaupade impordis oli
suurim osatähtsus IKT kaupade komponentidel – 42% (2005. aastal 47%). IKT kaupade
impordis domineerivad IKT kaupade osad, mida imporditakse Eestisse kommunikatsiooni-
vahendite tootmiseks. Seega enamasti eksporditakse suurema lisandväärtusega
kommunikatsioonivahendeid ja imporditakse nende valmistamiseks vajaminevaid osasid.
Joonis 3 IKT kaupade eksport ja import, 2005 ja 2009
Figure 3 Exports and imports of ICT goods, 2005 and 2009
%
100
80
60
40
20
0
2005 2009 2005 2009
Eksport Eksport Import Import
Exports Exports Imports Imports
Muud IKT kaupade komponendid ja tarvikud Tarbeelektroonika
Miscellaneous ICT components and goods Consumer electronic equipment
Arvutid ja arvuti välisseadmed Kommunikatsioonivahendid
Computers and peripheral equipment Communication equipment
INFOÜHISKOND INFORMATION SOCIETY 83
85.
IKT EESTI VÄLISKAUBANDUSESICT IN FOREIGN TRADE OF ESTONIA
Joonis 4 Eesti IKT kaupade eksport, 2005–2009
Figure 4 Estonia’s exports of ICT goods, 2005–2009
Miljardit krooni
Billion kroons
16
Kommunikatsioonivahendid
14
Communication equipment
12
Tarbeelektroonika
10 Arvutid ja arvuti Consumer electronic
välisseadmed equipment
8 Computers and
6 peripheral equipment
4 Muud IKT kaupade
komponendid ja tarvikud
2 Miscellaneous ICT
0 components and goods
2005 2006 2007 2008 2009
Joonis 5 Eesti IKT kaupade import, 2005–2009
Figure 5 Estonia’s imports of ICT goods, 2005–2009
Miljardit krooni
Billion kroons
9
8 Muud IKT kaupade
komponendid ja tarvikud
7
Miscellaneous ICT Arvutid ja arvuti välisseadmed
6 components and goods Computers and peripheral
5 equipment
4
3 Kommunikatsioonivahendid
Communication equipment
2
Tarbeelektroonika
1
Consumer electronic
0 equipment
2005 2006 2007 2008 2009
Eesti IKT kaubavahetuse peamised partnerriigid
Eesti peamine partnerriik IKT kaupade ekspordis oli 2009. aastal Rootsi, kuhu läks 58%
eksporditud IKT kaupadest (ka 2008. aastal oli osatähtsus sama suur). Soome läks 8% ja
Lätti 5% eksporditud IKT kaupadest.
Eesti IKT kaupade eksport vähenes 2009. aastal eelneva aastaga võrreldes 34% ehk
2,6 miljardi krooni võrra, sh vähenes eksport Rootsi 33% (1,5 miljardi krooni võrra) ja Soome
54% (0,5 miljardi krooni võrra). Vaid eksport Ameerika Ühendriikidesse (USA) ja
Prantsusmaale suurenes 2009. aastal mõnevõrra.
Joonis 6 Eesti IKT kaupade ekspordi peamised partnerriigid, 2009
Figure 6 Estonia’s main partner countries for exports of ICT goods, 2009
Teised riigid
Hiina Other countries
China 15%
2%
Rootsi
Sweden
Saksamaa 58%
Germany
Venemaa Föderatsioon 3%
Russian Federation
3% Itaalia
Italy
3%
Ameerika Ühendriigid
United States of America
Läti
3%
Latvia
5%
Soome
Finland
8%
84 INFOÜHISKOND INFORMATION SOCIETY
86.
IKT EESTI VÄLISKAUBANDUSESICT IN FOREIGN TRADE OF ESTONIA
Eestisse imporditi IKT kaupu peamiselt samuti Rootsist (25% IKT kaupade koguimpordist
Eestisse), Soomest (14%) ja Lätist (10%). Kui IKT kaupade koguimport Eestisse vähenes
2008. aastaga võrreldes 39% (4,3 miljardi krooni võrra), siis IKT kaupade import Rootsist
vähenes 28% (0,7 miljardi krooni võrra) ning Soomest 41% (0,7 miljardi krooni võrra). Ligi
kaks korda vähenes IKT kaupade import Saksamaalt – 2008. aastal imporditi neid kaupu
Saksamaalt ühe miljardi, 2009. aastal aga 0,5 miljardi krooni eest.
Joonis 7 Eesti IKT kaupade impordi peamised partnerriigid, 2009
Figure 7 Estonia’s main partner countries for imports of ICT goods, 2009
Teised riigid
Other countries
24% Rootsi
Sweden
25%
Leedu
Lithuania
4%
Suurbritannia
United Kingdom Soome
4% Finland
Hongkong 14%
Hong Kong
5% Hiina Läti
China Saksamaa Latvia
6% Germany 10%
8%
IKT kaubavahetust peamiste partnerriikidega saab iseloomustada ka kaubavahetusbilansi
abil. Kui eksport sihtriiki on suurem kui import samast riigist, siis on tegemist kaubavahetuse
ülejäägiga, vastupidisel juhul aga puudujäägiga. Eesti IKT kaubavahetuse puudujääk
vähenes 2009. aastal varasema aastaga võrreldes ligi poole võrra. Kui 2008. aastal oli Eesti
IKT kaubavahetuse puudujääk 3,4 miljardit krooni, siis 2009. aastal 1,7 miljardit krooni.
Ainuke ülejääk oli Rootsiga peetud kaubavahetuses, teiste peamiste partnerriikidega tekkis
puudujääk. Suurim puudujääk oli Soomega peetud kaubavahetuses – Soome eksporditi
2009. aastal 0,6 miljoni krooni eest vähem kaupa, kui sealt imporditi.
Ka Rootsiga peetud kaubavahetuse ülejääk oli 2009. aastal IKT kaupade ekspordi üldise
vähenemise tõttu 2008. aasta omast väiksem. IKT kaupu eksporditi 2009. aastal Rootsi
3 miljardi krooni väärtuses, 2008. aastal aga 4,5 miljardi krooni eest. Samal ajal vähenes
nende toodete import Rootsist 0,7 miljardi krooni võrra, mistõttu kahanes ka Rootsiga
peetud IKT kaubavahetuse ülejääk (2,1 miljardist kroonist 2008. aastal 1,2 miljardi kroonini
2009. aastal).
2009. aastal vähenes IKT kaubavahetuse puudujääk võrreldes 2008. aastaga kõikide
peamiste partnerriikidega. See näitab, et vähenenud on nii siseturu nõudlus IKT kaupade
järele kui ka nende eksport peamistesse partnerriikidesse.
Joonis 8 Eesti IKT kaubavahetus peamiste partnerriikidega, 2009
Figure 8 Estonia’s trade in ICT goods with main partner countries, 2009
Rootsi — Sweden
Soome — Finland
Läti — Latvia
Saksamaa — Germany
Hiina — China
Ameerika Ühendriigid — United States of America
Eksport
Hongkong — Hong Kong Exports
Leedu — Lithuania
Import
Suurbritannia — United Kingdom Imports Miljonit krooni
Holland — Netherlands Million kroons
0 500 1000 1500 2000 2500 3000
INFOÜHISKOND INFORMATION SOCIETY 85
87.
IKT EESTI VÄLISKAUBANDUSESICT IN FOREIGN TRADE OF ESTONIA
Joonis 9 Eesti IKT kaubavahetusbilanss peamiste partnerriikidega, 2008 ja 2009
Figure 9 Estonia’s ICT goods trade balance with main partner countries, 2008 and 2009
Rootsi — Sweden
Holland — Netherlands Bilanss 2009
Balance 2009
Suurbritannia — United Kingdom
Bilanss 2008
Leedu — Lithuania
Balance 2008
Hongkong — Hong Kong
Ameerika Ühendriigid — United States of America
Hiina — China
Saksamaa — Germany
Läti — Latvia
Soome — Finland
Miljonit krooni
Riigid kokku — Countries total
Million kroons
-4000 -3000 -2000 -1000 0 1000 2000 3000
IKT kaupade eksport maailmas
IKT kaupade eksport näitab riigi võimekust eksportida suure lisandväärtusega kaupu, mis
tähendab, et nende toodete valmistamiseks on vaja teha märkimisväärseid kulutusi teadus-
ja arendustegevusele. Kui aastatel 1998–2002 olid peamised IKT kaupade eksportijad USA
ja Jaapan, siis 2003. aastal hakkas Hiina eksport oluliselt kasvama. Hiina IKT kaupade
eksport kasvas ligi 430 miljardi dollarini, mis on kolm korda suurem kui USA-s 2008. aastal.
Hiina IKT kaupade ekspordi järsk kasv on tingitud ka sellest, et paljud IKT ettevõtted on
viinud tootmise üle Hiinasse.
Joonis 10 Suurriikide IKT kaupade eksport, 1998–2008
Figure 10 Exports of ICT goods by major countries, 1998–2008
Miljardit USD
Billion USD
450
Hiina
400 China
350
300
250 Ameerika Ühendriigid
United States of
200 America
Jaapan
150
Japan
100
50 Saksamaa
Germany
0
1998 1999 2000 2001 2002 2003 2004 2005 2006 2007 2008
Allikas/Source: OECD
Põhjamaade riikidest olid suurimad IKT kaupade eksportijad Rootsi ja Soome. 2008. aastal
eksporditi IKT kaupu Rootsist 16,9 miljardi dollari eest ning Soomest 14,5 miljardi dollari
eest. Eesti eksport jäi neile ligi 20 korda alla. Ka Norra IKT kaupade eksport oli Eestiga
samal tasemel. Samal ajal suurenes Norra IKT kaupade eksport 2008. aastal eelneva
aastaga võrreldes ligi veerandi võrra, Eesti eksport aga jäi samaks. Järelikult jääb Eesti
Põhjamaadest maha nii IKT kaupade ekspordi käibe kui ka aastase juurdekasvu poolest.
86 INFOÜHISKOND INFORMATION SOCIETY
88.
IKT EESTI VÄLISKAUBANDUSESICT IN FOREIGN TRADE OF ESTONIA
Joonis 11 Põhjamaade IKT kaupade eksport, 1998–2008
Figure 11 Exports of ICT goods by Nordic Countries, 1998–2008
Miljardit USD
Billion USD
18
Rootsi
16
Sweden Soome
14 Finland
12
10
8 Taani
Denmark
6
4 Norra
2 Norway
Eesti
0
Estonia
1998 1999 2000 2001 2002 2003 2004 2005 2006 2007 2008
Allikas/Source: OECD
IKT kaupade eksport oli 2009. aastal 5% koguekspordist ja import 6% koguimpordist, seega
olid need märkimisväärselt väiksemad kui EL-i astumise algusaastatel. Et suur osa Eesti IKT
kaubavahetusest toimus allhangetega, näitab langus seda, et Eestis vähenes just
allhanketööde osatähtsus kaubavahetuses. 2009. aastal oli IKT kaupade ekspordis suurim
osa kommunikatsioonivahenditel (sh mobiiltelefonid) ja impordis IKT kaupade
komponentidel. See näitab, et eksporditakse märksa suurema lisandväärtusega kaupu, kui
imporditakse.
Märkimisväärselt on maailmas suurenenud IKT kaupade eksport Hiinast, mille tõttu on
suurriikide USA, Jaapani ja Saksamaa samade kaupade ekspordi käive püsinud viimasel
aastakümnendil samal tasemel. Põhjamaade riikide võrdluses on viimastel aastatel
kasvanud Rootsist, Soomest ja Norrast eksporditud IKT kaupade käive, kuid kahanenud
Taanist ja Eestist eksporditud kauba käive. Kuna IKT kaupade tootmiseks ja arendamiseks
kaasatakse nii teadus- kui ka arendustegevust, võib nende toodete eksporti pidada üheks
tootlikkuse kasvu tõukejõuks. Kui EL-i astumise algusaastatel eksporditi Eestist peamiselt
allhanke korras toodetud IKT kaupu, siis viimastel aastatel on eksporditud just valmistooteid
(sh tugijaamad ja mobiilsideseadmed). Seetõttu võib Eesti IKT kaupade ekspordist kujuneda
järgmistel aastatel oluline majanduse konkurentsivõimet suurendav tegur.
Metoodika
Eksport on kaupade väljavedu Eestist välisriiki ja import sissevedu Eestisse välisriigist
(mõlemad on arvestatud ilma teenuste ja transiidita).
Ekspordi ja impordi väärtused on arvestatud jooksevhindades.
IKT kaupade jaotamisel nelja rühma on lähtutud OECD metoodikast (korrigeeritud
2008. aastal).
OECD metoodikas kasutatakse väliskaubandusandmete avaldamisel üldkaubandus-, Eesti
metoodikas aga põhikaubandussüsteemi.
Üldkaubandussüsteem on väliskaubanduse arvestuse süsteem, mille puhul peale kaupade,
mis ületavad vaba ringluse piiri, võetakse arvesse ka kaupade sissevedu välisriikidest
tolliladudesse ja taasväljavedu tolliladudest.
Põhikaubandussüsteem on väliskaubanduse arvestuse süsteem, mille puhul võetakse
arvesse vabaringluse piiri ületavad kaubad.
IKT kaupade jaotamisel rühmadesse on kasutatud järgmisi kaupade klassifikaatori CPC
(Central Product Classification) kaubakoode (Information … 2009: 13–14):
1. kommunikatsioonivahendid – 46921, 47211, 47212, 47213, 47221, 47222, 47223,
47401;
2. arvutid ja arvuti välisseadmed – 45142, 45221, 45222, 45230, 45240, 45250,
45266, 45261, 45265, 45269, 45271, 45272, 45289, 45290, 47315, 47550;
INFOÜHISKOND INFORMATION SOCIETY 87
89.
IKT EESTI VÄLISKAUBANDUSESICT IN FOREIGN TRADE OF ESTONIA
3. tarbeelektroonika – 38581, 47214, 47215, 47311, 47312, 47313, 47314, 47321,
47323, 47330, 47402;
4. muud IKT komponendid ja tooted – 45281, 47130, 47140, 47150, 47160, 47173,
47403, 47530, 47540, 47590, 47910, 47920, 48315, 48354.
Allikad
Sources
Guide to measuring the information society, 2009. (2009). OECD [www]
http://www.oecd.org/dataoecd/25/52/43281062.pdf
Information Economy Product Definitions based on the Central Product Classification
(Version 2). Working Party on Indicators for the Information Society,
DSTI/ICCP/IIS(2008)1/REV1, Paris. (2009). [www]
http://www.oecd.org/dataoecd/16/46/42978297.pdf
OECD Factbook 2010. Economic, Environmental and Social Statistics. (2010). [www]
http://www.oecd-ilibrary.org/economics/oecd-factbook_18147364
88 INFOÜHISKOND INFORMATION SOCIETY
90.
IKT EESTI VÄLISKAUBANDUSESICT IN FOREIGN TRADE OF ESTONIA
INFORMATION AND COMMUNICATION TECHNOLOGY
IN FOREIGN TRADE OF ESTONIA
Riina Kerner
Statistics Estonia
Information and communication technology (ICT) goods can be defined as goods intended
to fulfil the function of information processing and communication by electronic means,
including transmission and display of data. Organisation for Economic Cooperation and
Development (OECD) launched the classification of ICT goods on the basis of the
commodity codes first in December 2003 (Guide … 2009; 88). At the same time, these
goods are described as commodities that are continuously changing due to the changing of
the commodity codes caused by the quick development of technology and possibilities of
transmitting information in the world of globalization. The following analysis is based on the
classification of ICT goods revised by OECD in 2008 (Information … 2009: 7), according to
which ICT goods are classified into four broad level categories: communication equipment,
computers and peripheral equipment, consumer electronic equipment and miscellaneous
ICT components and goods.
Analysing the time series of the trade in ICT goods, we have to keep in mind that trade has
been expressed at current prices, and that in the ICT sector prices tend to decrease rapidly,
at the same time the quality of traded goods improves steadily. This makes measurement of
the trade in ICT goods complicated and it differs a lot from the measurement of trade in raw
materials and other categories of goods.
Estonia’s trade in ICT goods in 2005–2009
Exports of ICT goods from Estonia amounted to 5.1 billion kroons in 2009 (5% of Estonia’s
total exports). Imports of ICT goods to Estonia amounted to 6.8 billion kroons (6% of
Estonia’s total imports). As imports exceeded exports, a deficit of 1.7 billion kroons was
registered in the trade in ICT goods.
In 2009 the turnover of exports of ICT goods decreased 34% or by 2.6 billion kroons and the
turnover of imports decreased 39% or by 4.3 billion kroons compared to 2008. The decline
in the turnover of ICT goods exports and imports was faster than that of Estonia’s trade as a
whole – in 2009, total exports decreased by 24% and total imports by 34% compared to the
previous year.
During the period 2005–2009, the biggest turnover of foreign trade in ICT goods was
announced in 2005, when exports exceeded the value of 2009 exports by more than
threefold and imports – by more than twofold. Exports of ICT goods made up as much as
18% of Estonia’s total exports and imports of ICT goods comprised 14% of total imports in
2005. Trade in ICT goods in Estonia’s context mainly involves importing of goods to Estonia
for processing purposes and thereafter exporting of them from Estonia (contractor works).
So, a large proportion of ICT goods in 2005 indicates that contractor works comprised a
large share in Estonia’s trade after accession to the European Union (EU). As the
percentage of these goods decreased in exports as well as in imports in 2009, it may be
concluded that the share of contractor works has notably decreased in total trade.
Deficit in the trade of ICT goods well describes the structural changes taking place in
Estonia’s economy. The trade deficit was small in 2005 and 2006 since the majority of
imported ICT goods were re-exported from Estonia after processing. Trade deficit increased
in 2007 and 2008 causing an increased demand for ICT goods in Estonia’s internal market.
But in 2009, trade deficit of ICT goods decreased indicating that local demand for ICT goods
was in decline. (Figures 1 and 2)
The biggest share in Estonia’s exports of ICT goods was held by communication equipment
(incl. mobile phones and their parts) in 2009 – 72% (89% in 2005). The biggest share or
42% of ICT imports was held by miscellaneous ICT components and goods (47% in 2005).
Components that are imported into Estonia and used for production of communication
equipment form a dominant share in the imports of ICT goods. Thus, communication
INFOÜHISKOND INFORMATION SOCIETY 89
91.
IKT EESTI VÄLISKAUBANDUSESICT IN FOREIGN TRADE OF ESTONIA
equipment with higher value added is mostly exported and parts (and details) necessary for
producing such equipment are mostly imported. (Figures 3, 4 and 5)
Estonia’s main partner countries in ICT goods trade
In 2009, Sweden was Estonia’s main destination country of ICT goods exports taking the
share of 58% of Estonia’s ICT goods exports (the proportion was the same also in 2008).
Exports to Finland comprised 8% and exports to Latvia 5% of Estonia’s ICT goods exports.
In 2009, exports of ICT goods from Estonia decreased 34% or by 2.6 billion kroons
compared to 2008. Thereby, exports to Sweden decreased 33% (by 1.5 billion kroons) and
to Finland – 54% (by 0.5 billion kroons). Exports of ICT goods increased slightly only to the
USA and France. (Figure 6)
Main countries of consignment of ICT goods were Sweden (25% of ICT goods imports to
Estonia), Finland (14%) and Latvia (10%). While imports of ICT goods to Estonia declined
39% (by 4.3 billion kroons) compared to 2008, imports from Sweden declined 28% (by 0.7
billion kroons) and imports from Finland – 41% (by 0.7 billion kroons). Imports of ICT goods
from Germany declined nearly two times – in 2009 imports of ICT goods from Germany
amounted to 0.5 billion kroons compared to 1 billion kroons in 2008. (Figure 7)
Trade in ICT goods with main partner countries can also be characterised by trade balance.
When exports to the country of destination exceed imports from the same country, surplus is
registered, and when the opposite is true – then deficit. Estonia’s trade deficit in ICT goods
decreased almost twice in 2009 compared to 2008. When in 2008 the ICT goods deficit was
3.4 billion kroons, then in 2009 it decreased to 1.7 billion kroons. Surplus was registered in
the trade with Sweden only. Deficit was registered regarding trade with all other main
partner countries. The biggest deficit was mentioned in the trade with Finland – imports from
Finland exceeded exports to Finland by 0.6 billion kroons.
Surplus with Sweden also decreased in 2009 due to an overall decline in ICT goods exports
compared to 2008. The value of ICT goods exported to Sweden amounted to
3 billion kroons in 2009 compared to 4.5 billion kroons in 2009. At the same time, imports of
the given goods from Sweden decreased by 0.7 billion kroons. Therefore, trade surplus with
Sweden also decreased (from 2.1 billion kroons in 2008 to 1.2 billion kroons in 2009).
In 2009 compared to 2008, ICT trade deficit decreased with respect to all main partner
countries of Estonia. This shows that both, the internal market demand for ICT goods as well
as exports of these goods to main partner countries, have decreased. (Figures 8 and 9)
Exports of ICT goods in the world
Exports of ICT goods describes a country’s capacity to export goods with high value added,
which means that, in the manufacturing of such goods, notable costs have to be made on
research and development. While in 1998–2002 the main exporters of ICT goods were the
USA and Japan, then in 2003 Chinese exports of ICT goods started to increase significantly.
Chinese exports of ICT goods amounted to nearly 430 billion dollars which is three times
more than in the USA in 2008. A sharp increase in Chinese exports of ICT goods was also
influenced by the fact that lots of ICT companies have relocated their production facilities to
China. (Figure 10)
The biggest exporters of ITC goods among Nordic Countries were Sweden and Finland.
Exports of ICT goods from Sweden amounted to 16.9 billion dollars and from Finland to
14.5 billion dollars (in value) in 2008. The turnover of ICT goods exports from Estonia was
by 20-fold smaller. Norway’s exports of ICT goods stood at the same level as Estonia’s
exports of ICT goods. At the same time, exports of ICT goods from Norway increased by
nearly a quarter, but Estonia’s exports remained the same in 2008 compared to the previous
year. Consequently, Estonia remains behind Nordic Countries in terms of export turnover of
ICT goods as well as annual growth in exports. (Figure 11)
In 2009, exports of ICT goods comprised 5% of total exports and imports accounted for 6%
of total imports i.e. both were significantly smaller compared to the first years after accession
to the EU. As Estonia’s ICT trade had mostly consisted of contractor works at that time, such
90 INFOÜHISKOND INFORMATION SOCIETY
92.
IKT EESTI VÄLISKAUBANDUSESICT IN FOREIGN TRADE OF ESTONIA
a decrease shows that the share of contractor works has decreased significantly in total
trade. In 2009, the biggest share in the exports of ICT goods was held by communication
equipment (incl. mobile phones), and in the imports of ICT goods – by ICT components. This
indicates that goods with noticeably higher value added are rather exported than imported.
Globally, Chinese exports of ICT goods have significantly grown; due to this the turnover of
ICT goods exports has remained at the same level in the USA, Japan and Germany over the
last decade. In the comparison of Nordic Countries, the turnover of ICT goods exports has
increased in Sweden, Finland and Norway over the last years, but decreased in Denmark
and Estonia. Production of ICT goods involves the field of research and development,
therefore exports of these goods can be regarded one of the driving factors of productivity.
As during the first years of Estonia’s accession to the EU, Estonia exported mainly ICT
goods produced under contract, then during the last years exports of ICT goods has
consisted mainly of finished products (incl. telephones for cellular networks and base
stations). Thus, exports of Estonia’s ICT goods will probably constitute a significant factor
enhancing the competitiveness of economy during the coming years.
Methodology
Exports are dispatches of goods from Estonia to a foreign country, and imports – arrivals of
goods in Estonia from a foreign country (both are calculated without taking services and
transit into account).
The values of exports and imports are calculated at current prices.
OECD methodology (revised in 2008) has been used for classifying ICT goods into four
subgroups.
In the OECD methodology, dissemination of foreign trade data is based on the general trade
system, whereas in Estonia’s methodology – on a special trade system.
General trade system is a system of compiling foreign trade statistics which takes into
account, in addition to goods crossing the boundary of the free circulation area, also goods
imported from abroad into customs warehouses and goods re-exported from customs
warehouses.
Special trade system is a system of compiling foreign trade statistics which takes into
account goods crossing the boundary of the free circulation area.
Distribution of ICT goods into subgroups is based on the following CPC (Central Product
Classification) commodity codes (Information … 2009: 13–14:
1. communication equipment – 46921, 47211, 47212, 47213, 47221, 47222, 47223, 47401
2. computers and peripheral equipment – 45142, 45221, 45222, 45230, 45240, 45250,
45266, 45261, 45265, 45269, 45271, 45272, 45289, 45290, 47315, 47550;
3. consumer electronic equipment – 38581, 47214, 47215, 47311, 47312, 47313, 47314,
47321, 47323, 47330, 47402;
4. miscellaneous ICT components and goods – 45281, 47130, 47140, 47150, 47160,
47173, 47403, 47530, 47540, 47590, 47910, 47920, 48315, 48354.
INFOÜHISKOND INFORMATION SOCIETY 91

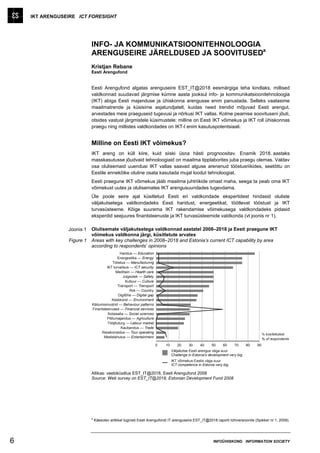
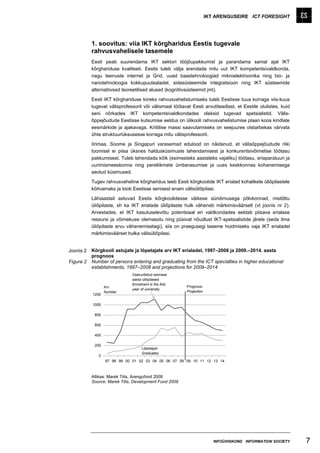
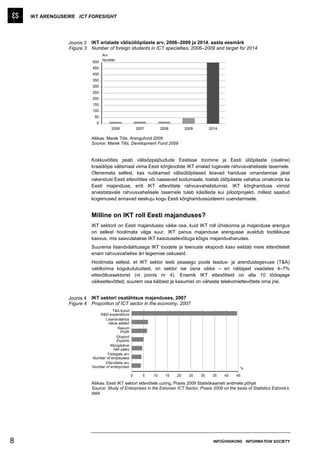
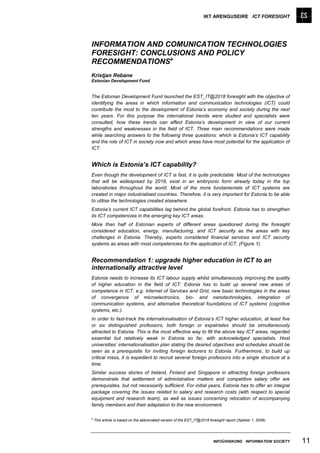
![INFOÜHISKONNA ARENDAMISEST EESTIS DEVELOPMENT OF INFORMATION SOCIETY IN ESTONIA
Rakendusplaanides on kirjas konkreetsed tegevused koos vastutajate ja hinnangulise
eelarvega. 2010.–2011. aasta rakendusplaani prioriteedid on
inimeste teadmiste, oskuste ja osalusvõimaluste suurendamine,
Eesti uue põlvkonna lairibavõrgu arendamine,
e-ärikeskkonna arendamine,
avalike teenuste, sh infoteenuste arendamine,
eID ehk elektroonilise identiteedi laiaulatuslik kasutuselevõtt,
riigi infosüsteemide koosvõime suurendamine, sh süsteemide täiustamine ja
andmete korrastamine.
Infotehnoloogia (IT) ei ole eesmärk omaette, vaid vahend, mis aitab tõsta eri
eluvaldkondade toimimise taset. Sestap peab IT olema läbiv teema kõigi valdkondade
poliitikadokumentides. Infoühiskonna arengukava näeb ette, et valitsusasutused arvestavad
oma arengukavade koostamisel ja täiendamisel infoühiskonna arengukava põhimõtteid, ning
määrab kindlaks nende eesmärkide saavutamiseks vajalikud tegevused. Seega on
infoühiskonna arengukava vastastikku toetav näiteks selliste arengukavadega nagu „Eesti
ettevõtluspoliitika 2007–2013”, teadus- ja arendustegevuse strateegia „Teadmistepõhine
Eesti 2007–2013” (eelkõige selle raames välja töötatud IKT programm), kuid on seotud ka
paljude teiste strateegiatega, nagu „Õppiv tiiger”, „Digitaalne kultuuripärand” jt.
Peale infoühiskonna arengukava on oluline riigi infopoliitika kujundamist käsitlev dokument
a
ka „Riigi IT koosvõime raamistik” . Koosvõime raamistik koos sellest tulenevate
dokumentidega kirjeldab, kuidas liita avaliku sektori infosüsteemid ühtseks tervikuks ja
kuidas need koos erasektori infosüsteemidega toetavad riigi ümberkorraldamist
infoühiskonna tingimustele vastavaks. Lühemalt ja konkreetsemalt öeldes on koosvõime
raamistiku eesmärk muuta Eesti avaliku sektori tegevus efektiivsemaks, parandades Eesti ja
EL-i elanikele ja ärisektorile pakutavate teenuste kvaliteeti. Raamistik luuakse koostöös
avaliku ja erasektoriga ning selle järgimine on kohustuslik kõigile avaliku sektori asutustele.
Koosvõime raamistiku dokumendid käsitlevad järgmisi teemasid: semantiline koosvõime,
infoturbe koosvõime, tarkvara ja veebide koosvõime, dokumendihalduse koosvõime, avatud
standardid, riigi infosüsteemi arendusprotsessi kirjeldus, riigi IT arhitektuur ja
infrastruktuuriteenused.
Nagu eespool toodud ülevaatest järeldada võib, on infoühiskonna arendamise
koordineerimine Eestis üsna detsentraliseeritud. Riigi infopoliitika arendamise
koordineerimise eest vastutab Majandus- ja Kommunikatsiooniministeeriumi riigi
infosüsteemide osakond ning ametkondadeüleseid projekte valmistab ette ja rakendab Riigi
Infosüsteemide Arenduskeskus. Suures osas aga võivad riigi- ja omavalitsusasutuste
IT-juhid infosüsteemide arendamist puudutavad otsused ise teha, lähtudes üldistest
kokkulepitud prioriteetidest. Samal ajal on nii Eestis kui ka mujal maailmas märgata
suuremat tsentraliseerimistendentsi.
Et tagada avaliku sektori koordinatsioon era- ja kolmanda sektori organisatsioonidega, on
Majandus- ja Kommunikatsiooniministeeriumi ja kolmanda sektori vahel loodud
informaatikanõukogu, mida juhib majandus- ja kommunikatsiooniminister. Nõukogu
ülesanne on nõustada valitsust infoühiskonna küsimustes. Peale selle toimub pidev ja tihe
koostöö kolmanda sektori organisatsioonidega, näiteks Eesti IKT ettevõtteid koondava Eesti
Infotehnoloogia ja Telekommunikatsiooni Liidu, e-valitsuse ja infoühiskonna kompetentsi-
keskuse e-Riigi Akadeemia, Eesti Infotehnoloogia Sihtasutuse jt-ga.
Allikas
Source
Praust, V. (1998). Infoühiskond ja selle teetähised. – Infotehnoloogia haldusjuhtimises.
Aastaraamat 1998. [www] http://www.riso.ee/et/pub/1998it/12.htm
a
http://www.riso.ee/et/koosvoime/raamistik
16 INFOÜHISKOND INFORMATION SOCIETY](https://image.slidesharecdn.com/infohiskond-101223010103-phpapp01/85/Infouhiskond-17-320.jpg)
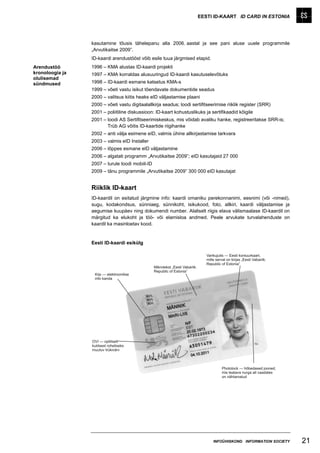
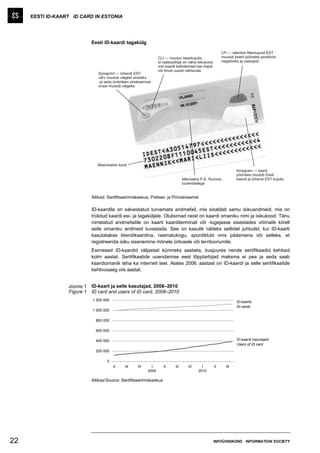
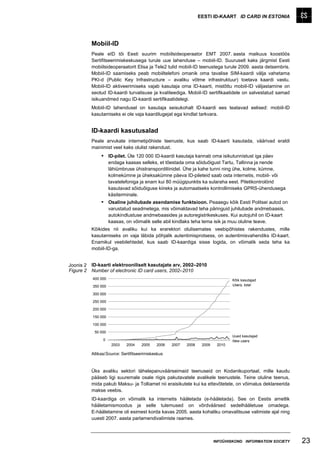
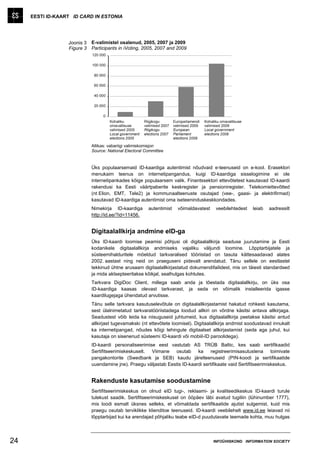
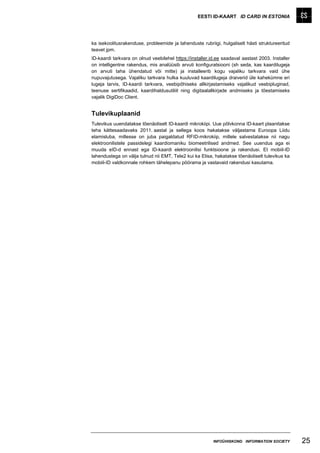
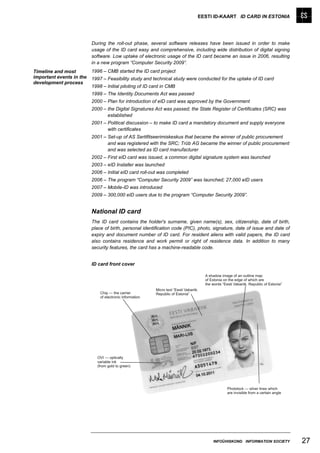
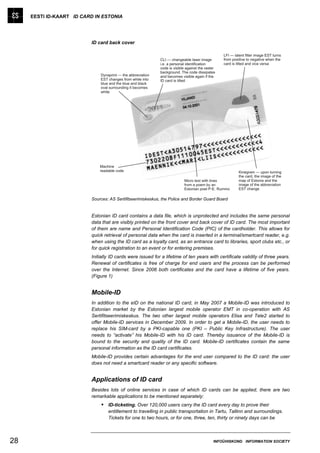
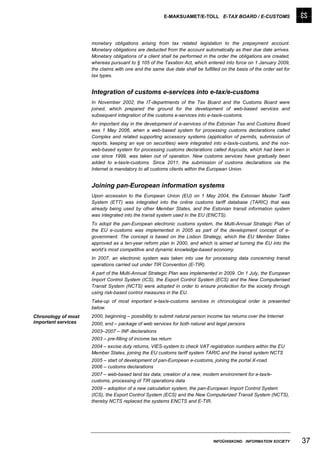
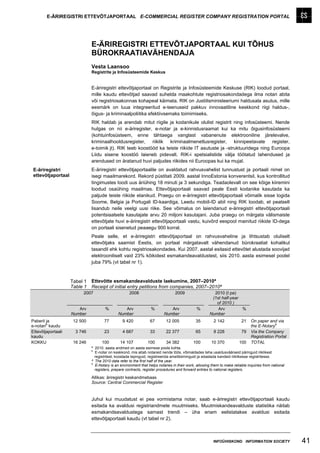
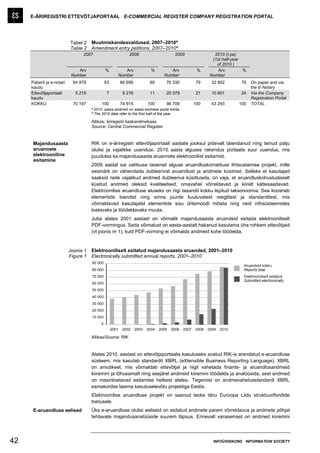
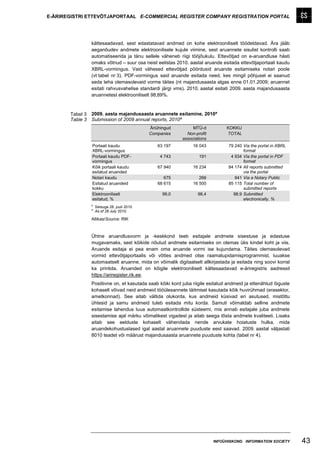
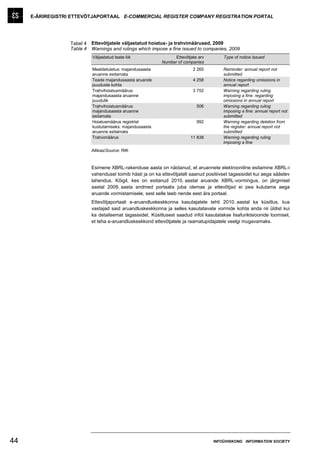
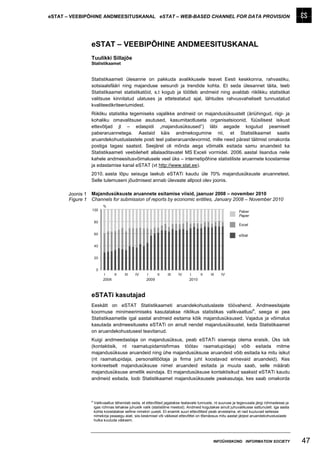
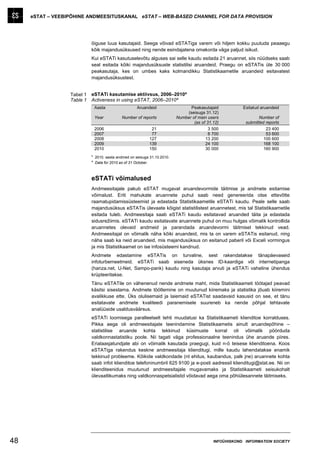
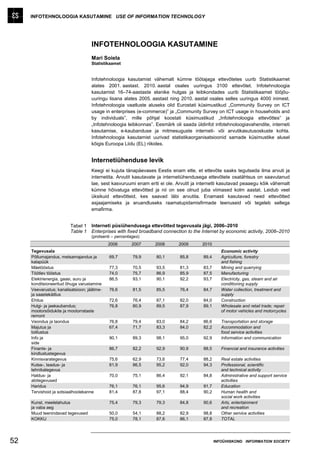
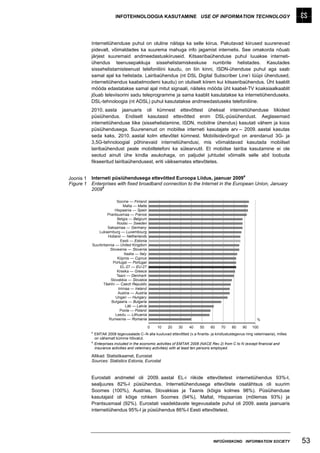
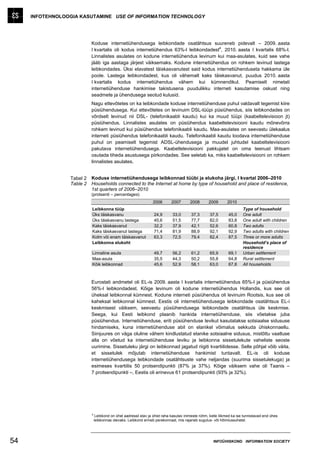
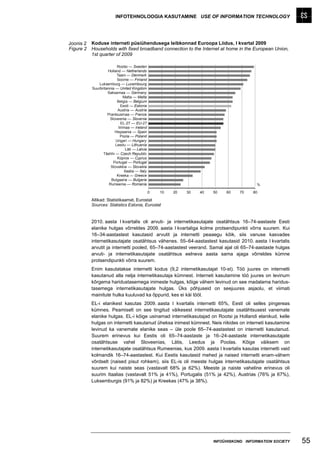
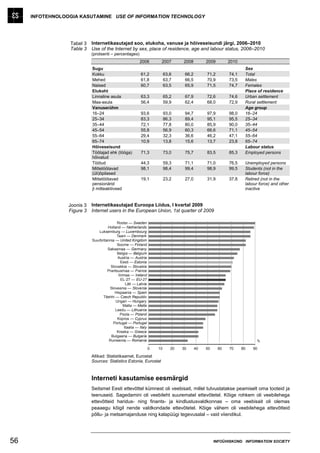
![INFOTEHNOLOOGIA KASUTAMINE USE OF INFORMATION TECHNOLOGY
oma riigi ettevõtetelt, veidi vähem teistest EL-i riikidest ja kõige vähem väljastpoolt EL-i. Vaid
Küprose, Malta ja Luksemburgi ettevõtete hulgas oli rohkem neid, kes tegid interneti kaudu
oste EL-ist, kui neid, kes ostsid oma riigist.
Kaupu ja teenuseid müüs (rohkem kui 1% müügitulust) 2008. aastal interneti kaudu nii Eesti
kui ka EL-i ettevõtetest iga kümnes. Suuremate ettevõtete hulgas oli oma kaupu ja
teenuseid interneti kaudu müünuid rohkem kui väiksemate ettevõtete seas. Tegevusalati oli
kõige rohkem interneti kaudu müünud ettevõtteid nii Eestis kui ka EL-is majutusettevõtete ja
reisiteenuste pakkujate hulgas. Interneti teel kaupu või teenuseid müünud ettevõtteid oli
kõige rohkem Hollandis, Belgias ja Rootsis ning kõige vähem Rumeenias ja Bulgaarias.
EL-i elanikest on interneti kaudu oste teinud üle kolmandiku, Eesti elanikest kuuendik. Kõige
usinamalt tegid 2008. aastal EL-is interneti kaudu oste Suurbritannia elanikud (kaks
kolmandikku), järgnesid Taani, Holland ja Rootsi. Kõige vähem tegid interneti kaudu oste
Rumeenia ja Bulgaaria elanikud. EL-i elanikud ostsid interneti kaudu kõige rohkem reisi- ja
majutusteenuseid, Eestis ürituste pileteid. Kõige rohkem osteti oma riigist, järgnesid teised
EL-i riigid, vähem osteti väljastpoolt EL-i.
Need Eesti elanikud, kes ei ole interneti kaudu oste teinud, nimetasid üheksal juhul kümnest
põhjusena vajaduse puudumist ja kaheksal juhul kümnest eelistust osta kaupa poest, et
seda oma silmaga näha. Neljandik pidas probleemiks turvariske ja sobimatu kauba
tagastamisega seotut.
Allikas
Source
Eurostati andmebaas. (2010). [e-andmebaas]
http://epp.eurostat.ec.europa.eu/portal/page/portal/information_society/data/database
(01.11.2010)
58 INFOÜHISKOND INFORMATION SOCIETY](https://image.slidesharecdn.com/infohiskond-101223010103-phpapp01/85/Infouhiskond-59-320.jpg)
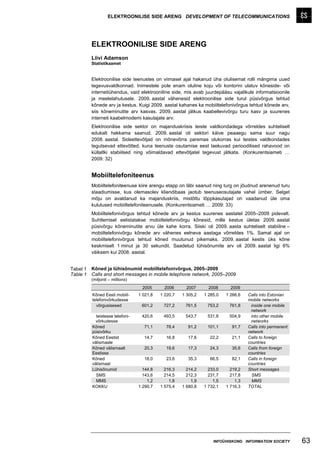
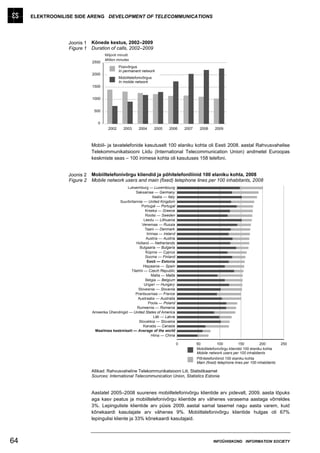
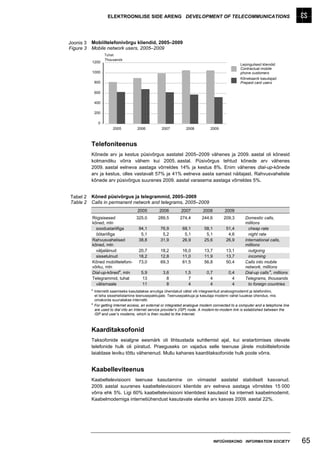
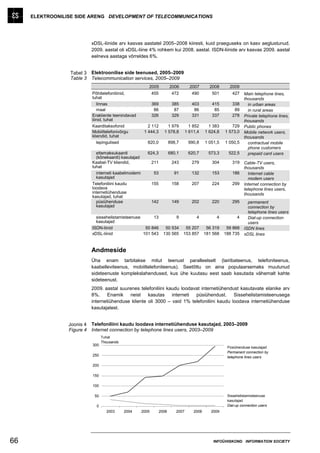
![ELEKTROONILISE SIDE ARENG DEVELOPMENT OF TELECOMMUNICATIONS
Konkurentsiameti hinnangul pakub fikseeritud andmesidele üha enam konkurentsi mobiilne
lairibaühendus, kuna selle teenuse hinnad ja ühenduskiirused on võrreldavad või kohati
isegi paremad kui fikseeritud andmesideühenduse hinnad. Täielikku asendatavust
takistavad veel mahupiirangud ja ühenduskiiruse kvaliteedi tagamine. (Konkurentsiameti …
2009: 35)
Üha enam kasutatakse ka elektroonilist kirjavahetust ja internetisuhtlust. Seetõttu väheneb
kirjade saatmine aasta-aastalt ja postiteenuseid kasutatakse üha vähem.
Joonis 5 Väljastatud kirisaadetised ja telefonikõned, 2002–2009
Figure 5 Outgoing letters and telephone calls, 2002–2009
Miljonit kirisaadetist Miljonit kõnet
100 Million outgoing letters Million calls
2500
90 2250
80 2000
70 1750
60 1500
50 1250
40 1000
30 750
20 500
10 250
0 0
2002 2003 2004 2005 2006 2007 2008 2009
Väljastatud kirisaadetised Kõned
Outgoing letters Calls
Niisiis iseloomustas elektroonilise side turgu 2009. aastal telefoniteenuse mahtude
vähenemine, mobiiltelefoniteenuse ja kaabelleviteenuse mahtude stabiliseerumine ning
andmesideteenuse kasutajate arvu kasv.
Allikas
Source
Konkurentsiameti aastaraamat 2009. (2009). [www]
http://www.konkurentsiamet.ee/public/AASTARAAMAT_2009.pdf
INFOÜHISKOND INFORMATION SOCIETY 67](https://image.slidesharecdn.com/infohiskond-101223010103-phpapp01/85/Infouhiskond-68-320.jpg)
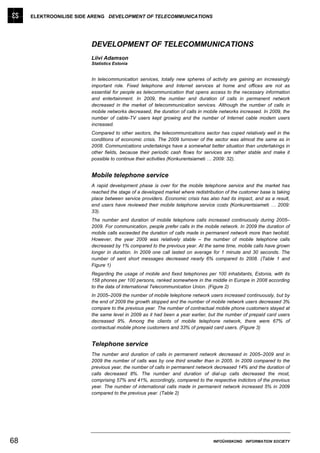
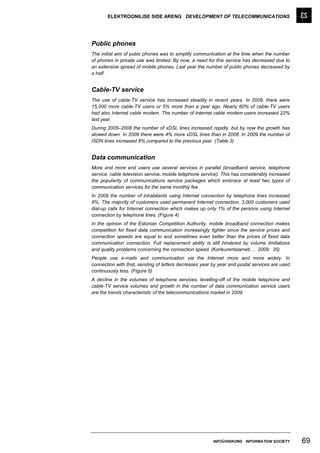
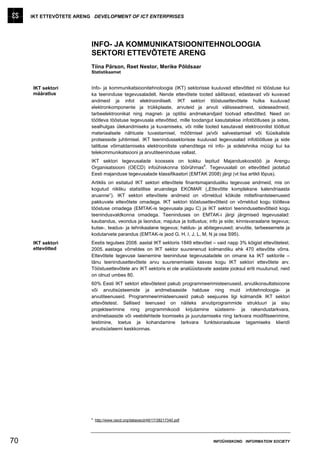
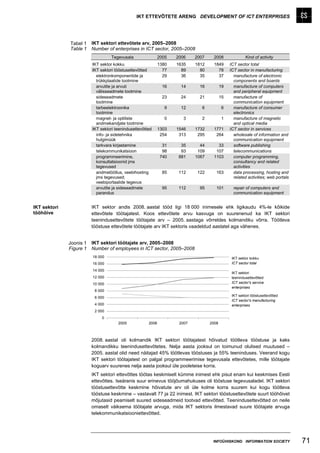
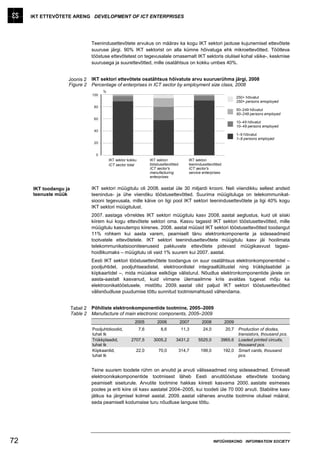
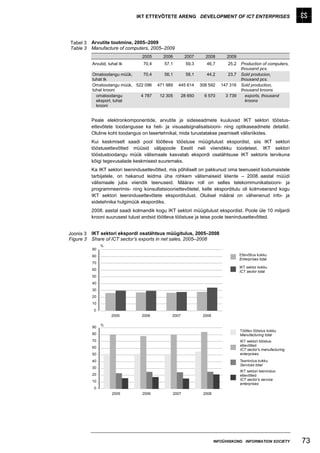
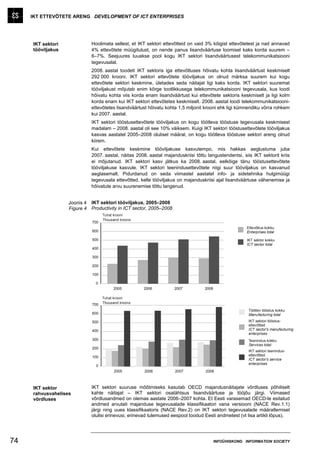
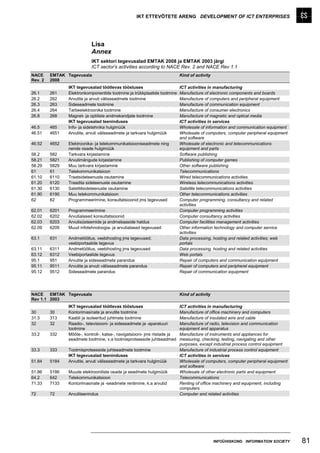
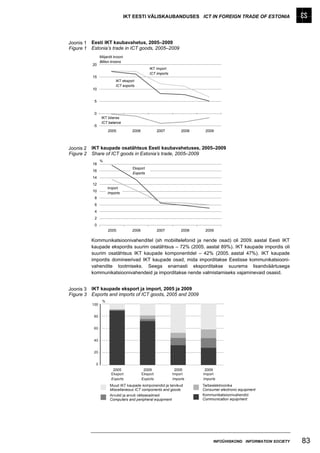
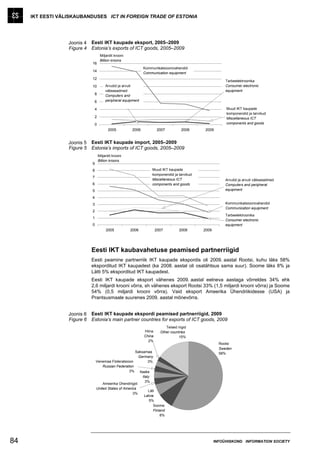
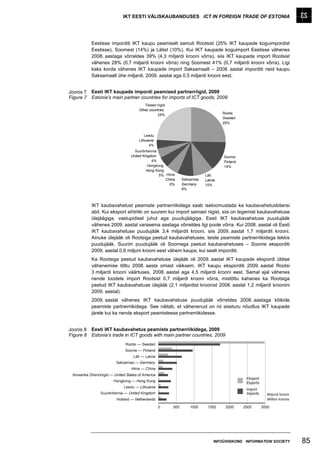
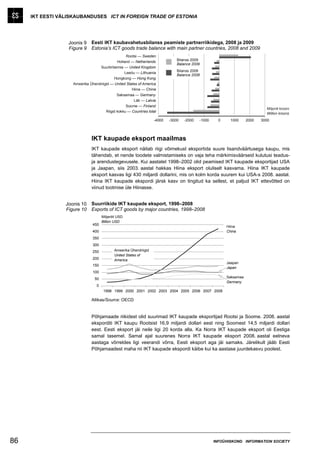
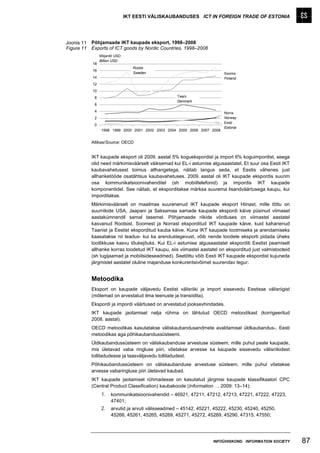
![IKT EESTI VÄLISKAUBANDUSES ICT IN FOREIGN TRADE OF ESTONIA
3. tarbeelektroonika – 38581, 47214, 47215, 47311, 47312, 47313, 47314, 47321,
47323, 47330, 47402;
4. muud IKT komponendid ja tooted – 45281, 47130, 47140, 47150, 47160, 47173,
47403, 47530, 47540, 47590, 47910, 47920, 48315, 48354.
Allikad
Sources
Guide to measuring the information society, 2009. (2009). OECD [www]
http://www.oecd.org/dataoecd/25/52/43281062.pdf
Information Economy Product Definitions based on the Central Product Classification
(Version 2). Working Party on Indicators for the Information Society,
DSTI/ICCP/IIS(2008)1/REV1, Paris. (2009). [www]
http://www.oecd.org/dataoecd/16/46/42978297.pdf
OECD Factbook 2010. Economic, Environmental and Social Statistics. (2010). [www]
http://www.oecd-ilibrary.org/economics/oecd-factbook_18147364
88 INFOÜHISKOND INFORMATION SOCIETY](https://image.slidesharecdn.com/infohiskond-101223010103-phpapp01/85/Infouhiskond-89-320.jpg)