Download to read offline
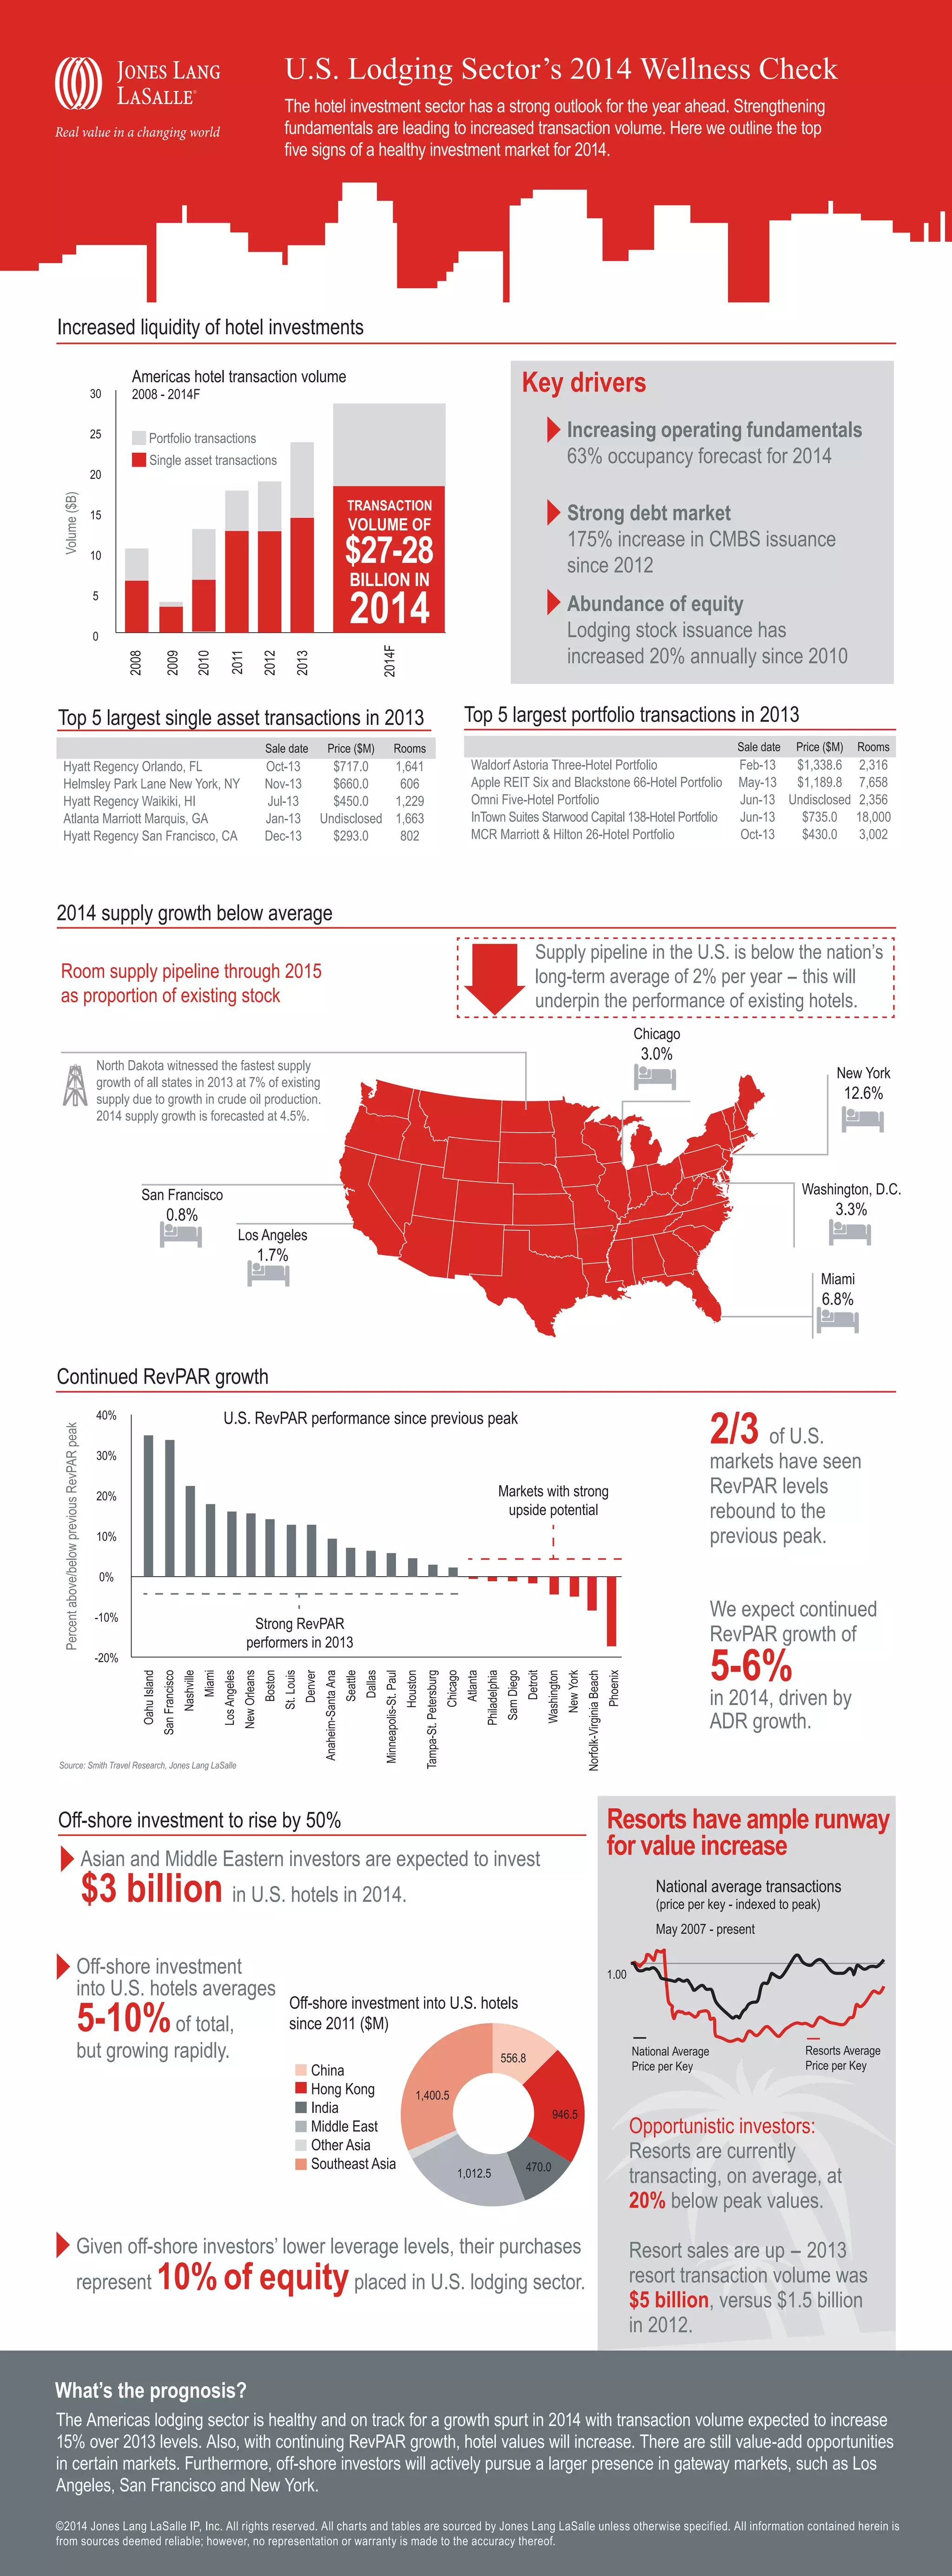

The U.S. lodging sector is projected to experience significant growth in 2014, with increased transaction volumes and strong operating fundamentals. A forecasted RevPAR growth of 5-6% in 2014, alongside a rise in offshore investments expected to reach $3 billion, indicates a robust market with ongoing opportunities for value increases. The supply growth remains below the long-term average, further supporting the performance of existing hotels.