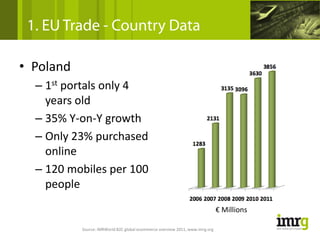
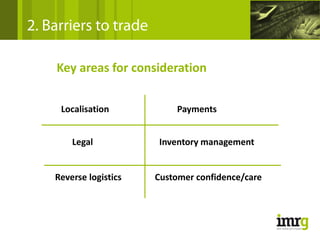
1. The document discusses opportunities for international growth in e-commerce. It summarizes current EU trade values and growth rates across countries. Barriers to cross-border trade include localization, payments, legal issues, and inventory management.
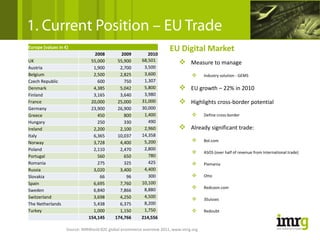
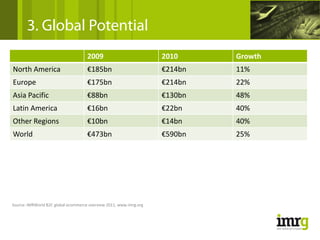
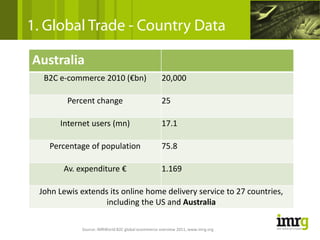
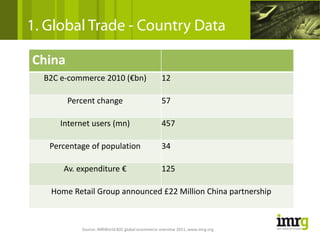
2. Global e-commerce is growing rapidly, with a 25% increase from 2009 to 2010. Asia Pacific saw the highest growth rate of 48% while Europe grew by 22%.
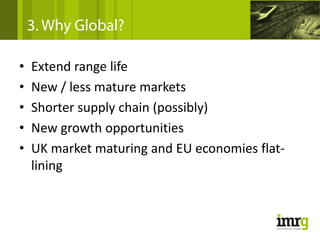
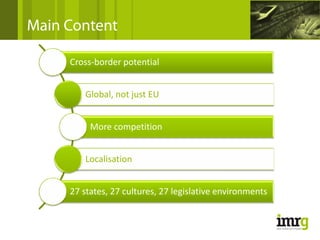
3. Selling internationally allows companies to extend product ranges, enter new markets, and access new growth opportunities to combat maturing domestic markets. However, cross-border trade presents challenges of localizing for multiple cultures and regulations.


![X Border Pp Sophia 09 [Lecture Seule]](https://cdn.slidesharecdn.com/ss_thumbnails/x-border-pp-sophia09lectureseule-091020155310-phpapp01-thumbnail.jpg?width=640&height=640&fit=bounds)


