Downloaded 30 times


![@IntelSoftware @IntelGraphics
Legal Notices and Disclaimers
No license (express or implied, by estoppel or otherwise) to any intellectual property rights is granted by this document.
Intel disclaims all express and implied warranties, including without limitation, the implied warranties of merchantability, fitness for a particular purpose, and non-infringement, as well
as any warranty arising from course of performance, course of dealing, or usage in trade.
You may not use or facilitate the use of this document in connection with any infringement or other legal analysis concerning Intel products described herein. You agree to grant Intel a
non-exclusive, royalty-free license to any patent claim thereafter drafted which includes subject matter disclosed herein.
The products and services described may contain defects or errors known as errata which may cause deviations from published specifications. Current characterized errata are
available on request.
Intel technologies’ features and benefits depend on system configuration and may require enabled hardware, software or service activation. Performance varies depending on system
configuration. No computer system can be absolutely secure. Check with your system manufacturer or retailer or learn more at [intel.com].
Software and workloads used in performance tests may have been optimized for performance only on Intel microprocessors. Performance tests, such as SYSmark and MobileMark, are
measured using specific computer systems, components, software, operations and functions. Any change to any of those factors may cause the results to vary. You should consult
other information and performance tests to assist you in fully evaluating your contemplated purchases, including the performance of that product when combined with other
products. For more complete information visit www.intel.com/benchmarks.
Optimization Notice: Intel's compilers may or may not optimize to the same degree for non-Intel microprocessors for optimizations that are not unique to Intel microprocessors. These
optimizations include SSE2, SSE3, and SSSE3 instruction sets and other optimizations. Intel does not guarantee the availability, functionality, or effectiveness of any optimization on
microprocessors not manufactured by Intel. Microprocessor-dependent optimizations in this product are intended for use with Intel microprocessors. Certain optimizations not
specific to Intel microarchitecture are reserved for Intel microprocessors. Please refer to the applicable product User and Reference Guides for more information regarding the specific
instruction sets covered by this notice.
Results have been estimated or simulated using internal Intel analysis or architecture simulation or modeling, and provided to you for informational purposes. Any differences in your
system hardware, software or configuration may affect your actual performance.
Intel, Core and the Intel logo are trademarks of Intel Corporation in the U.S. and/or other countries.
*Other names and brands may be claimed as the property of others
© Intel Corporation.](https://image.slidesharecdn.com/ivqmlrawtu20jvqu2yqy-signature-f3bbc4b7e22b609b9b600389c741128524053306d5dab142a47cc06ecfb0d6e4-poli-191005010255/75/Improve-the-performance-of-your-Unity-project-using-Graphics-Performance-Analyzers-Unite-Copenhagen-2019-76-2048.jpg)

This document provides an overview of using Intel's Graphics Performance Analyzers (GPA) tool to optimize graphics performance. It discusses profiling workflows including identifying bottlenecks and hotspots. A case study is presented where GPA is used to optimize Unity's 3D Game Kit by identifying and addressing bottlenecks like skybox rendering, reflections, and UI rendering to achieve higher frame rates. The document concludes with some extra recipes for advanced profiling with GPA.
Presentation by Valery Carpentier from Intel, discussing the agenda for optimizing graphics performance.
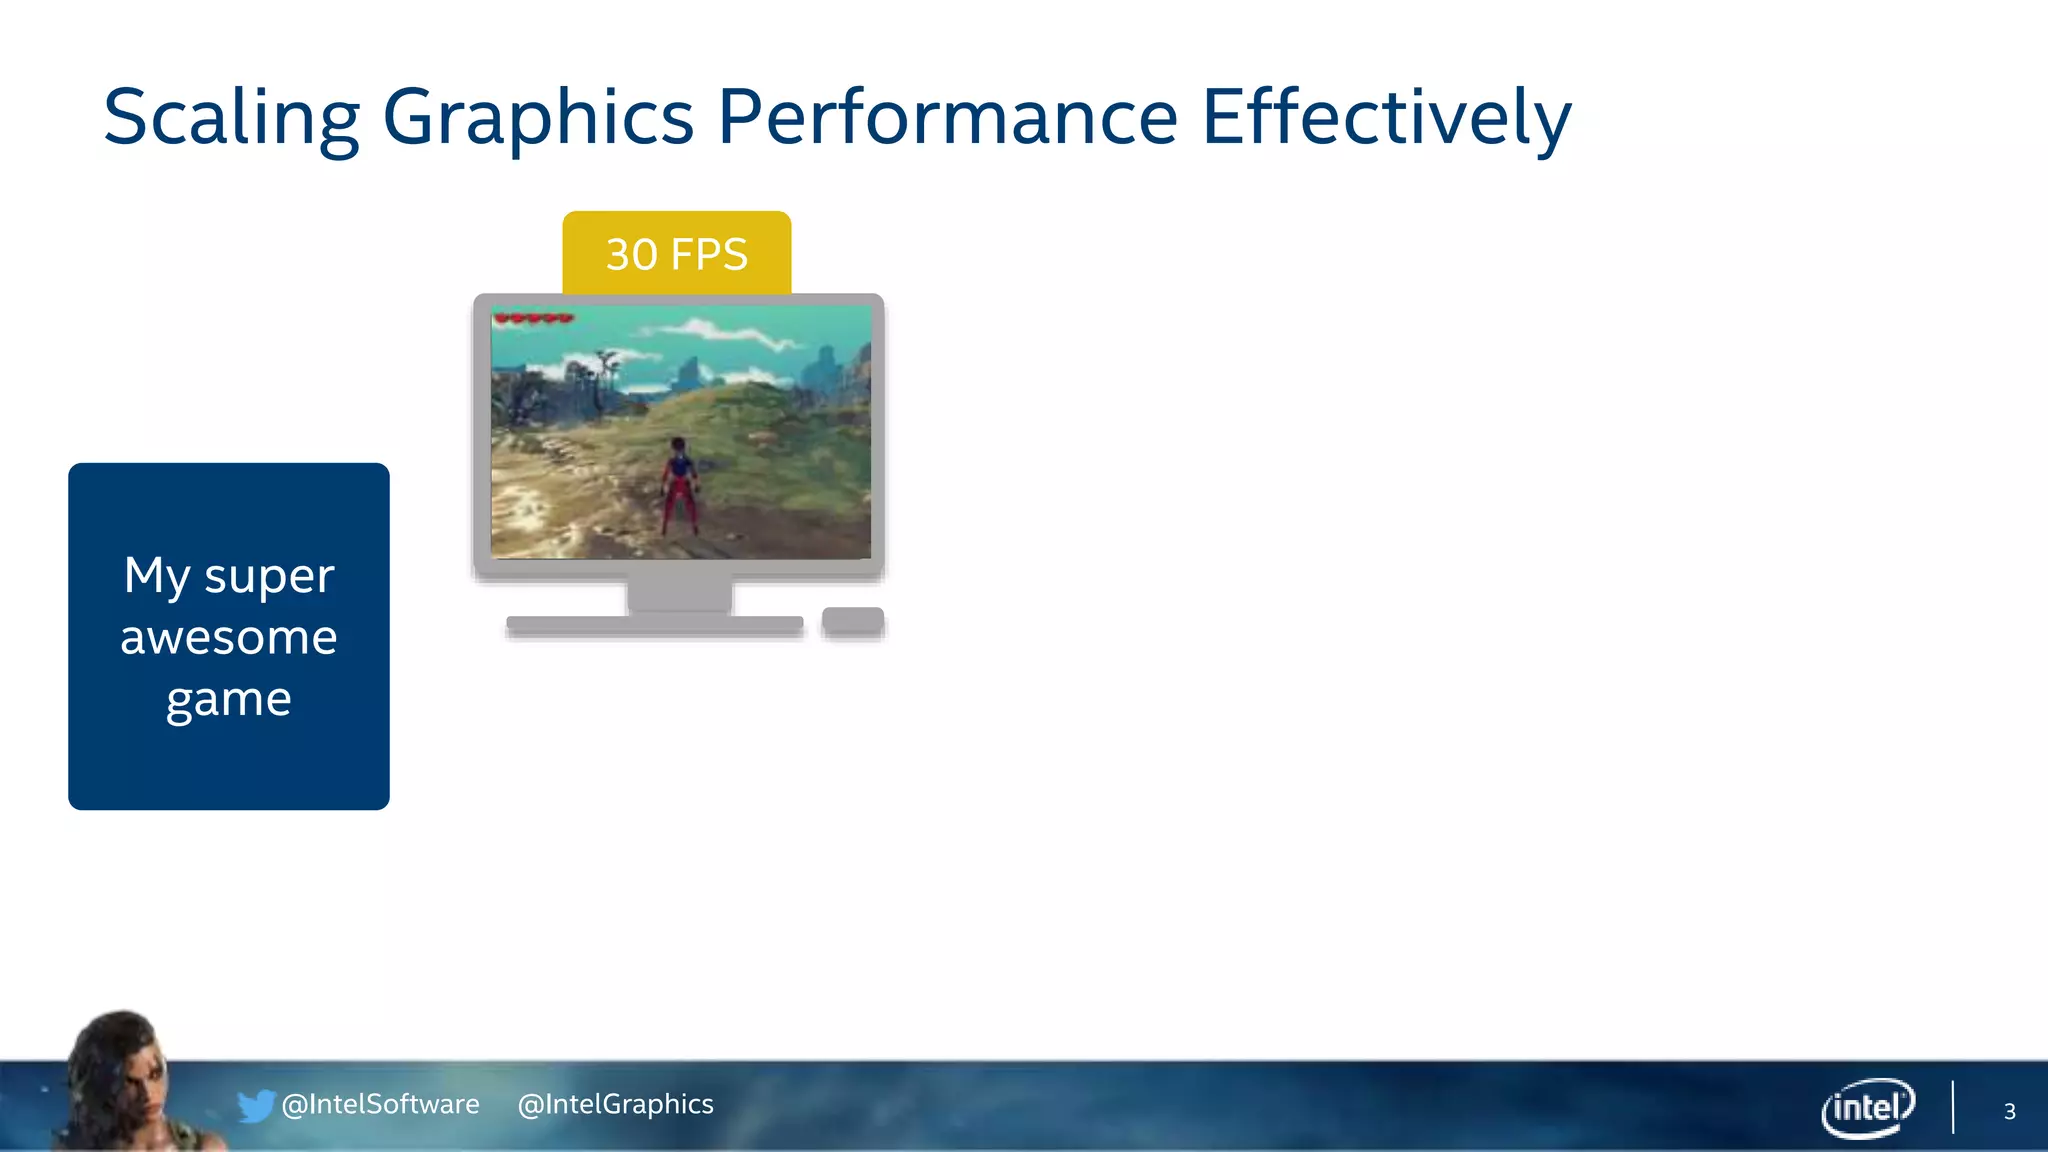
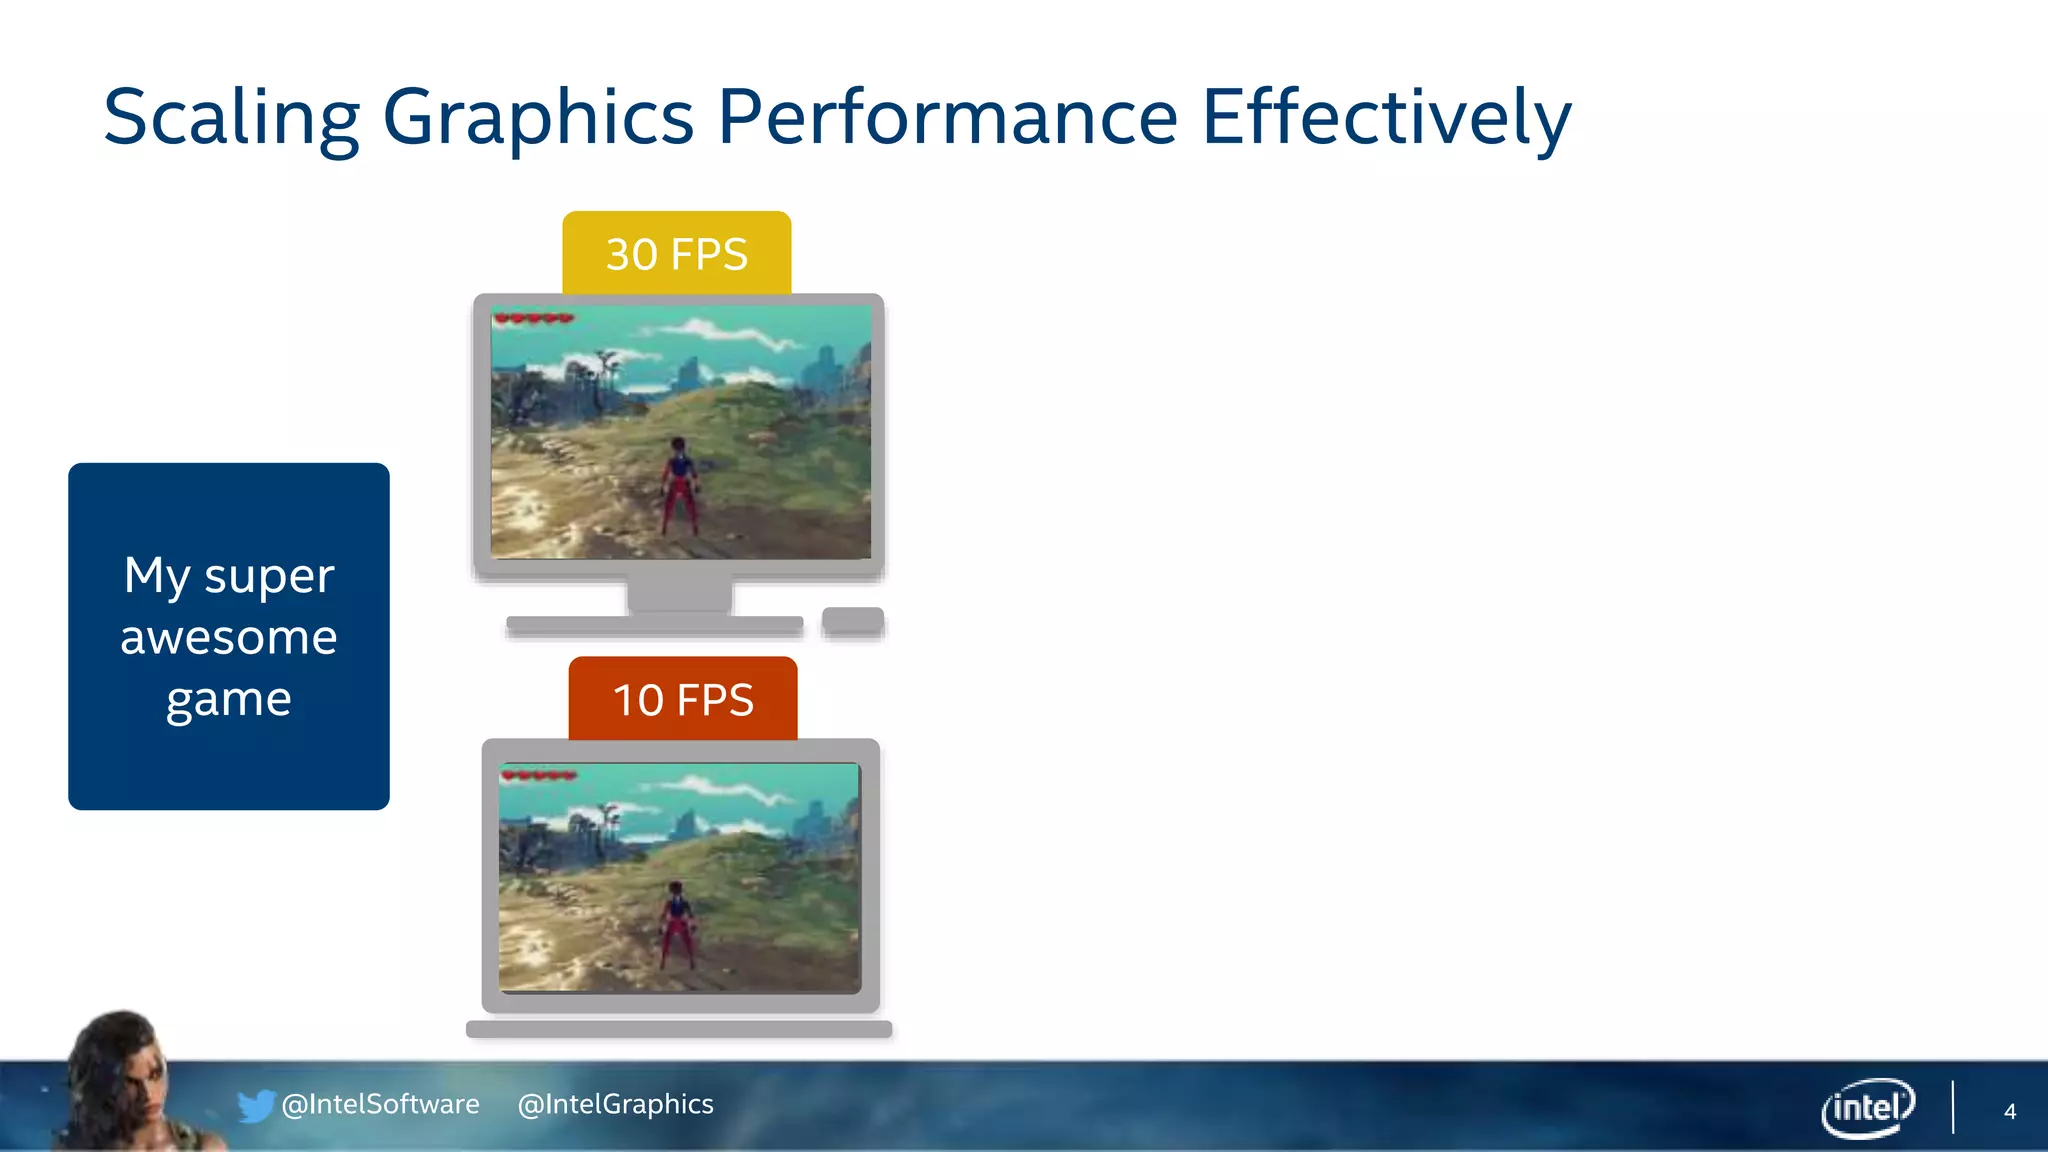
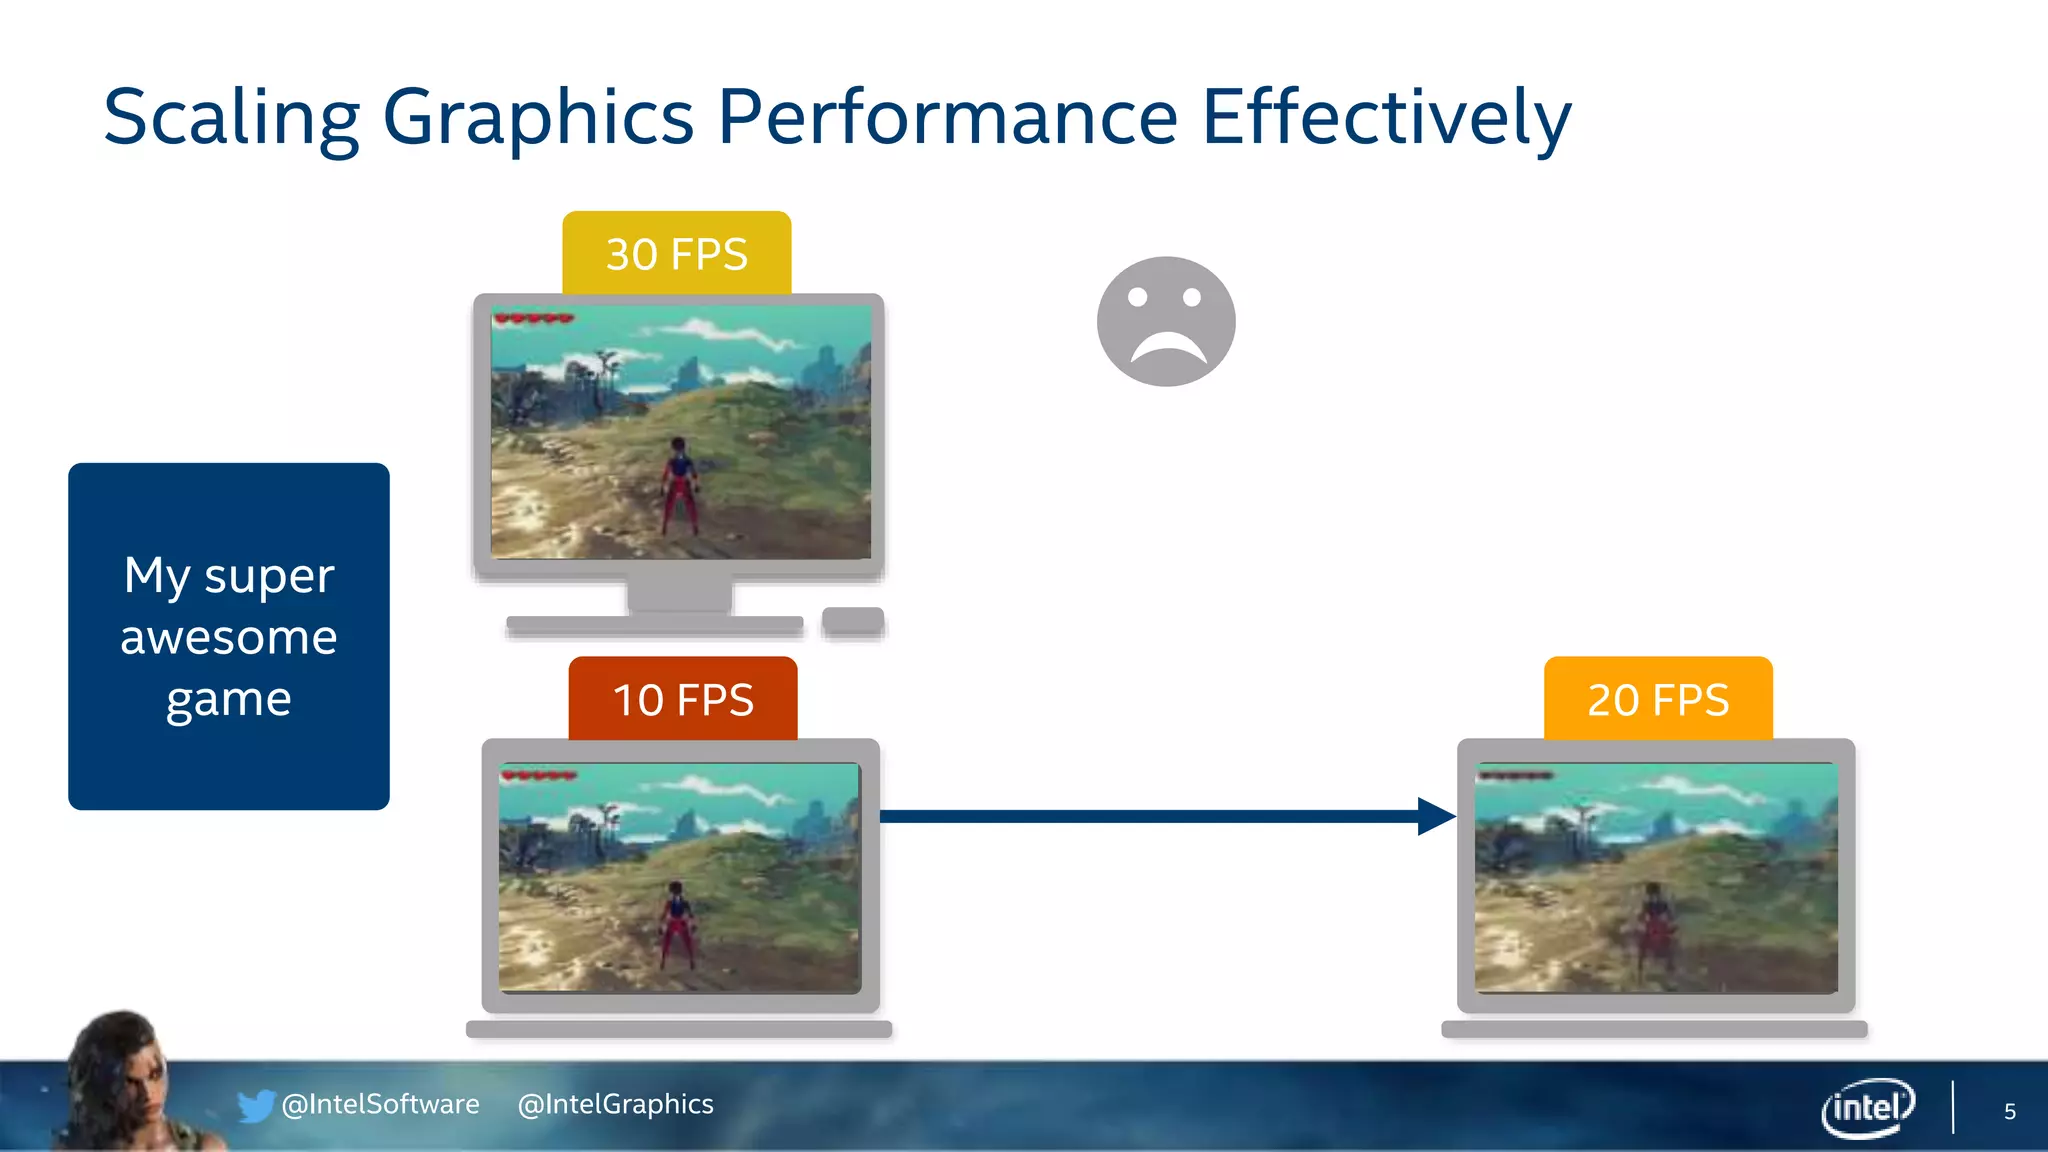
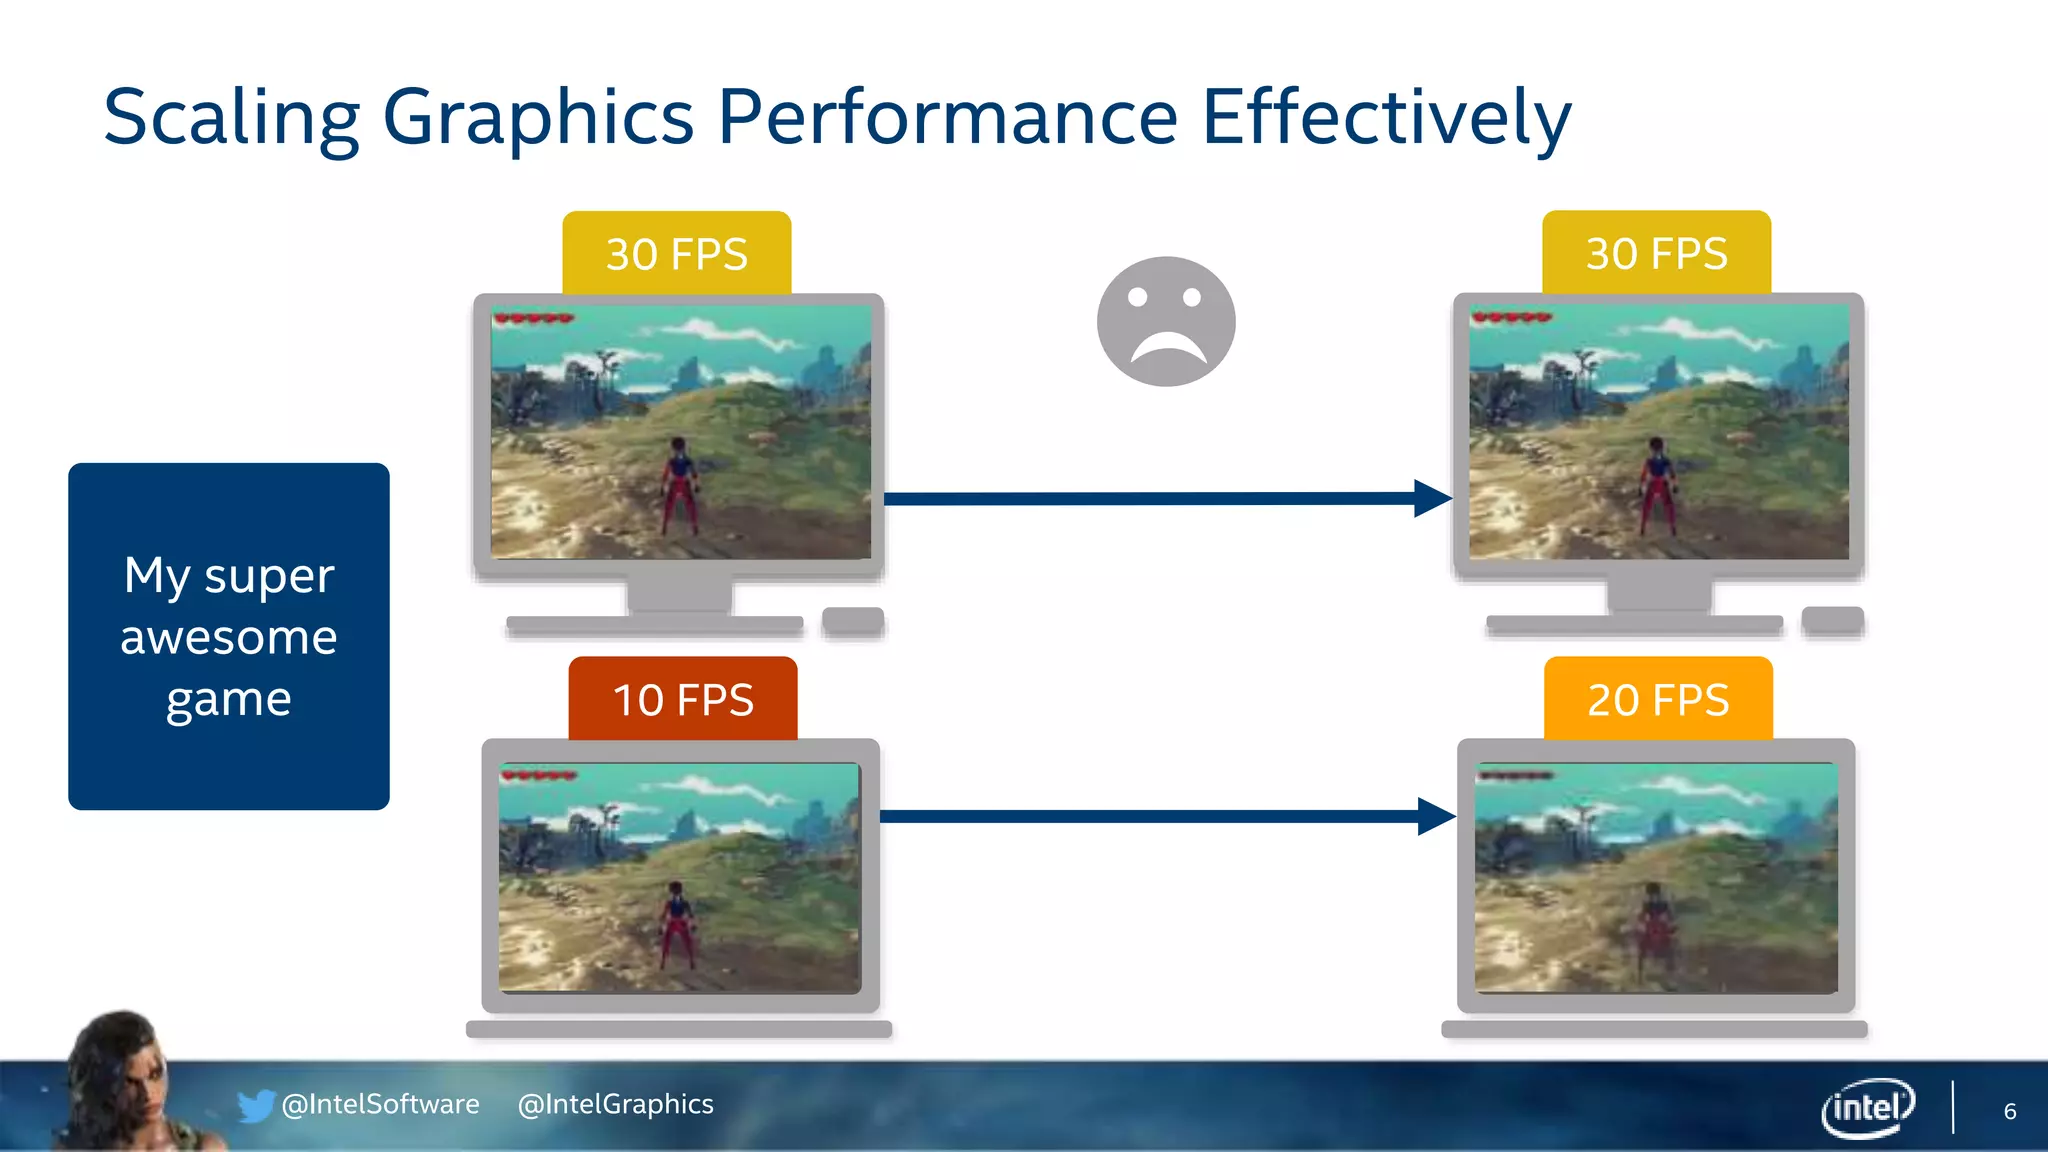
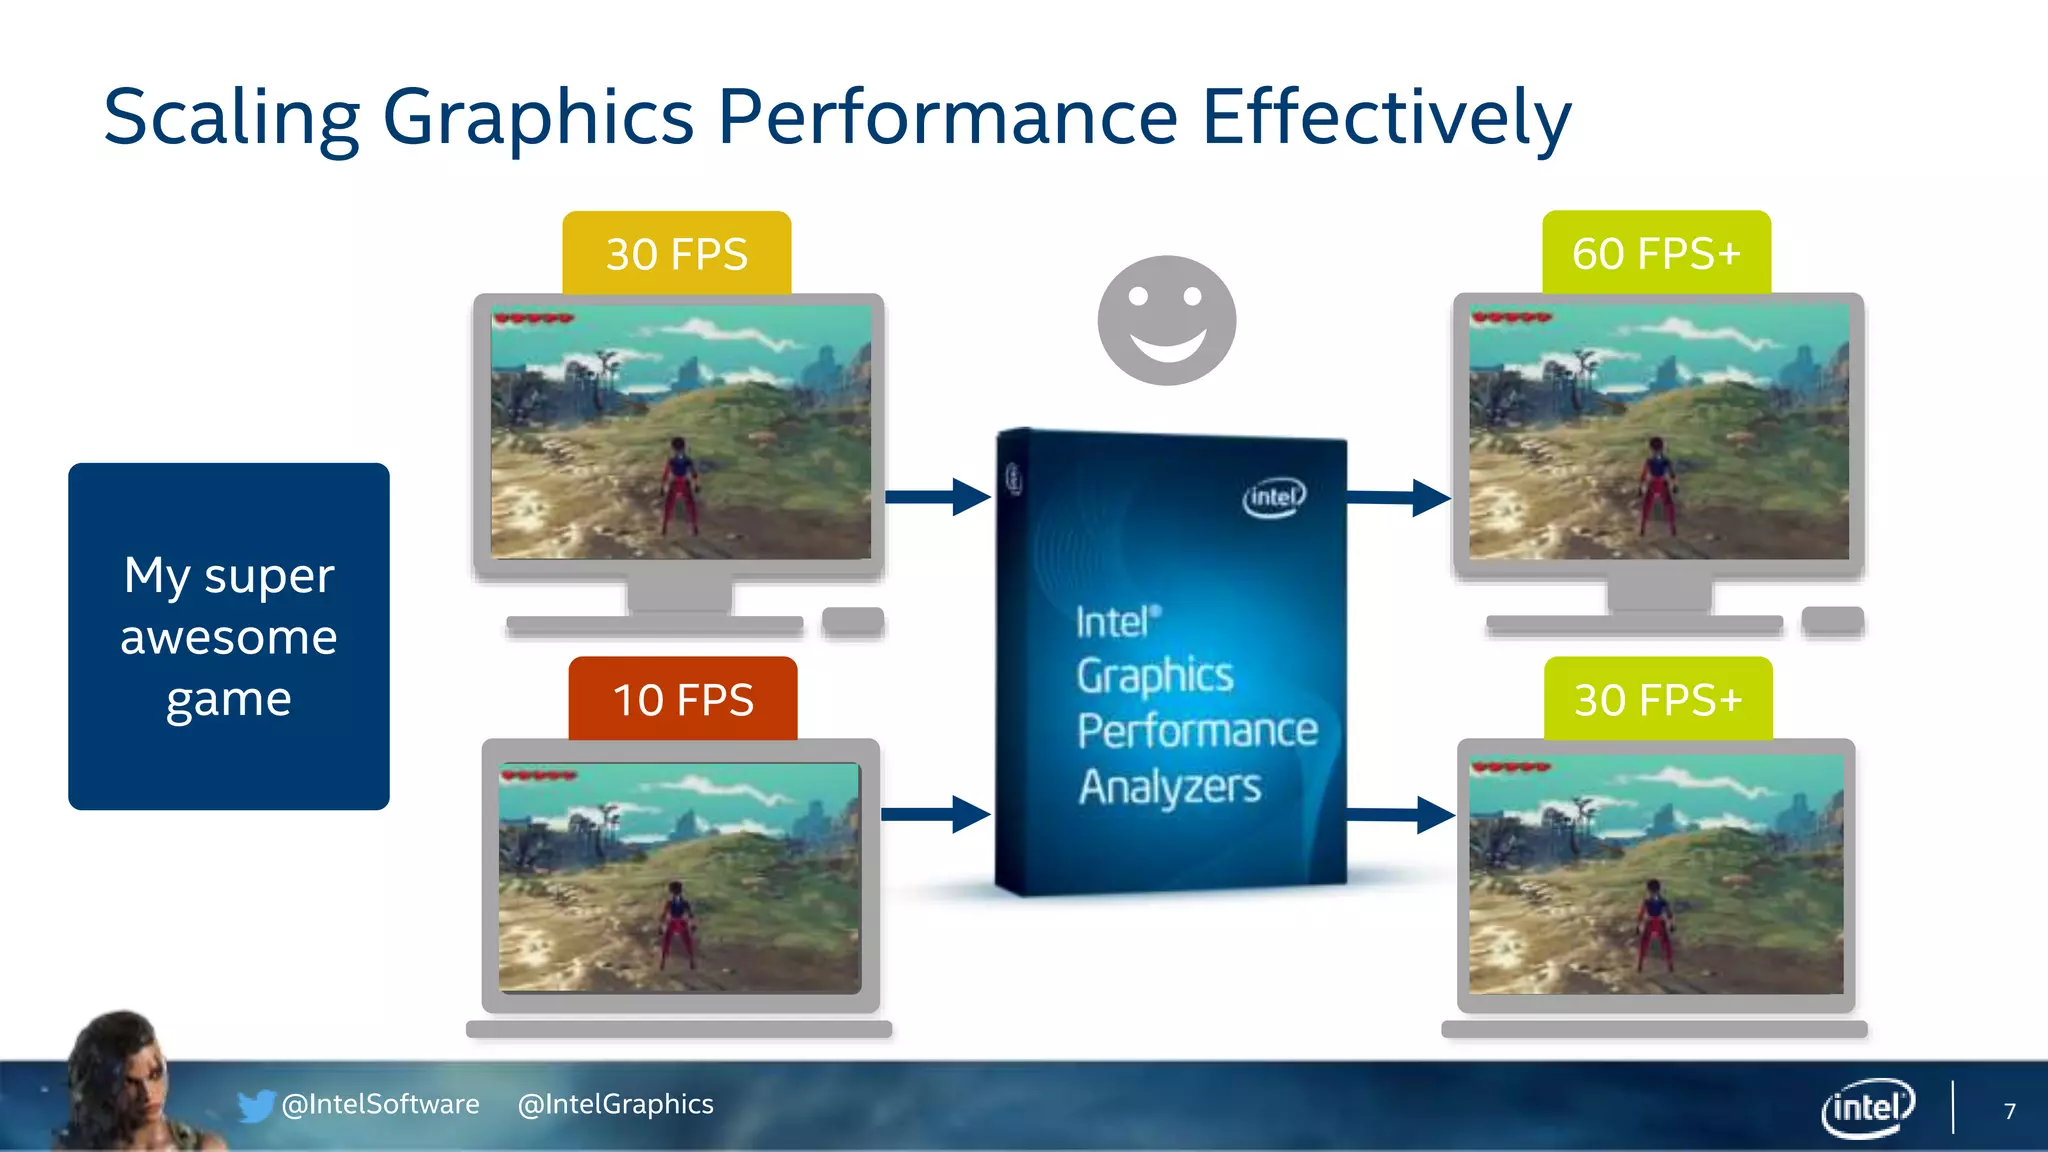
Demonstrates frames per second (FPS) performance at various levels, identifying scaling of graphics performance.
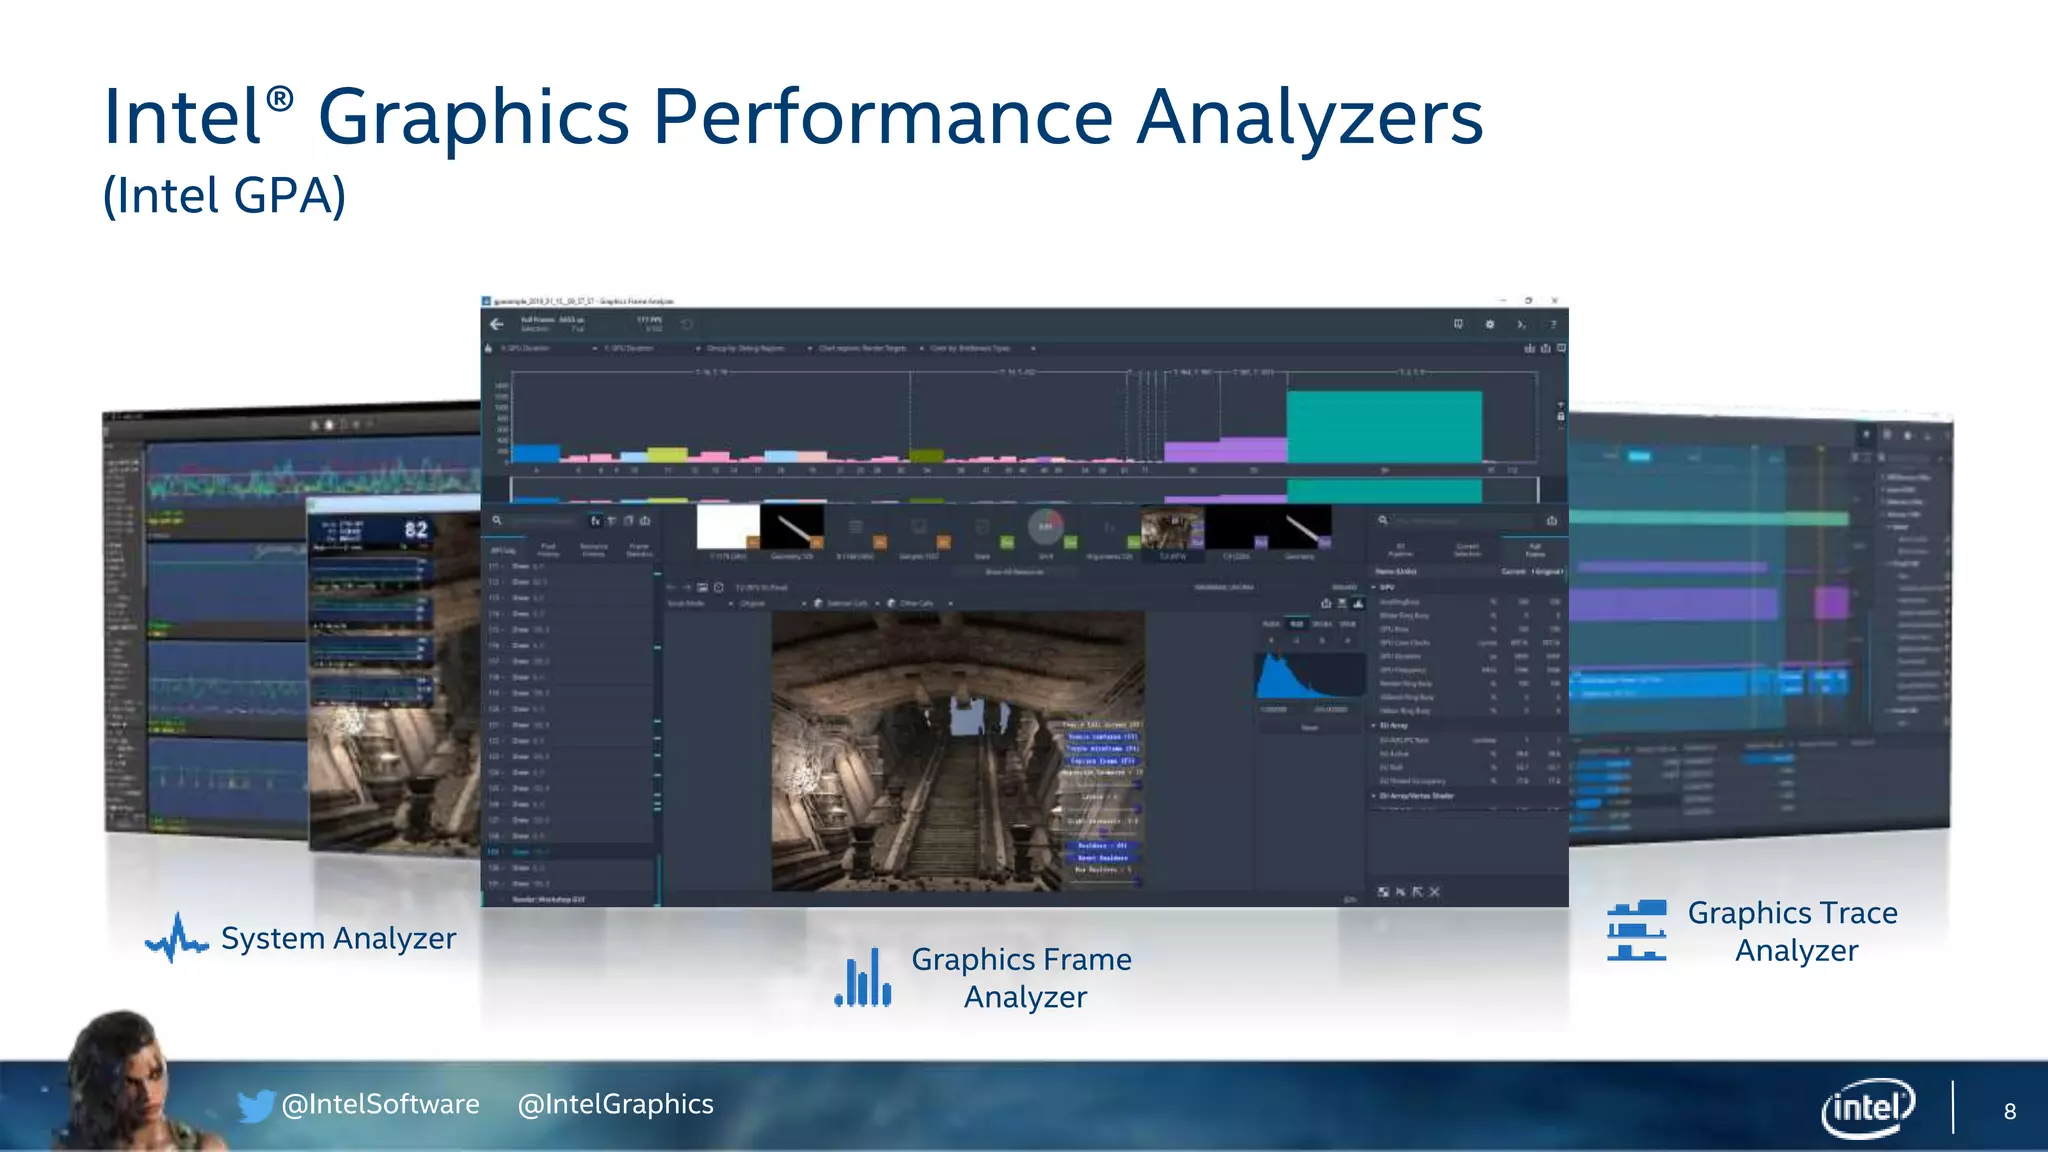
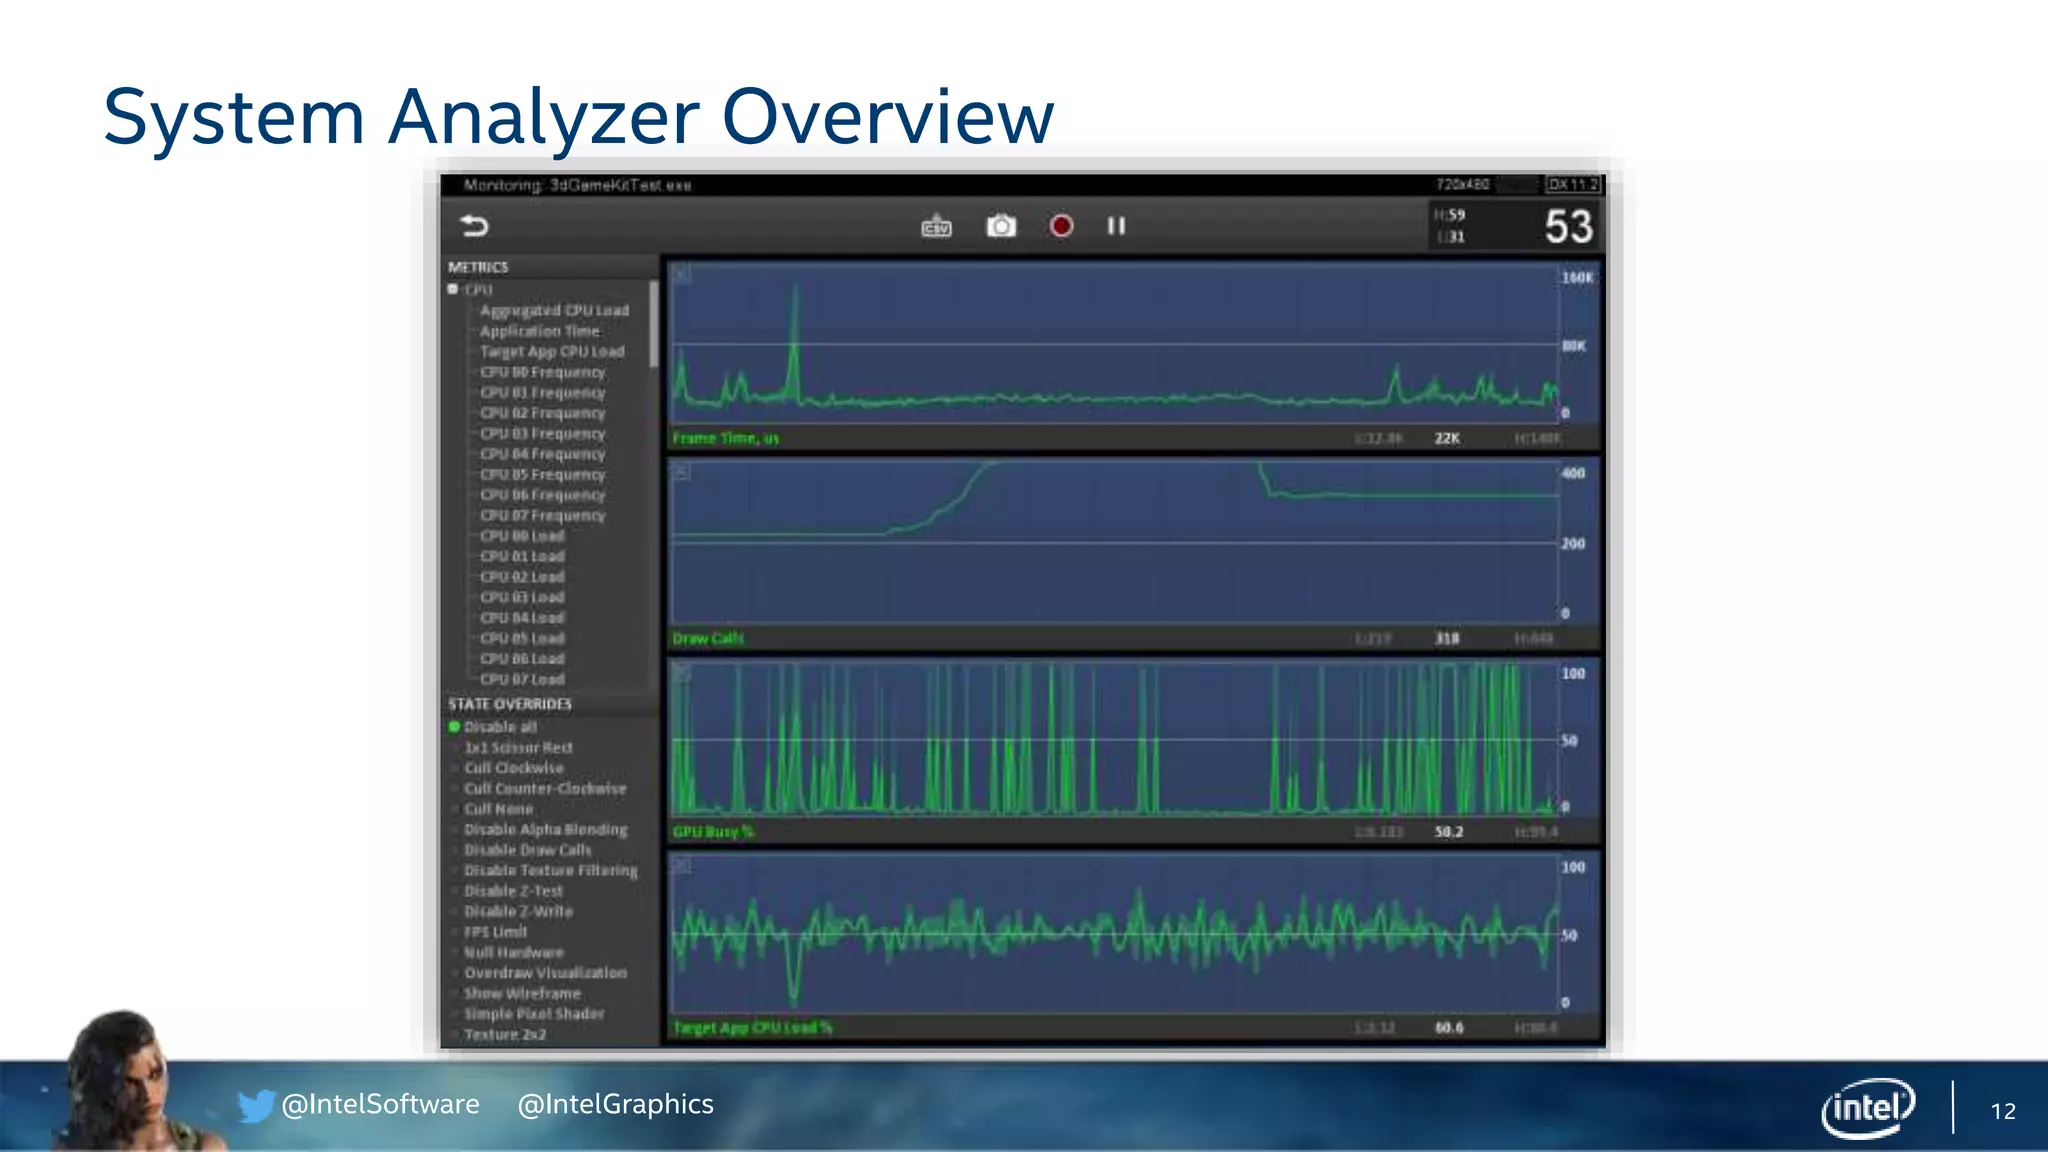
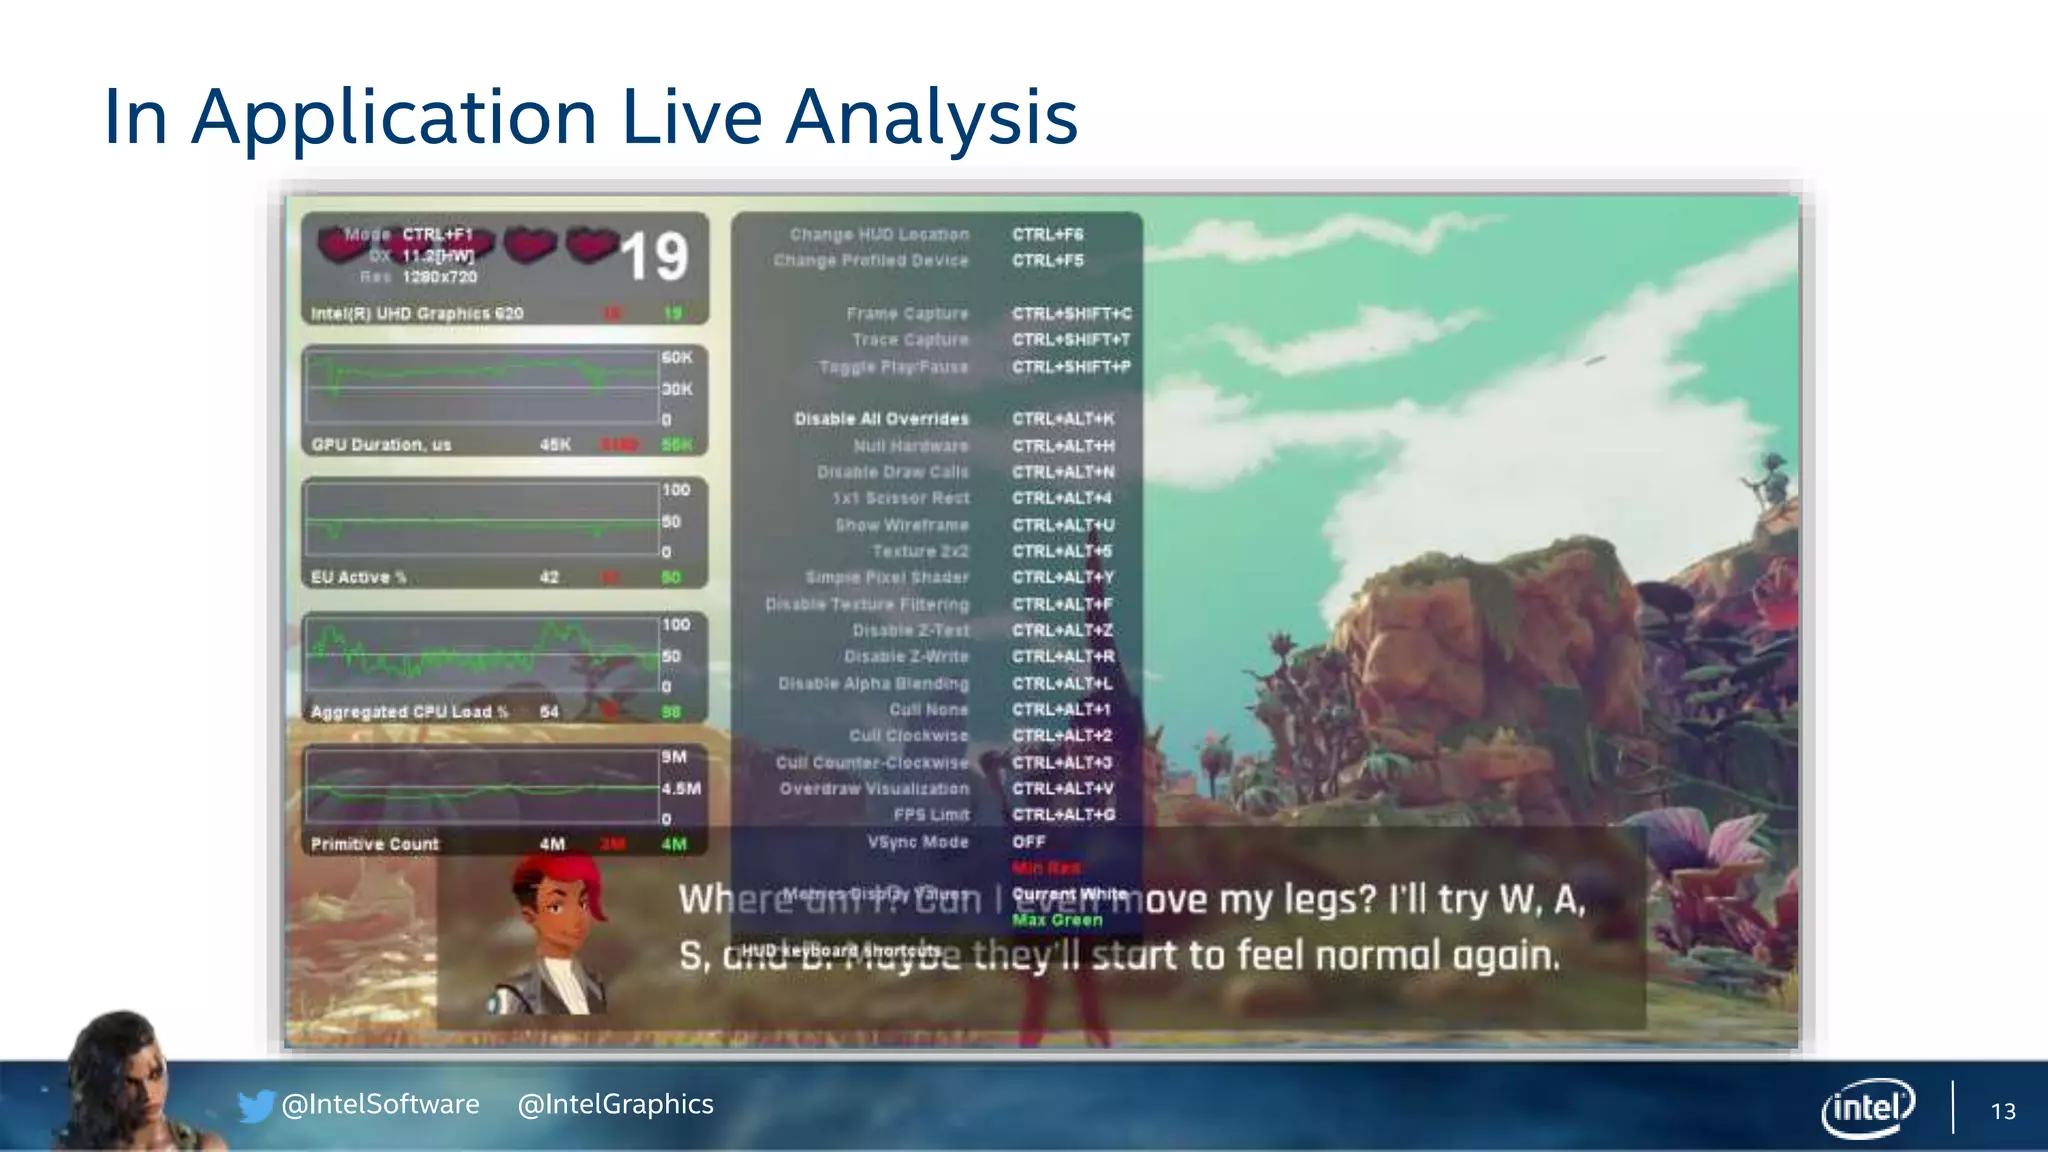
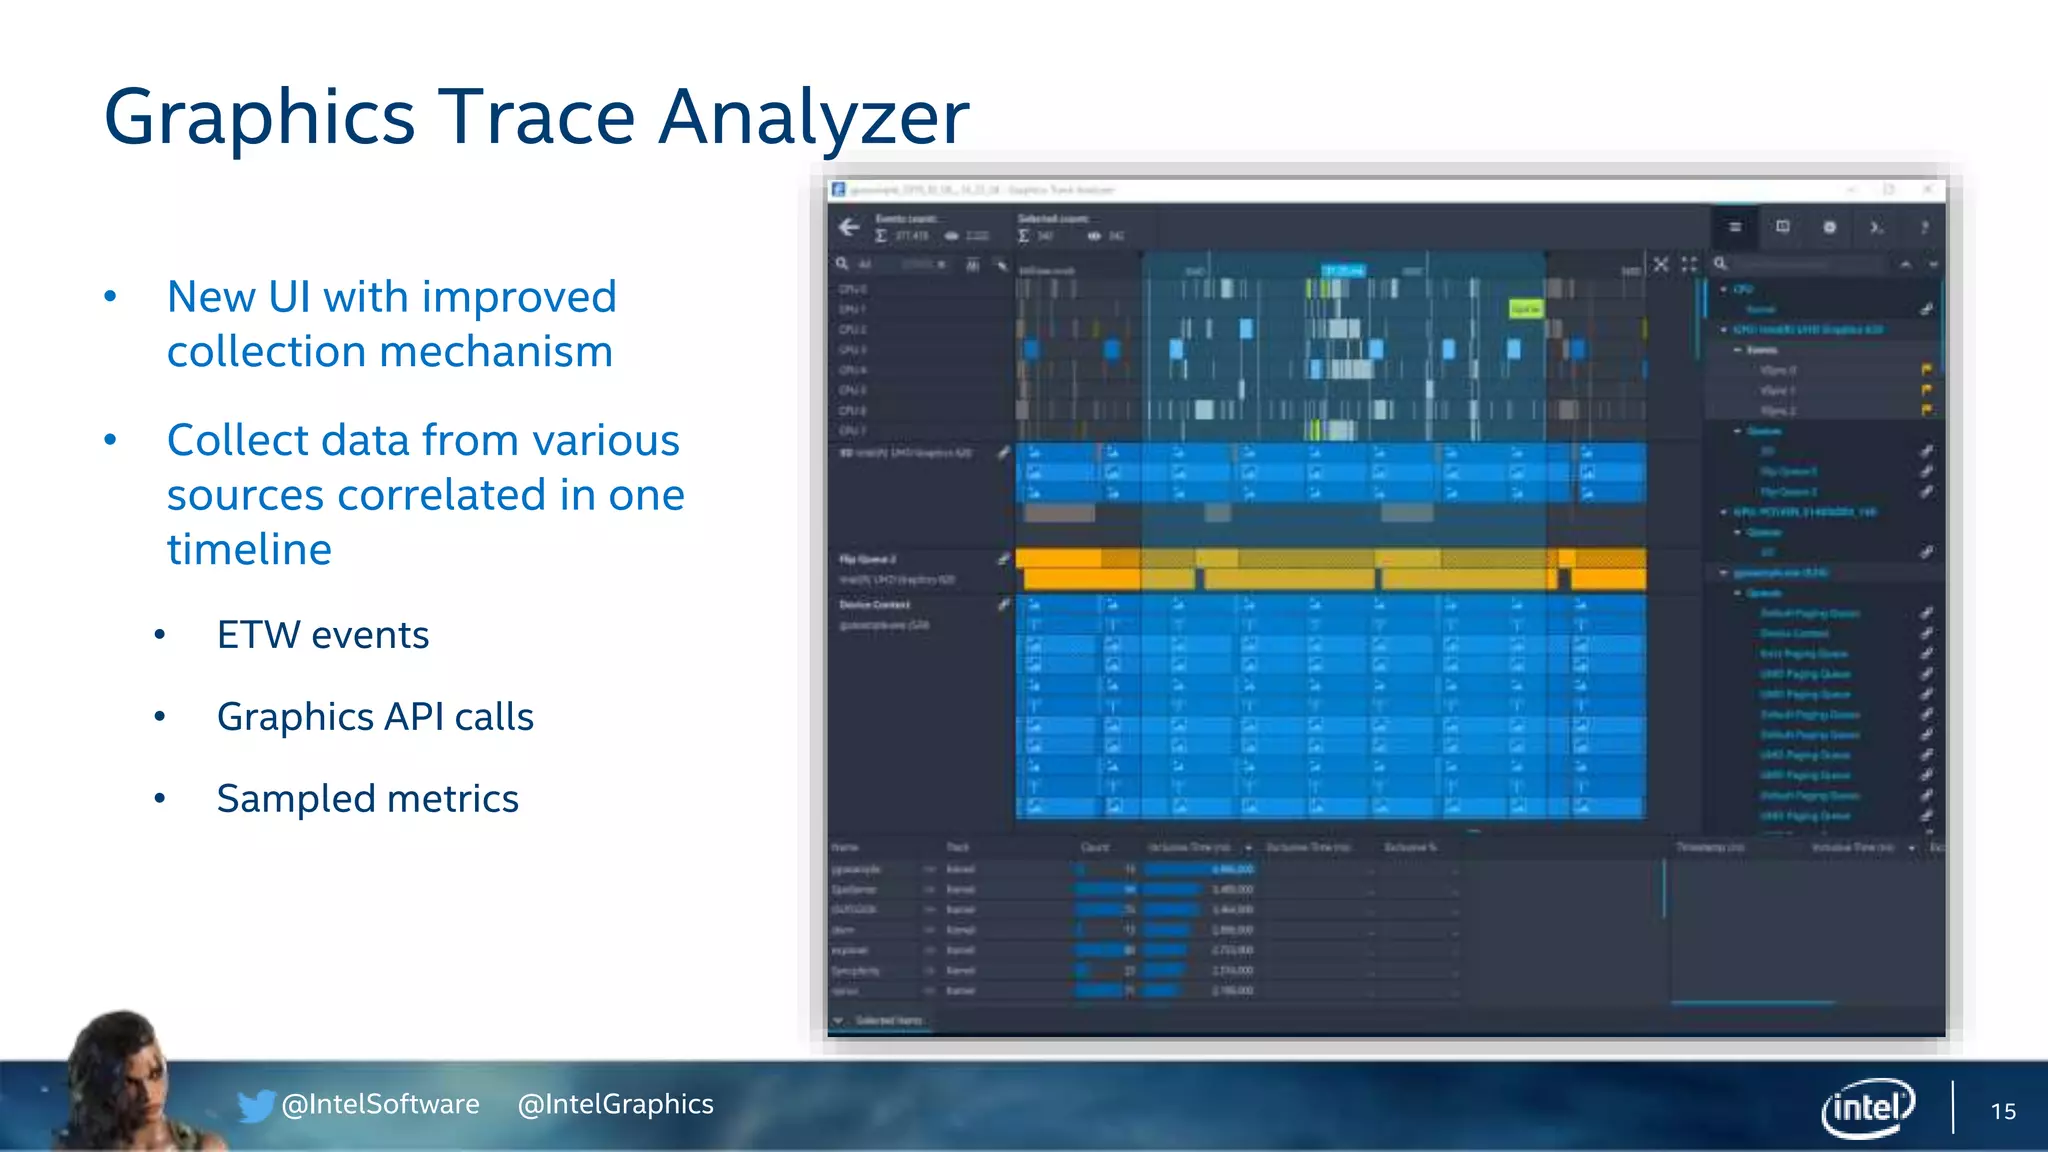
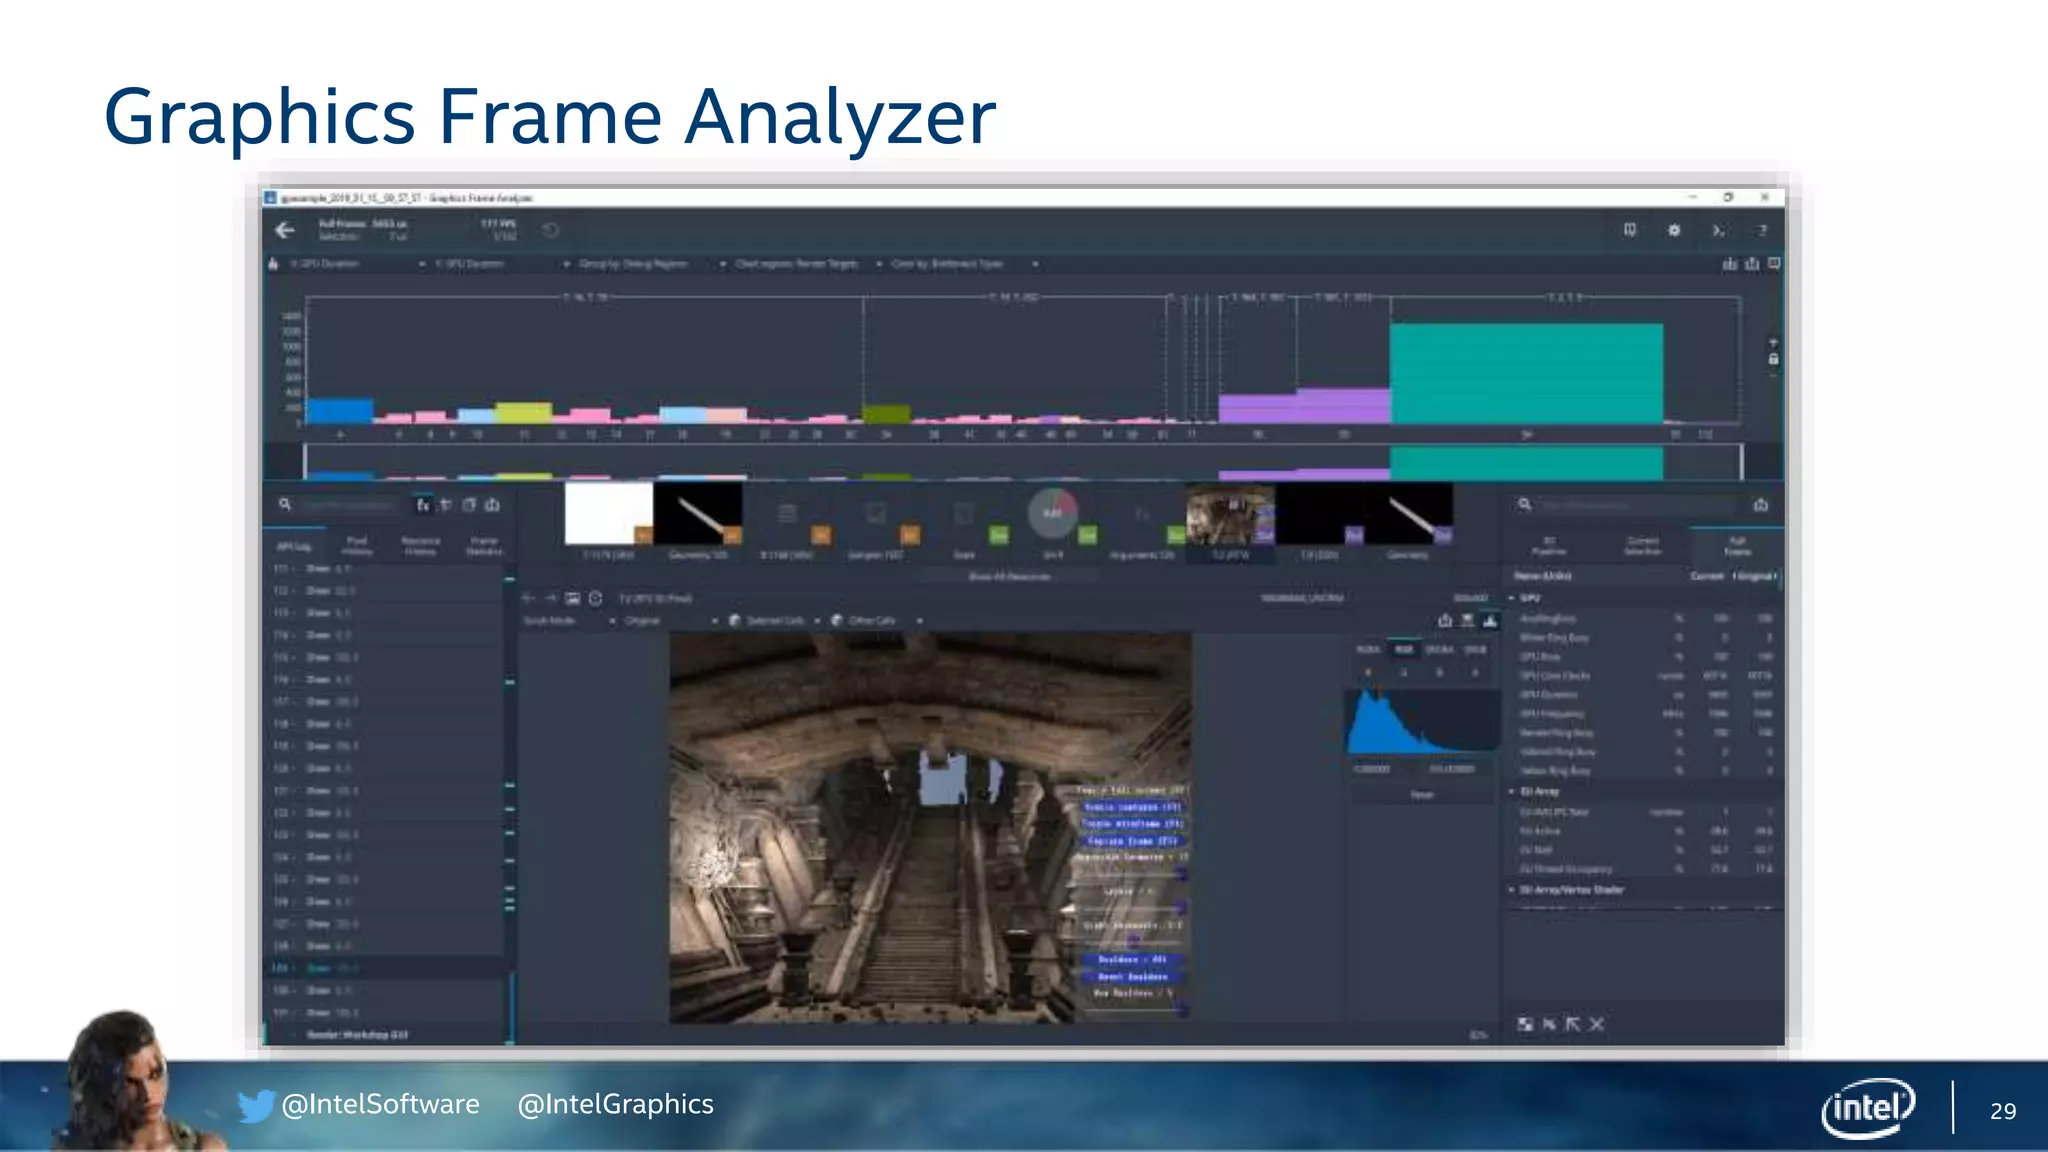
Introduction to the Intel Graphics Performance Analyzers tools: System Analyzer, Graphics Frame Analyzer, and Graphics Trace Analyzer.
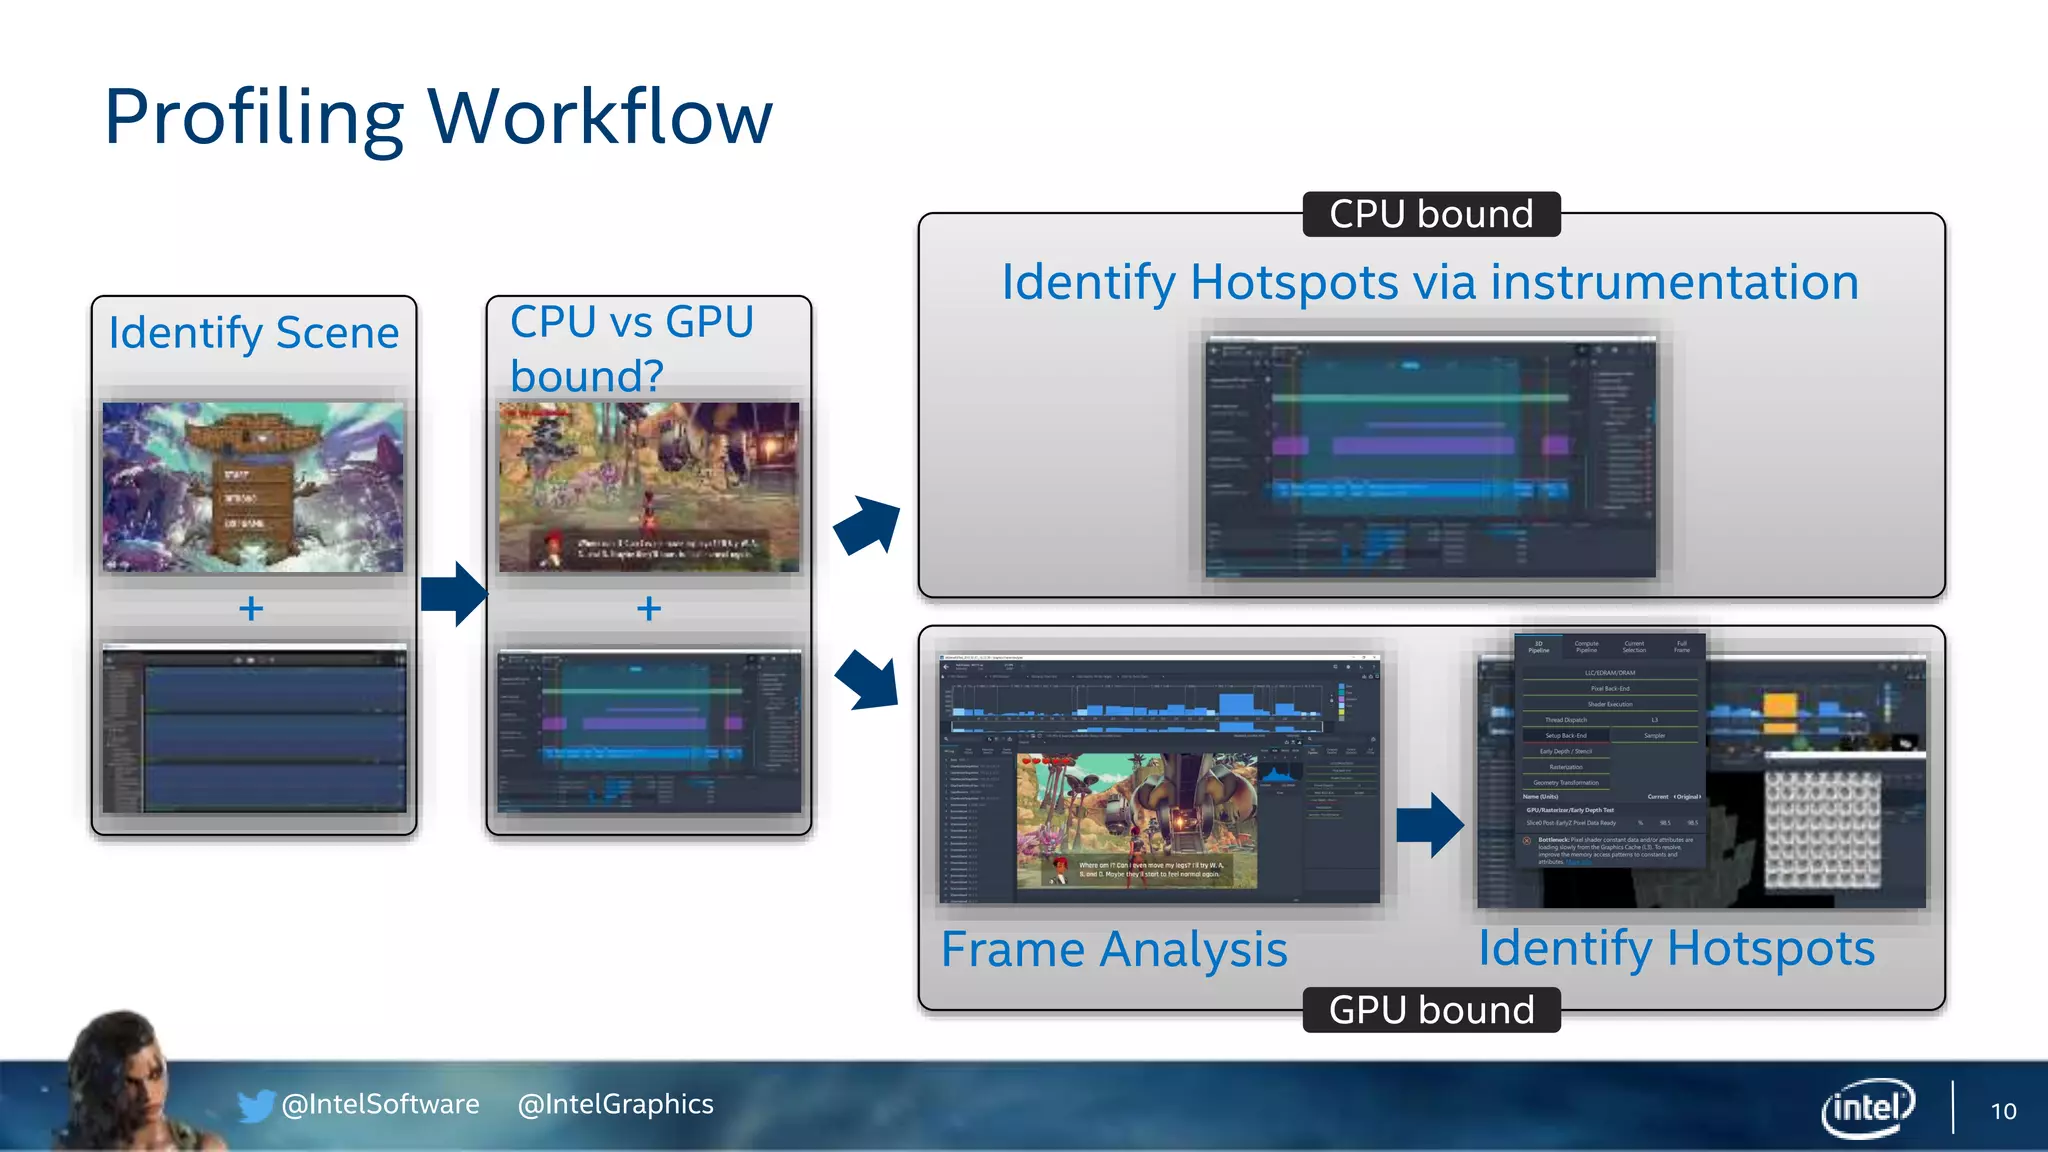
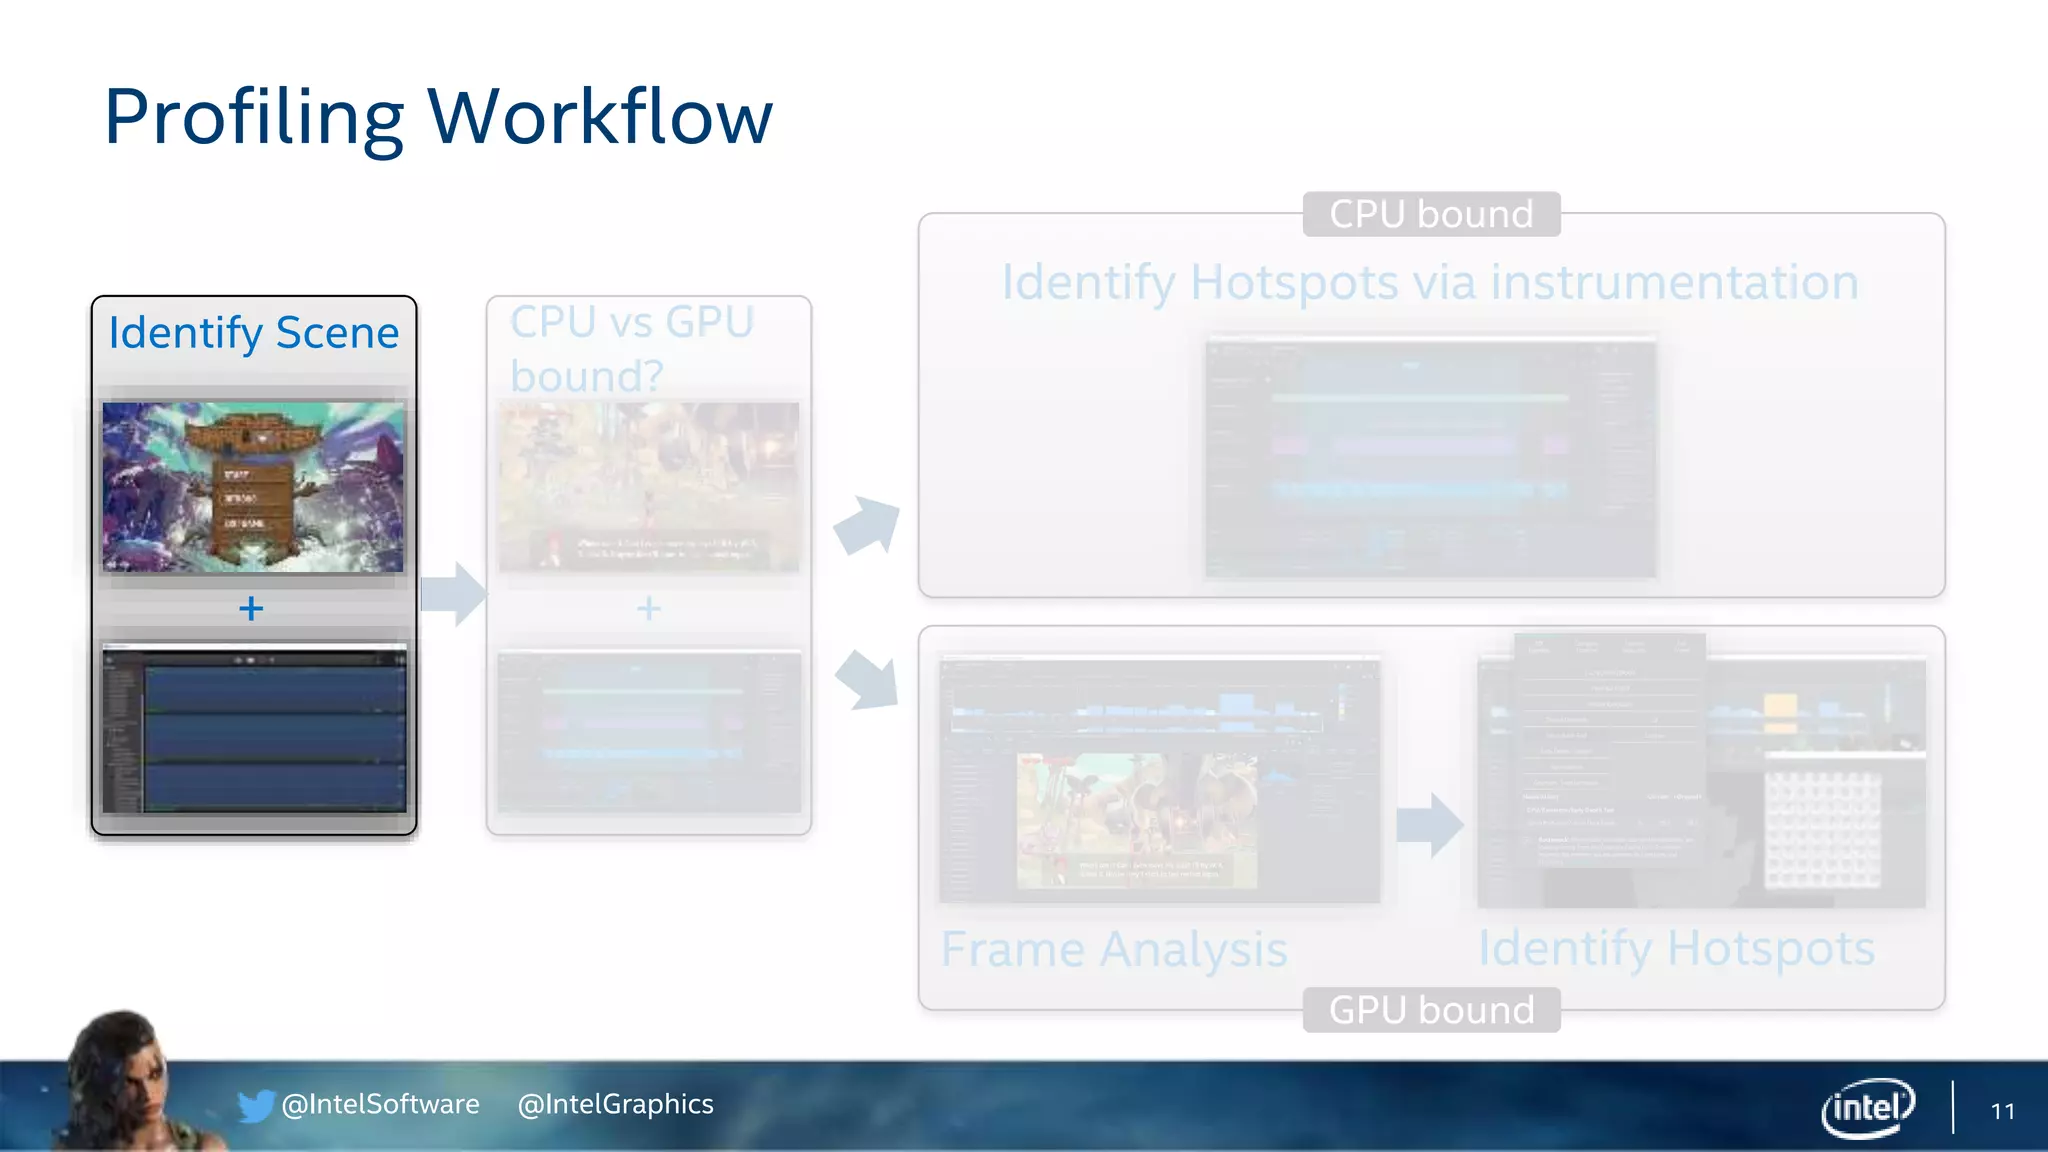
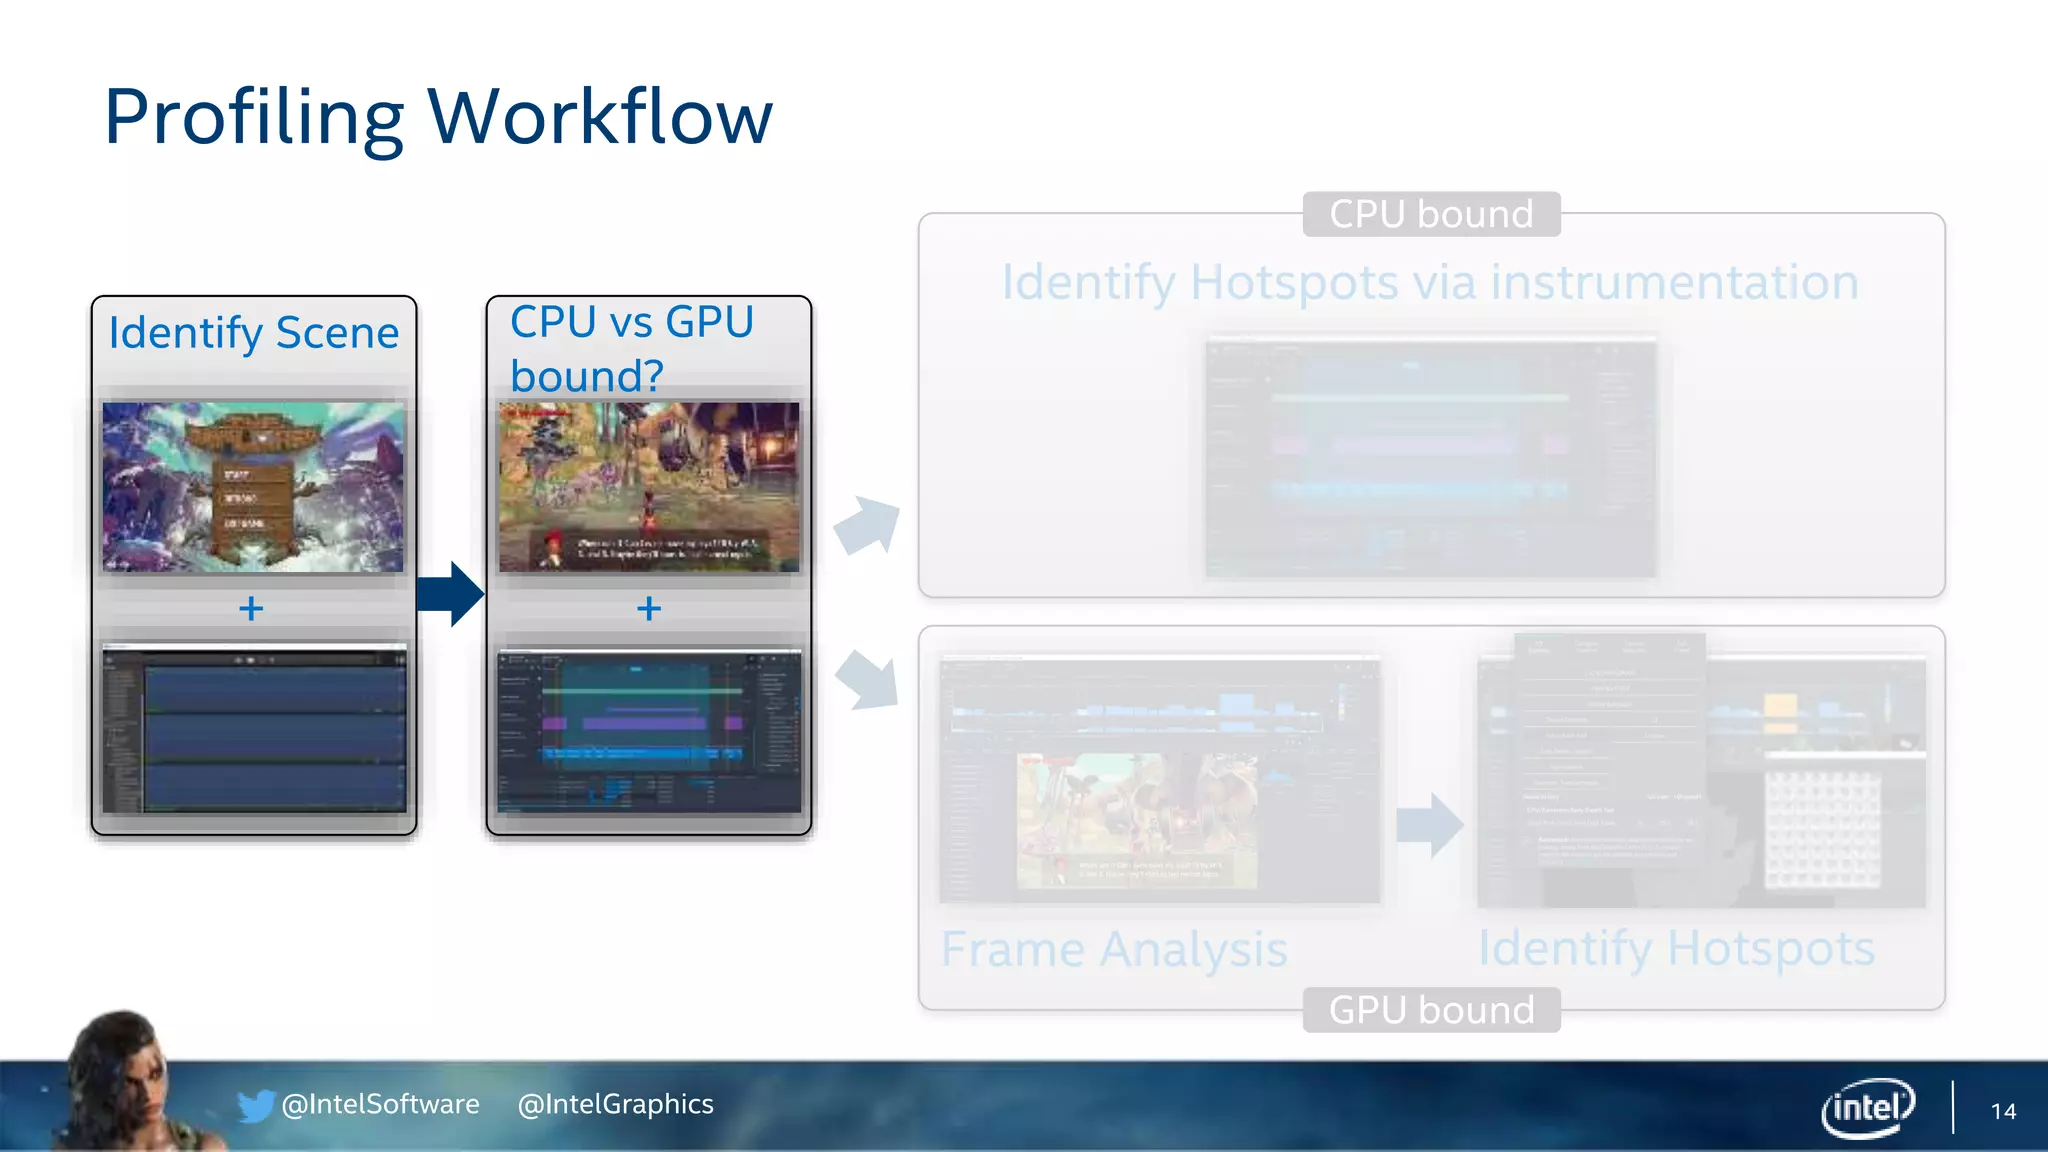
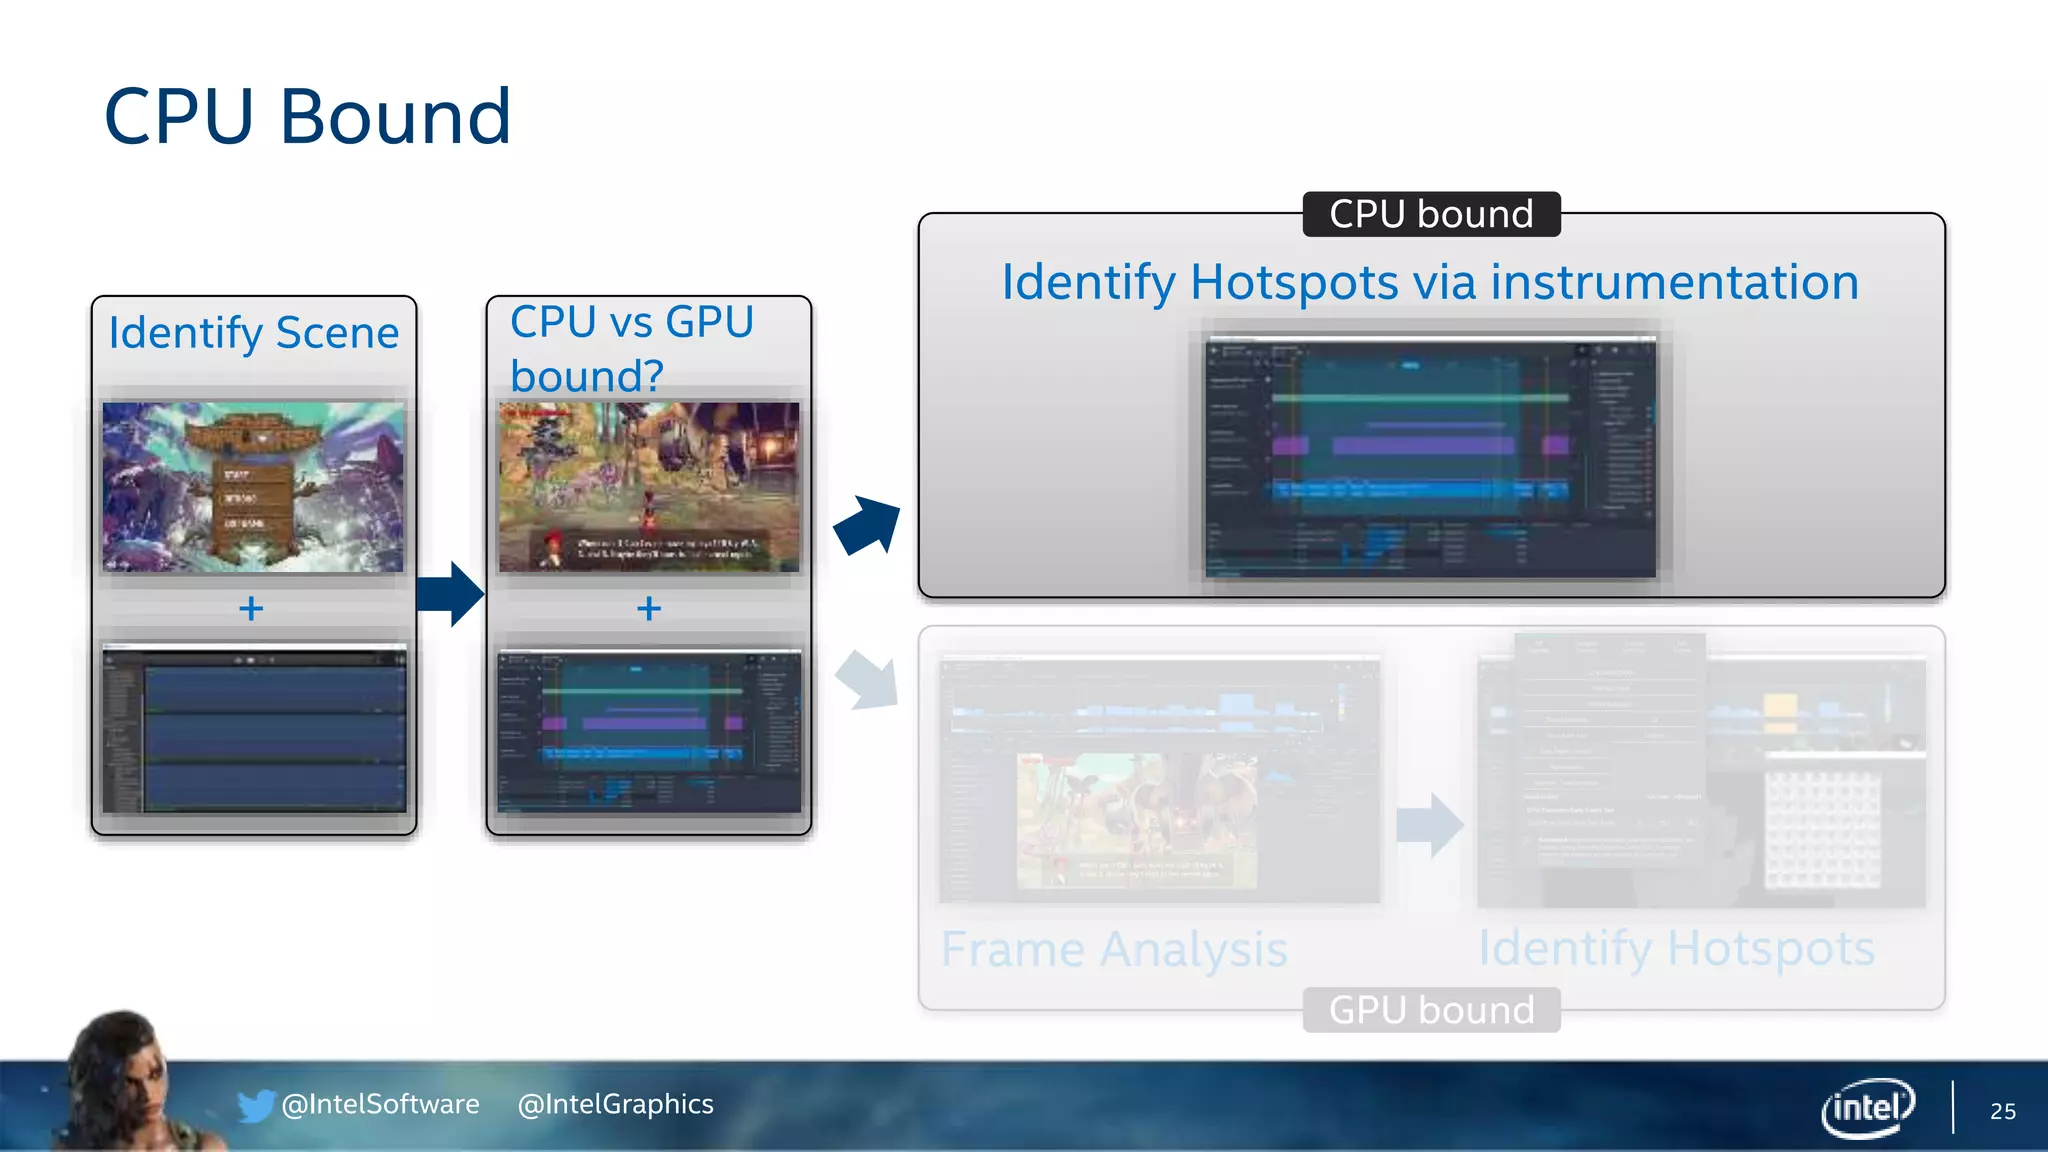
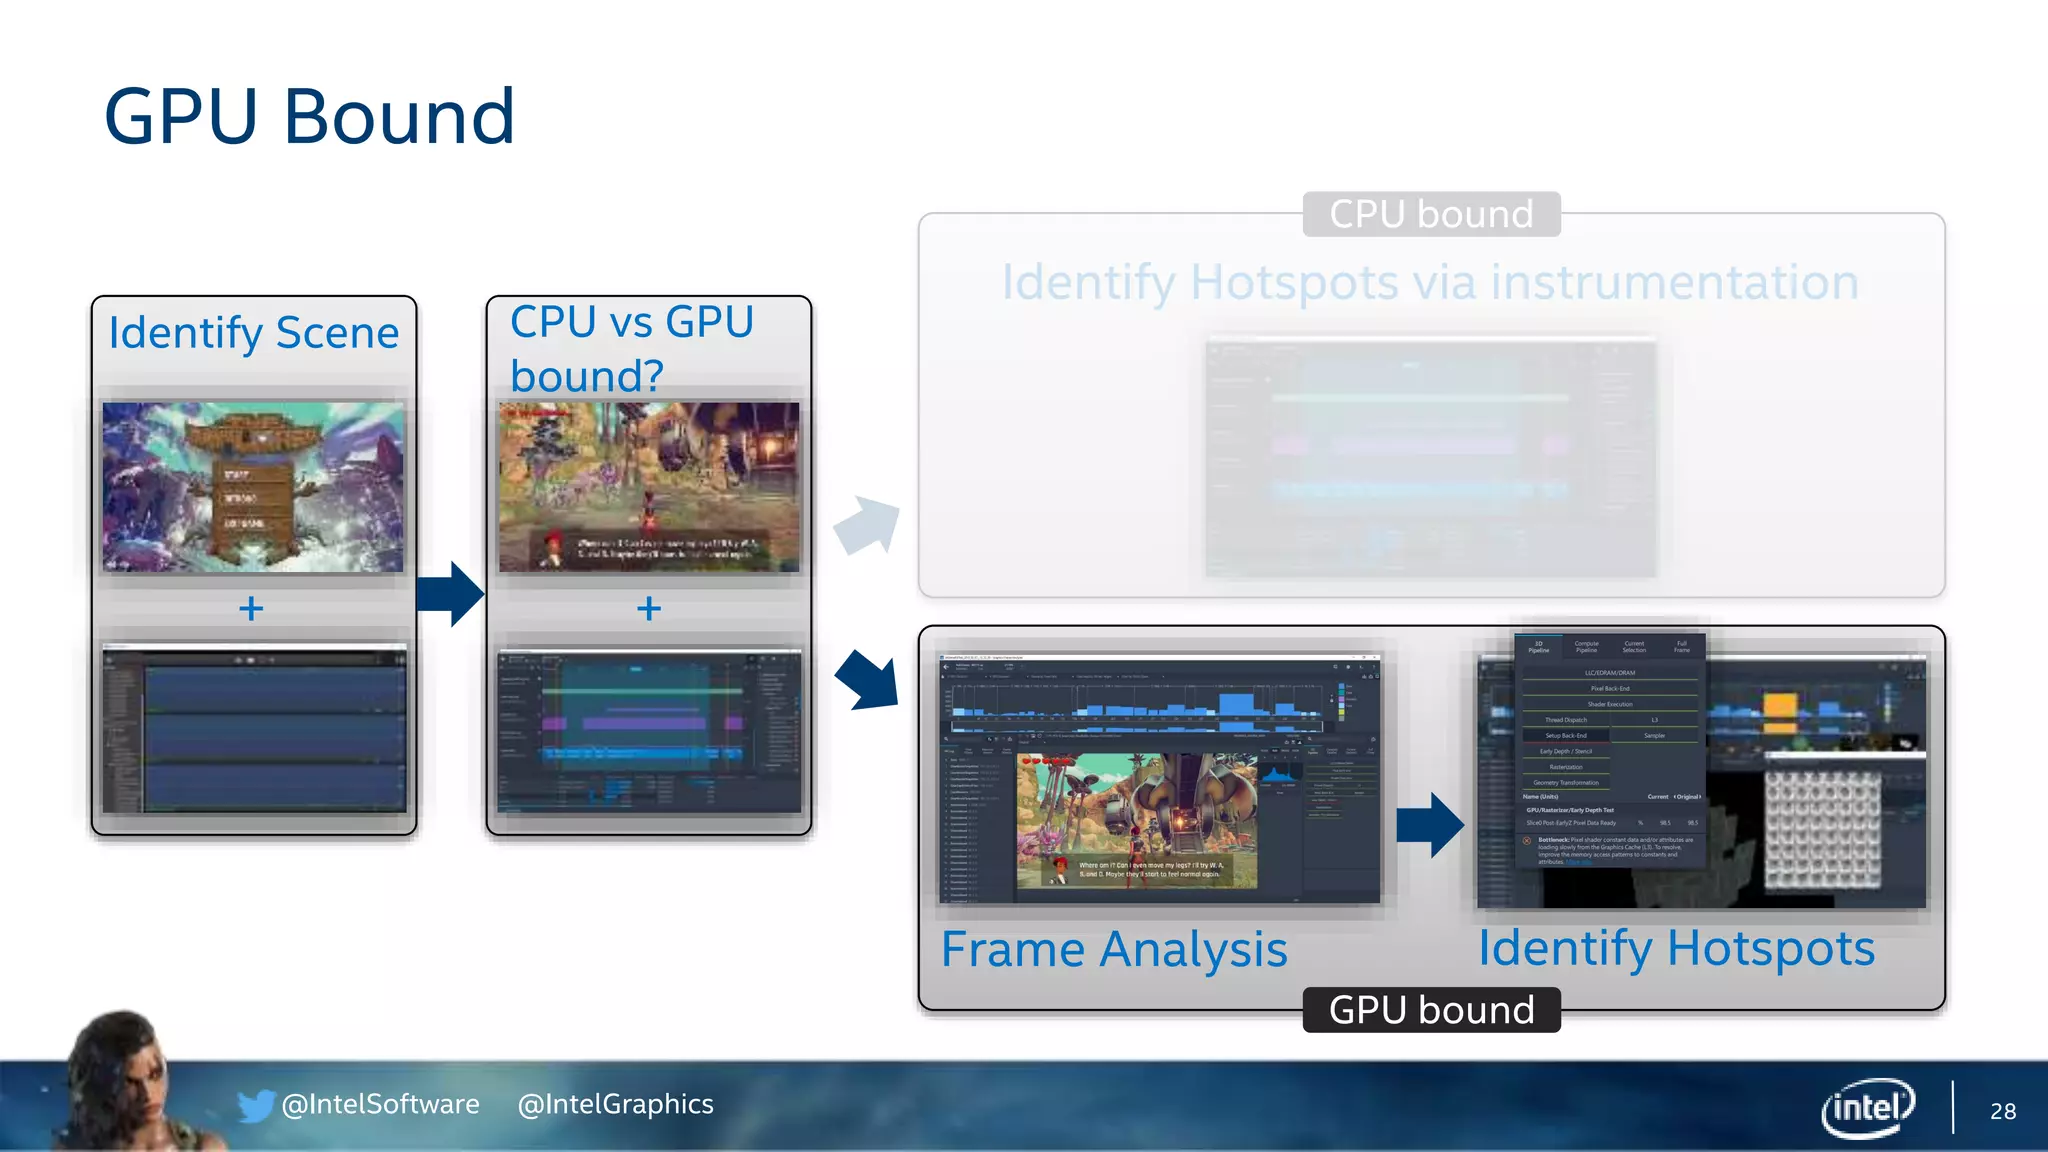
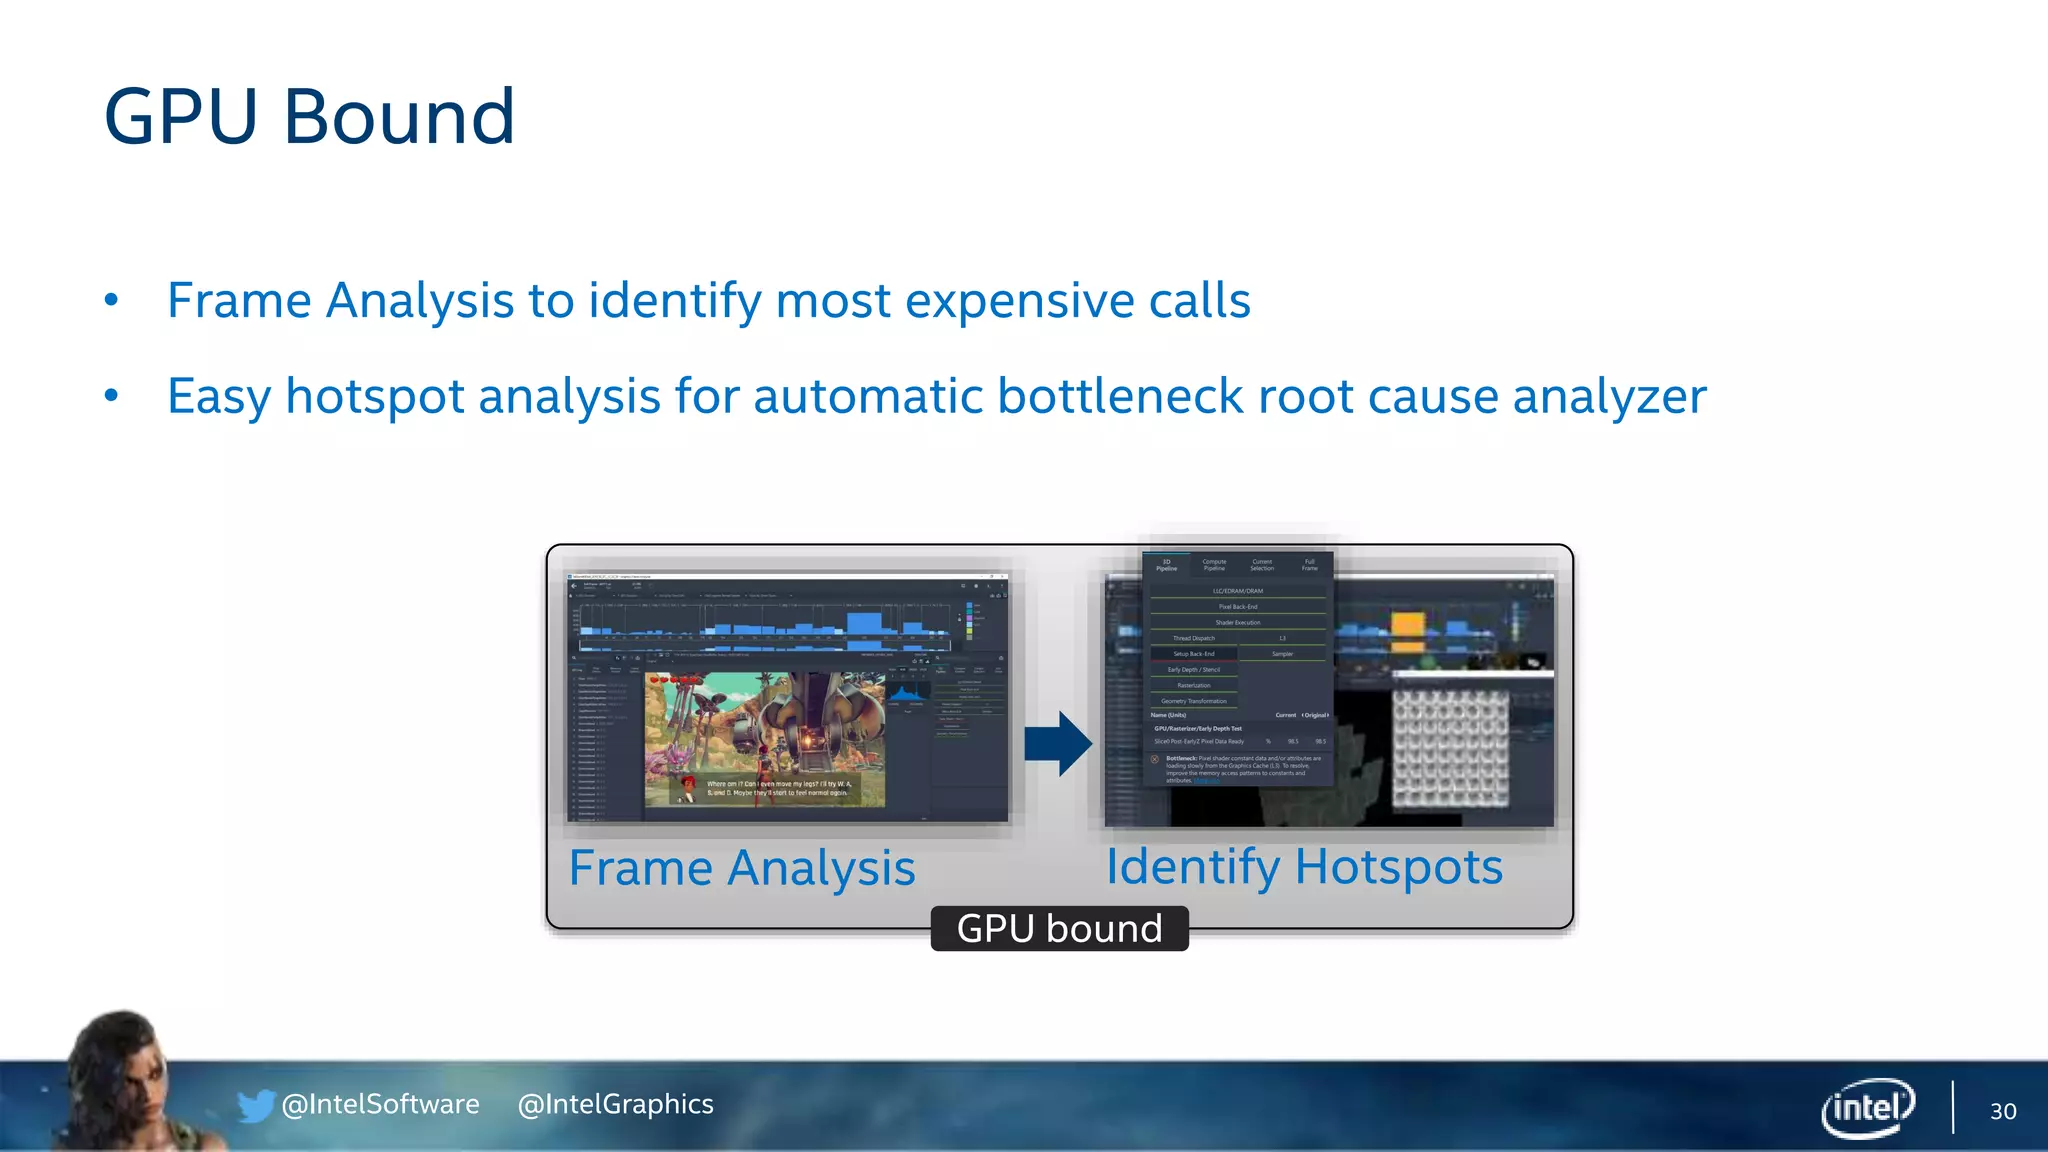
Details the workflow for profiling graphics performance, including identifying bottlenecks and hotspots in GPU/CPU performance.
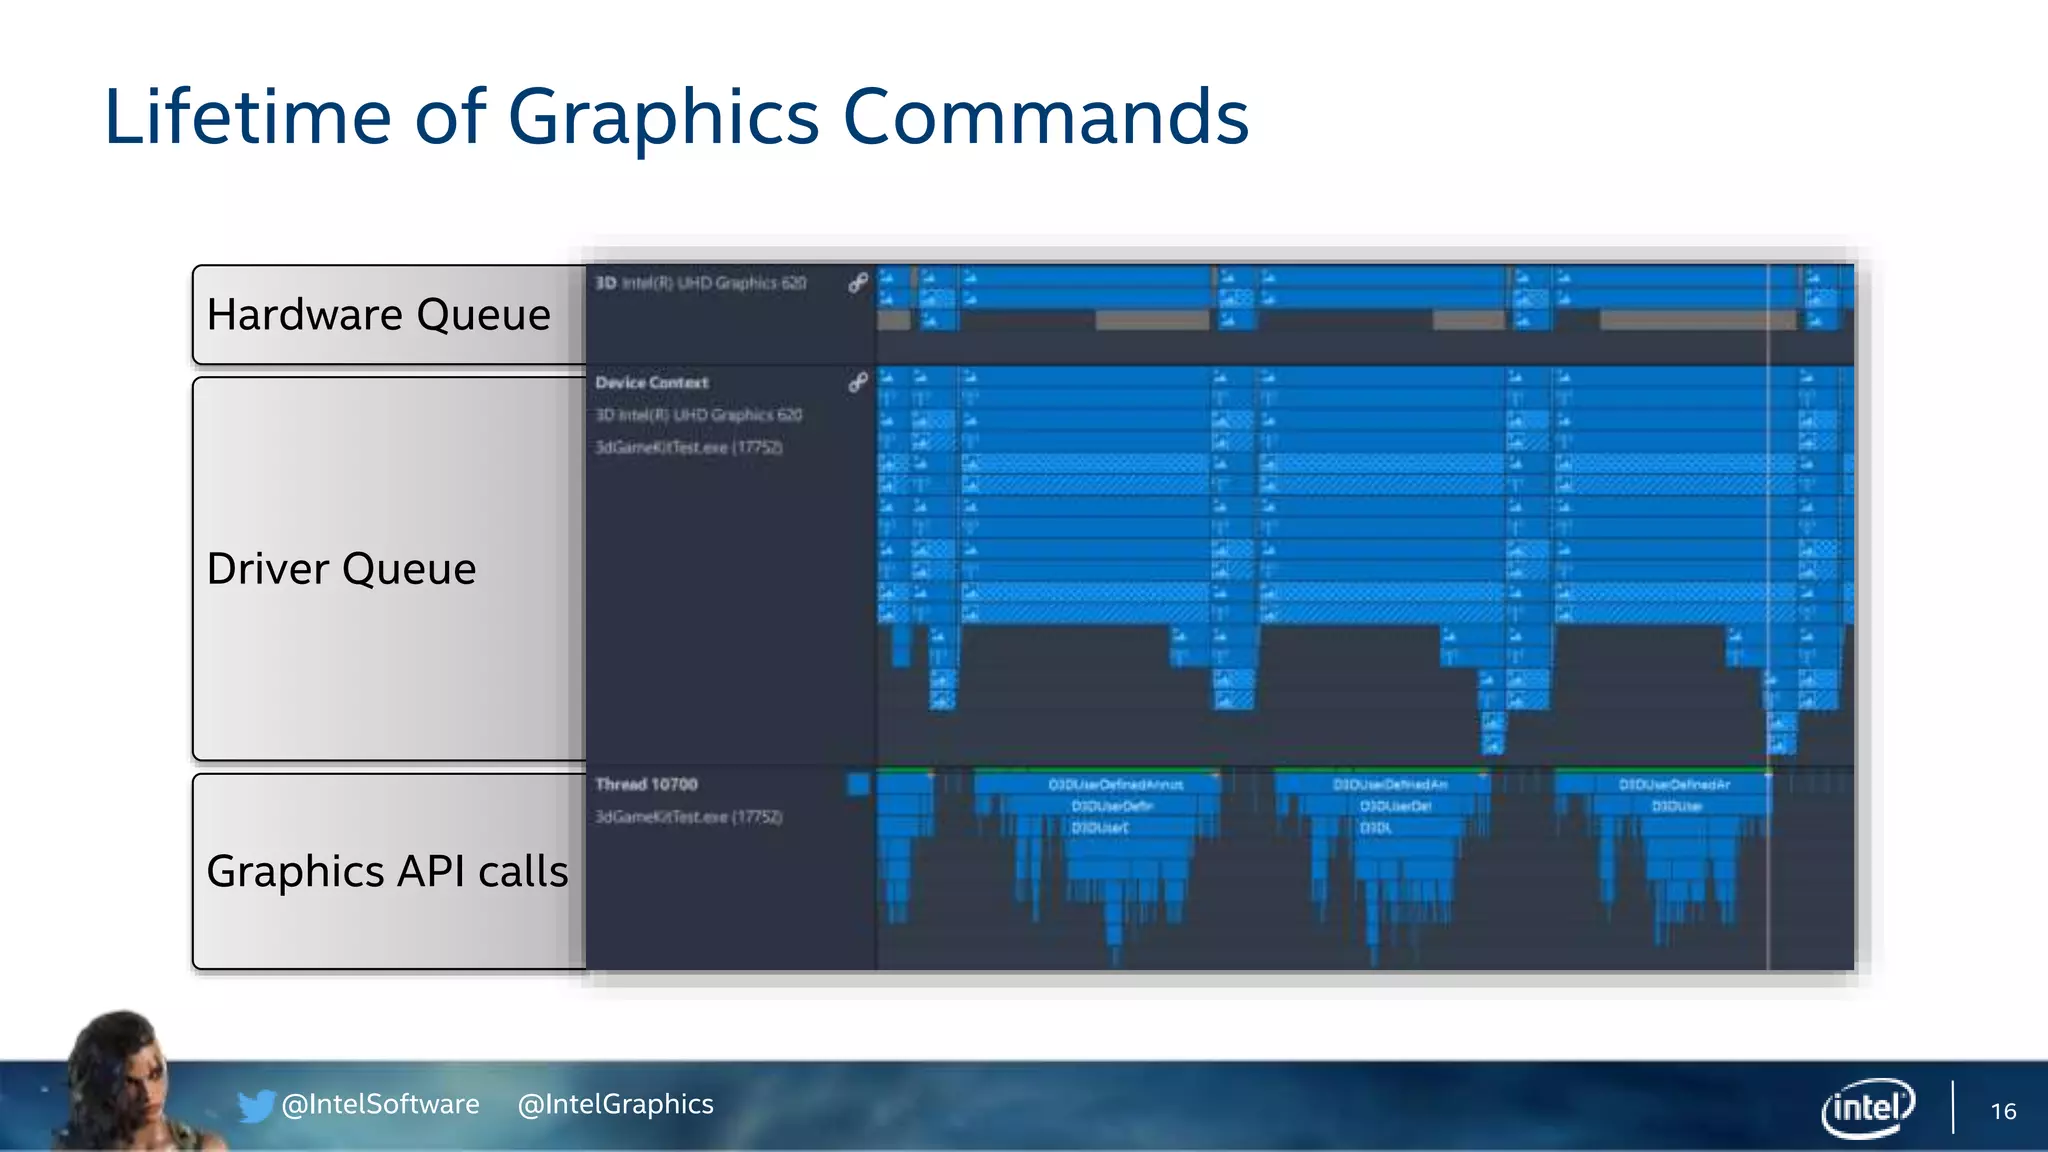
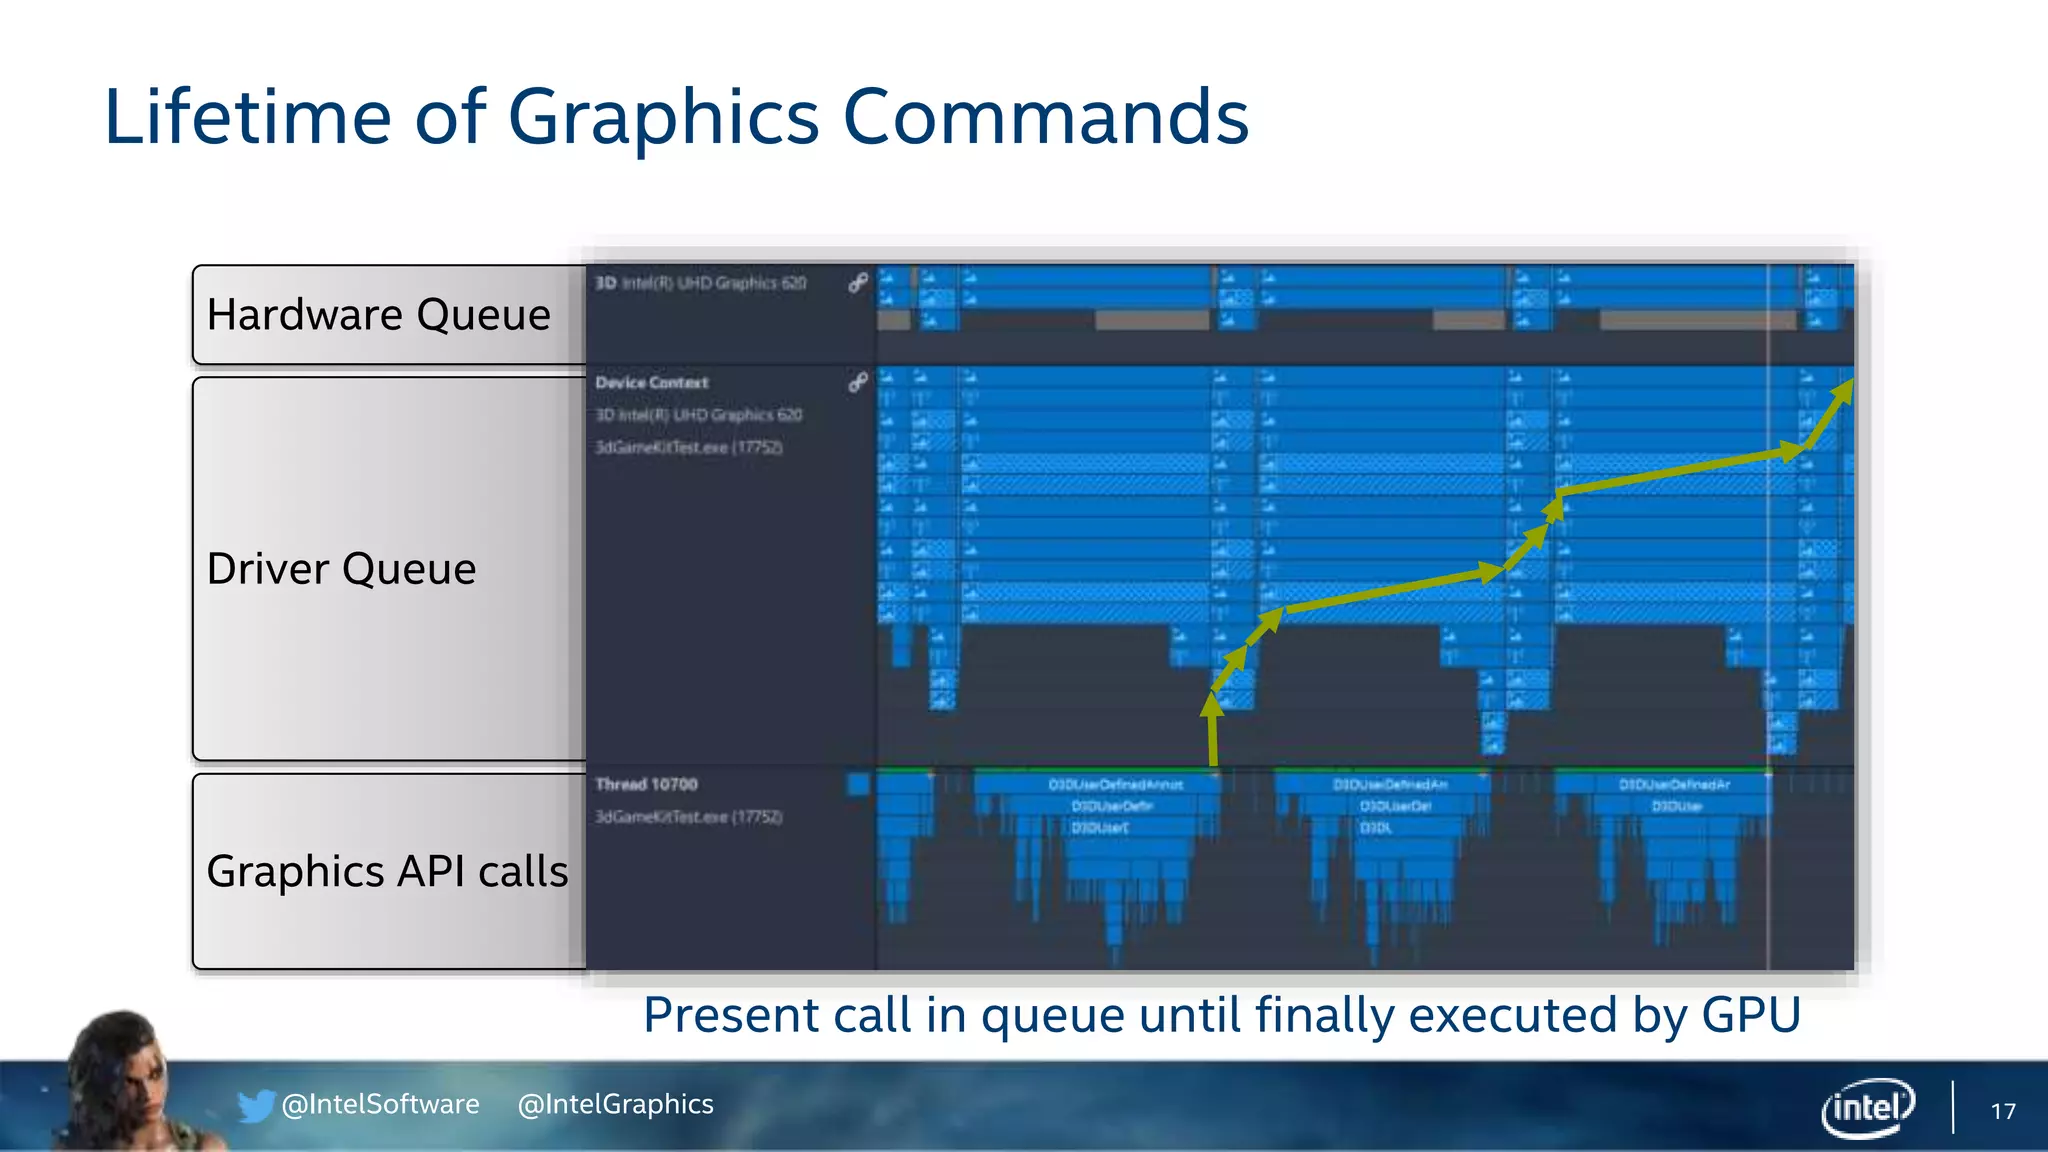
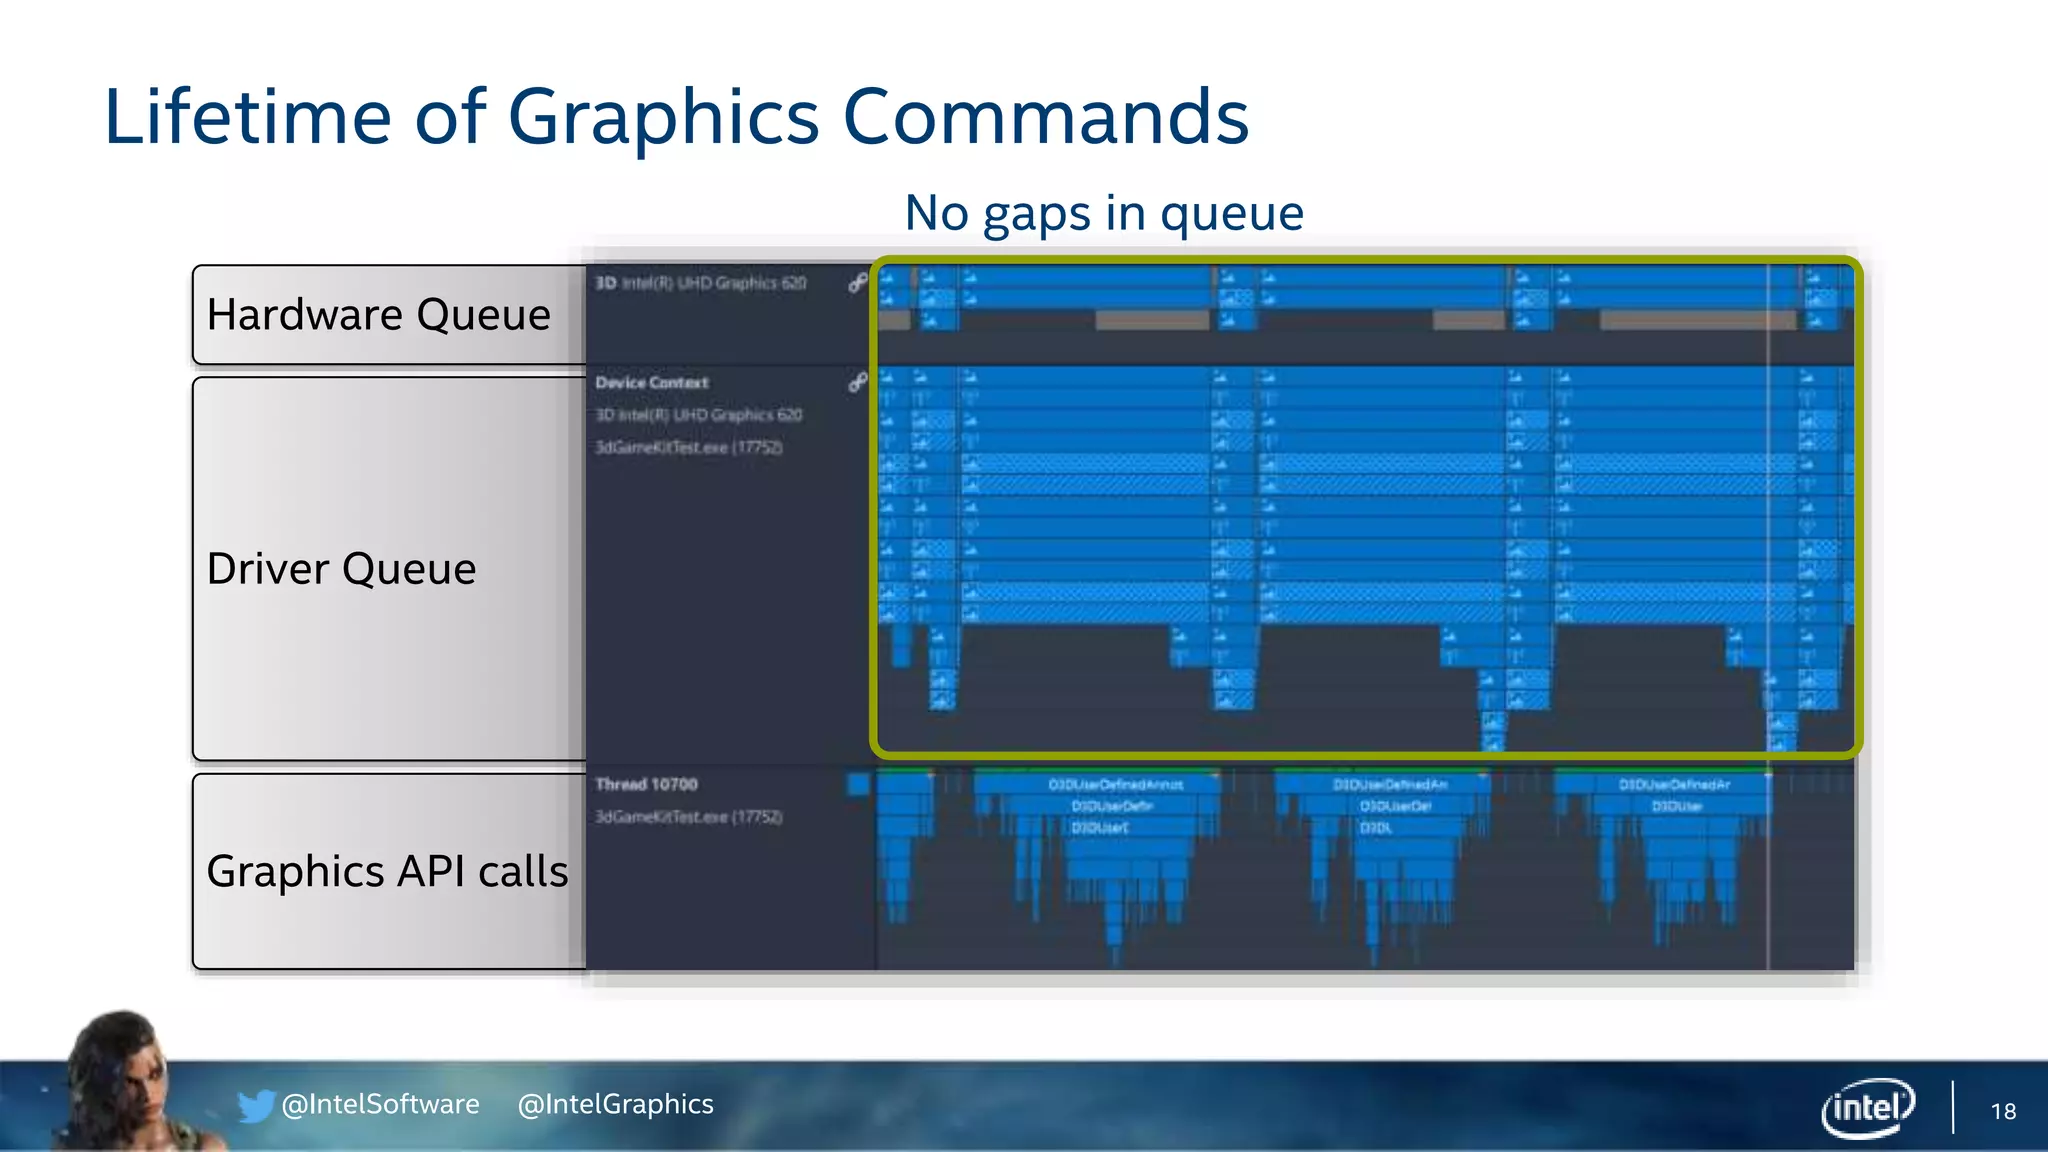
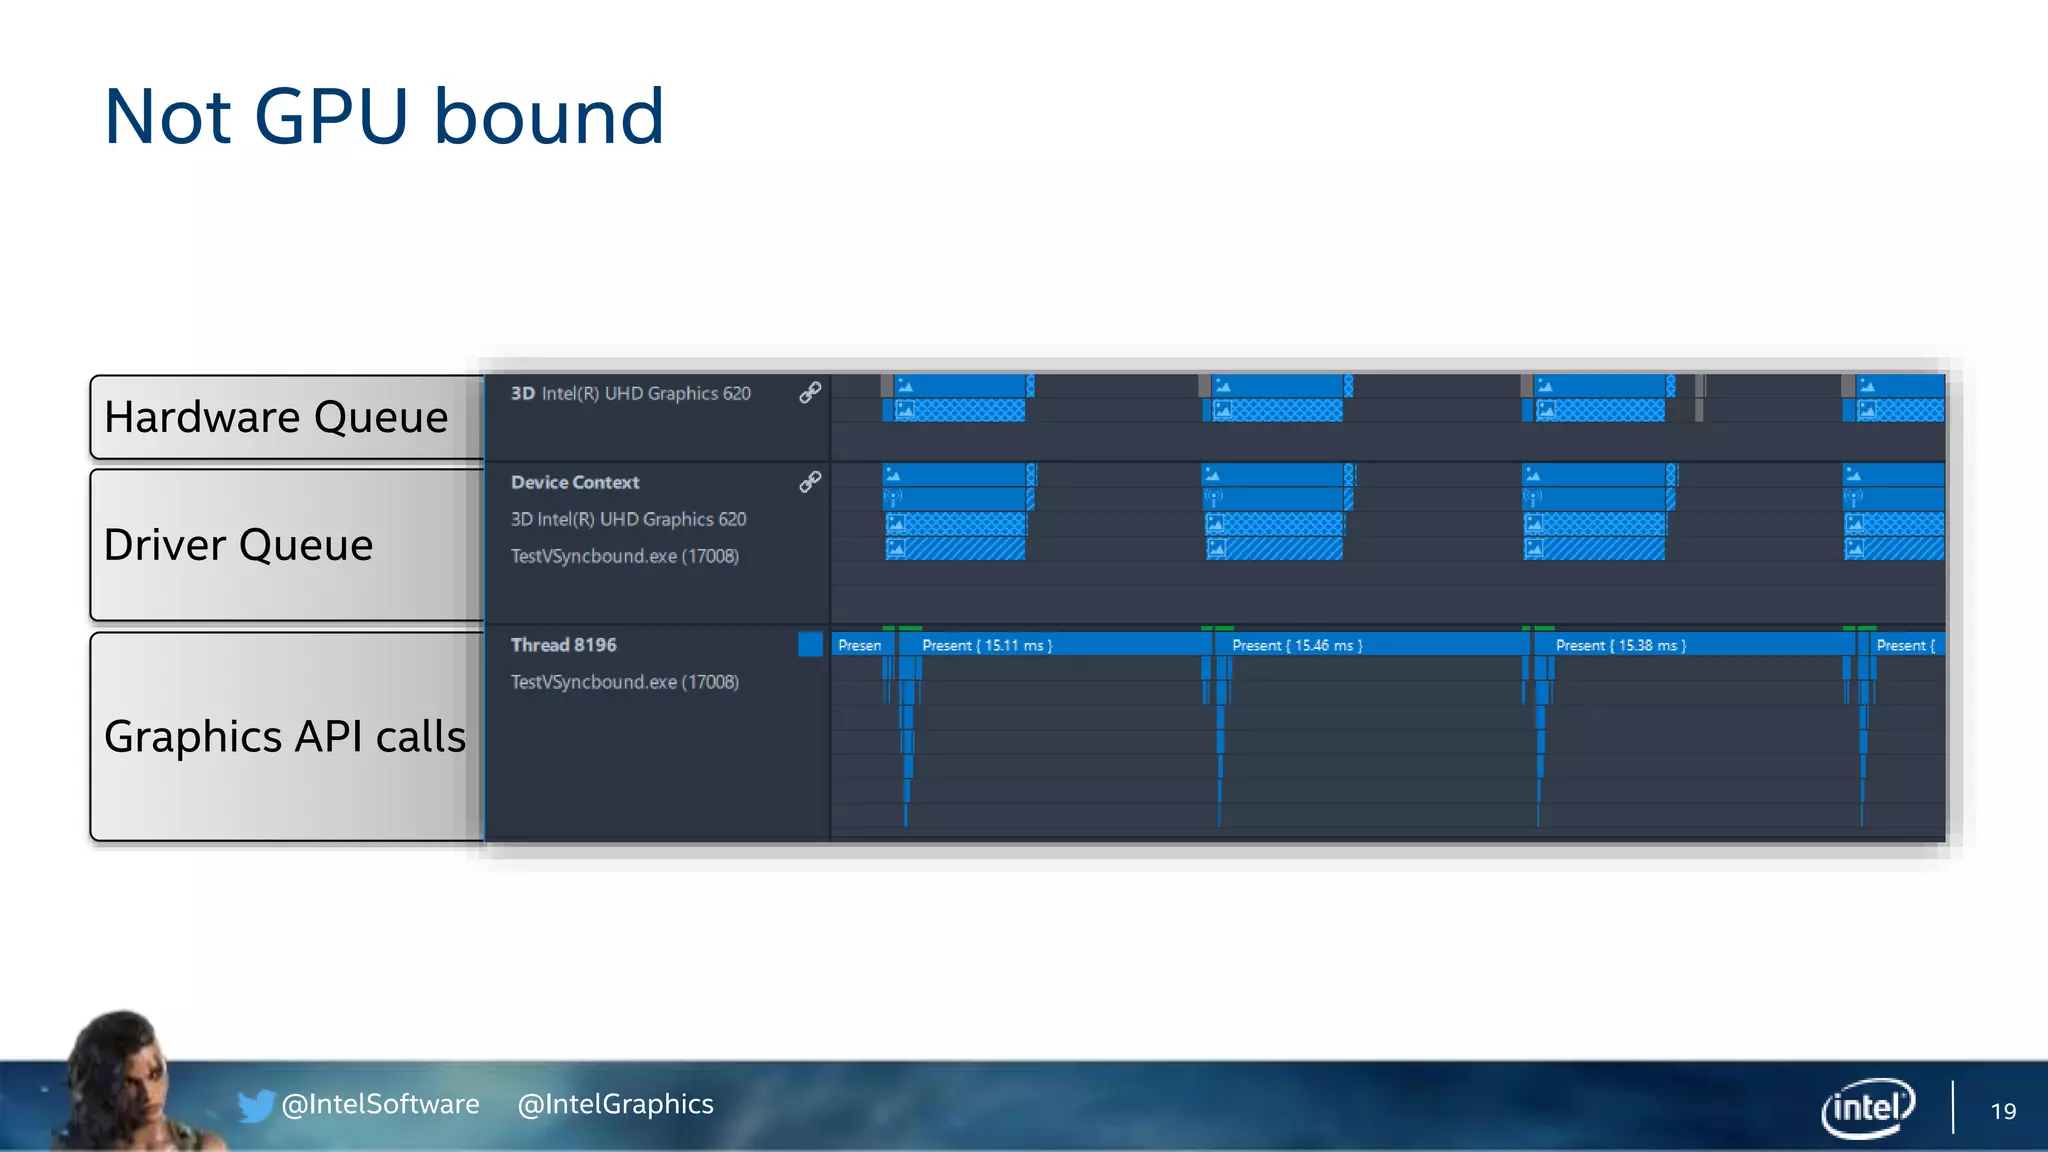
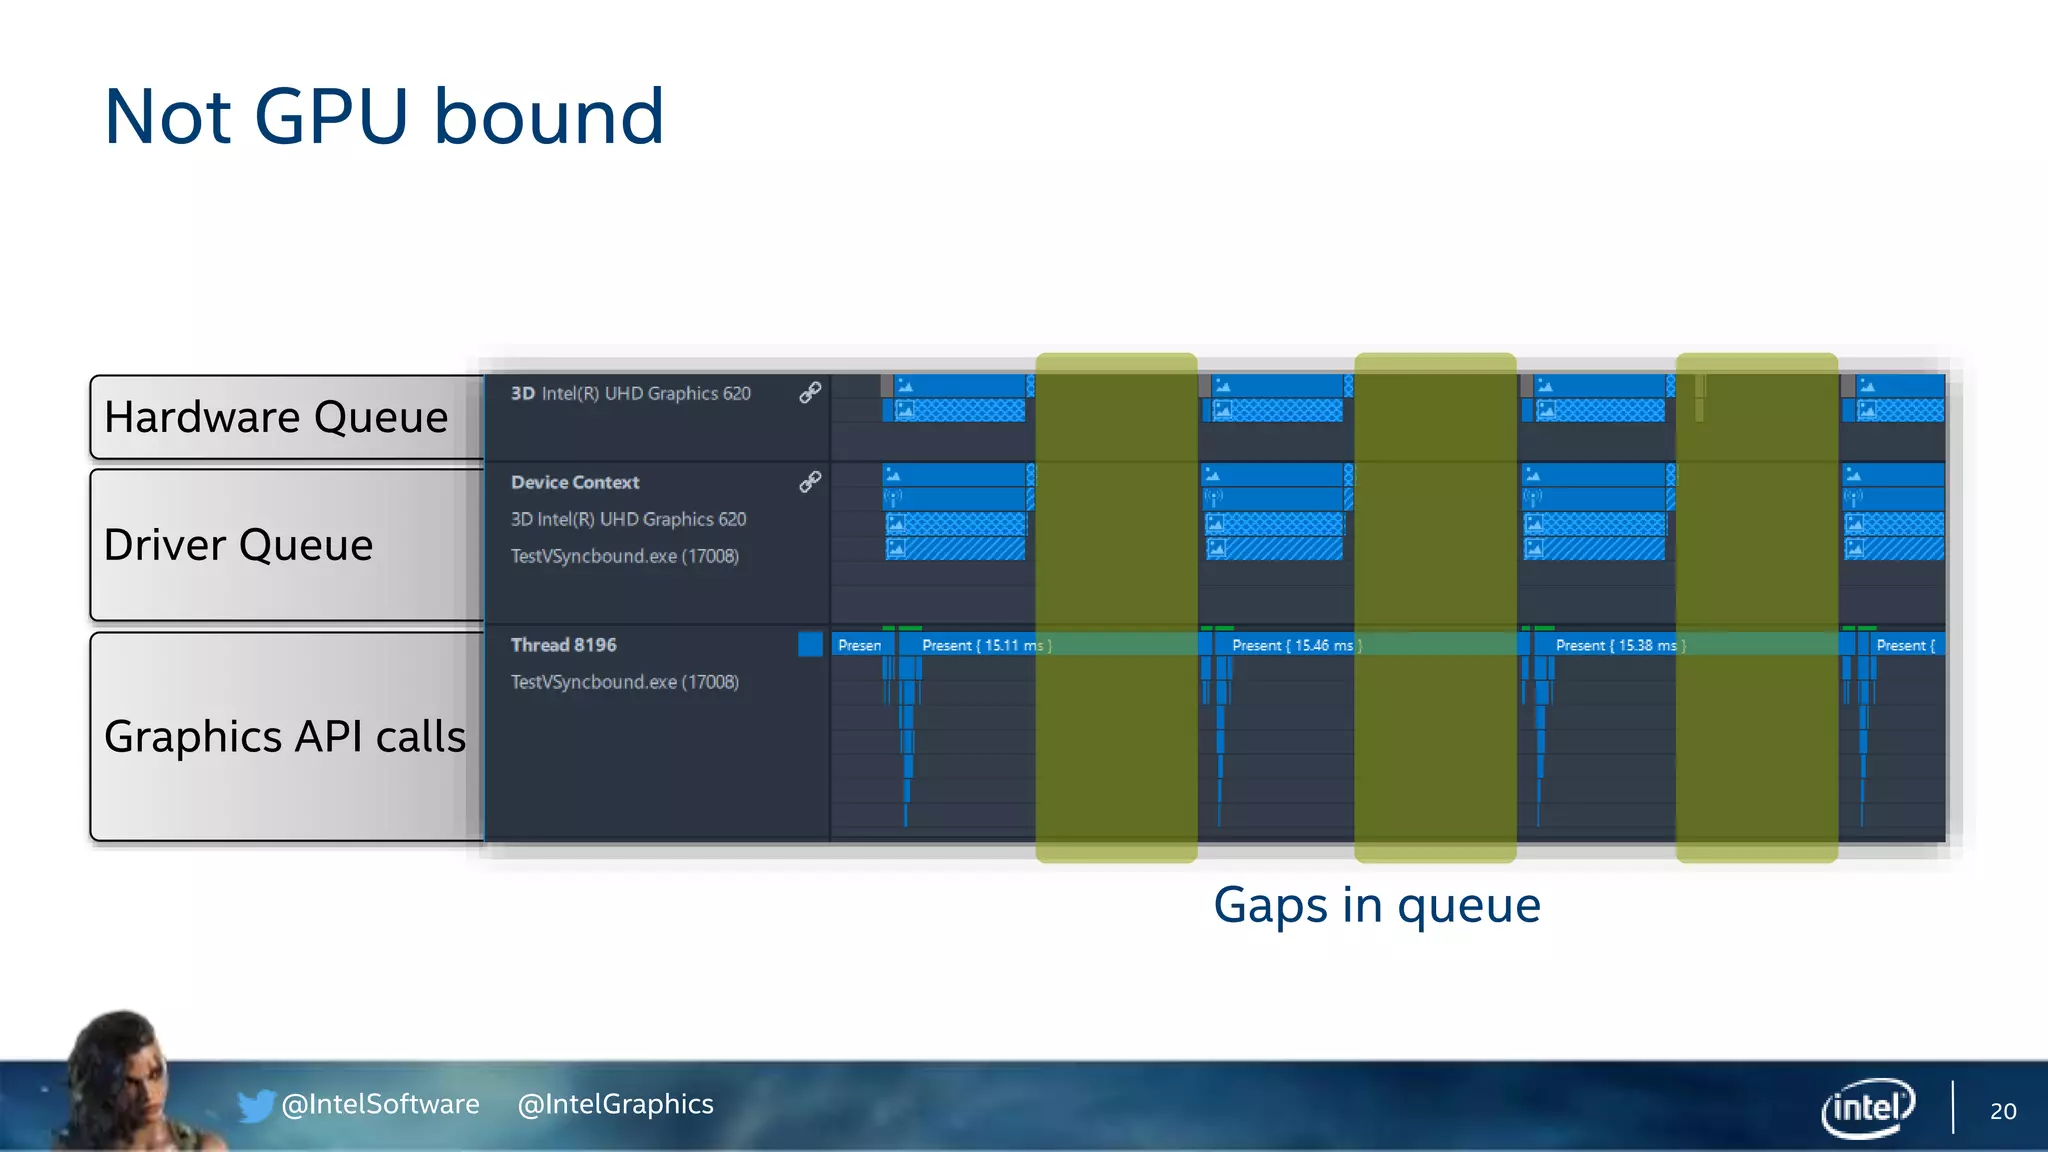
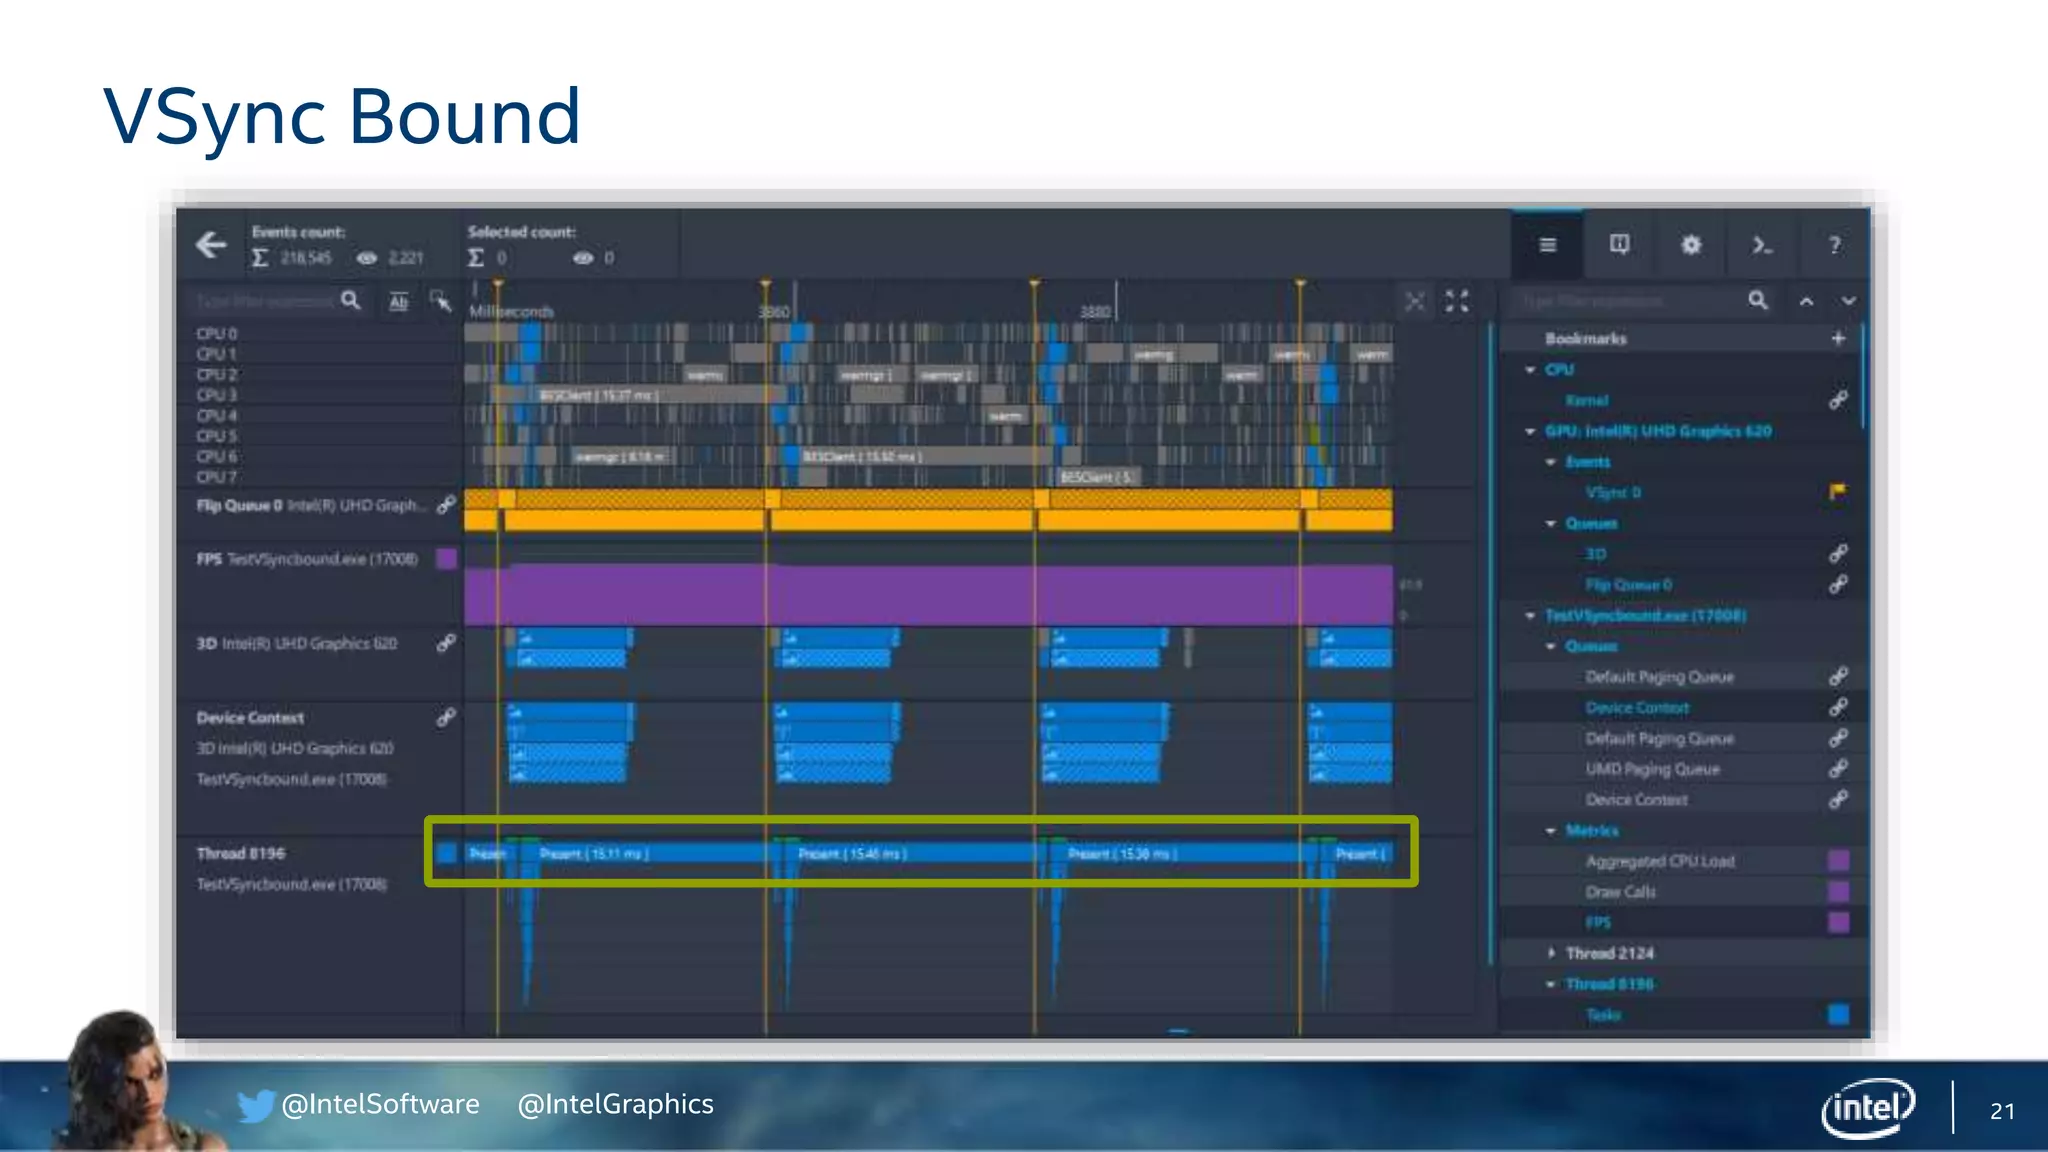
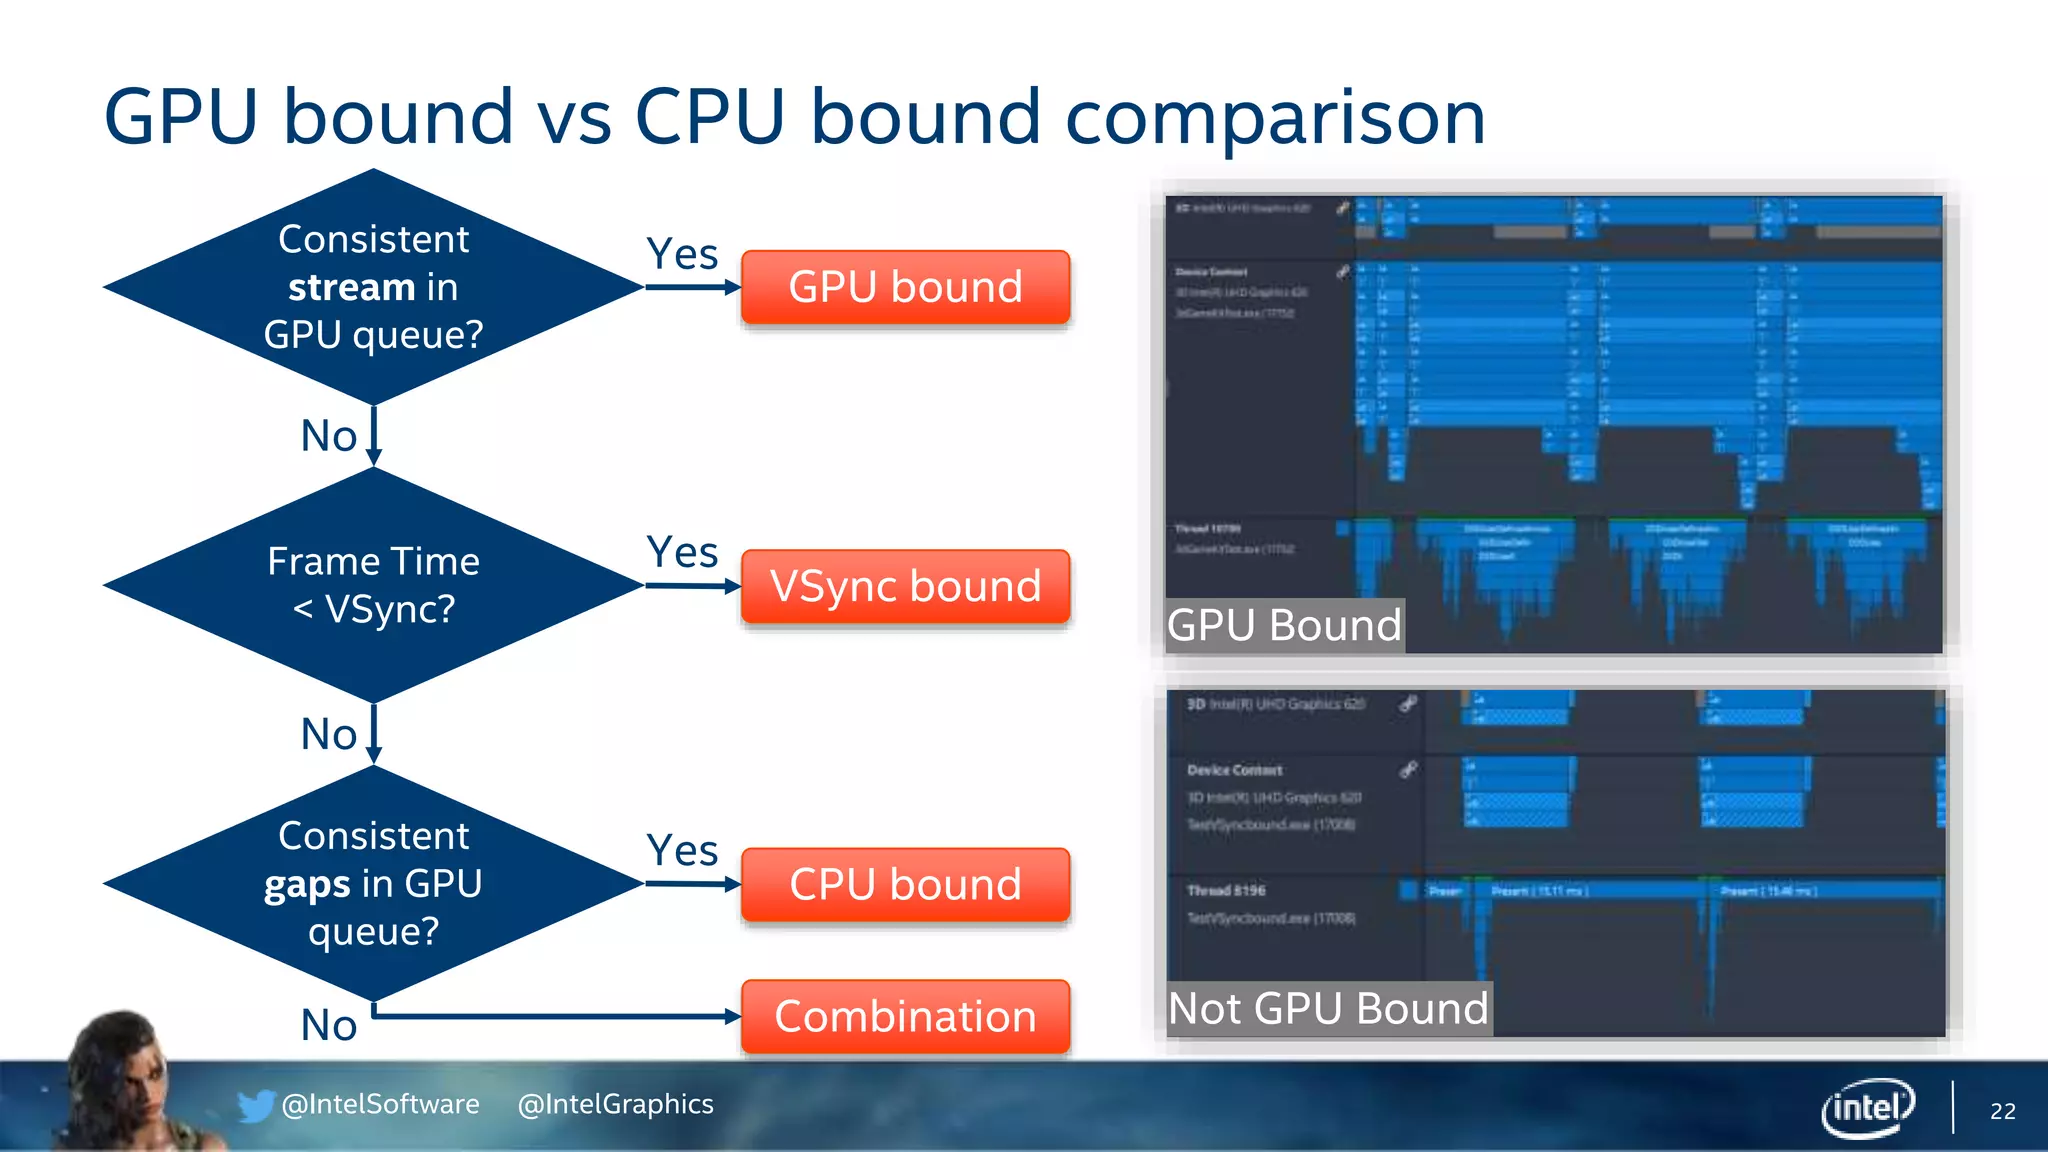
Analyzes the lifetime of graphics commands and identifies scenarios of being GPU bound, VSync bound, or CPU bound.
Identifies factors distinguishing GPU bound from CPU bound workloads, comparing their frame time and queue status.
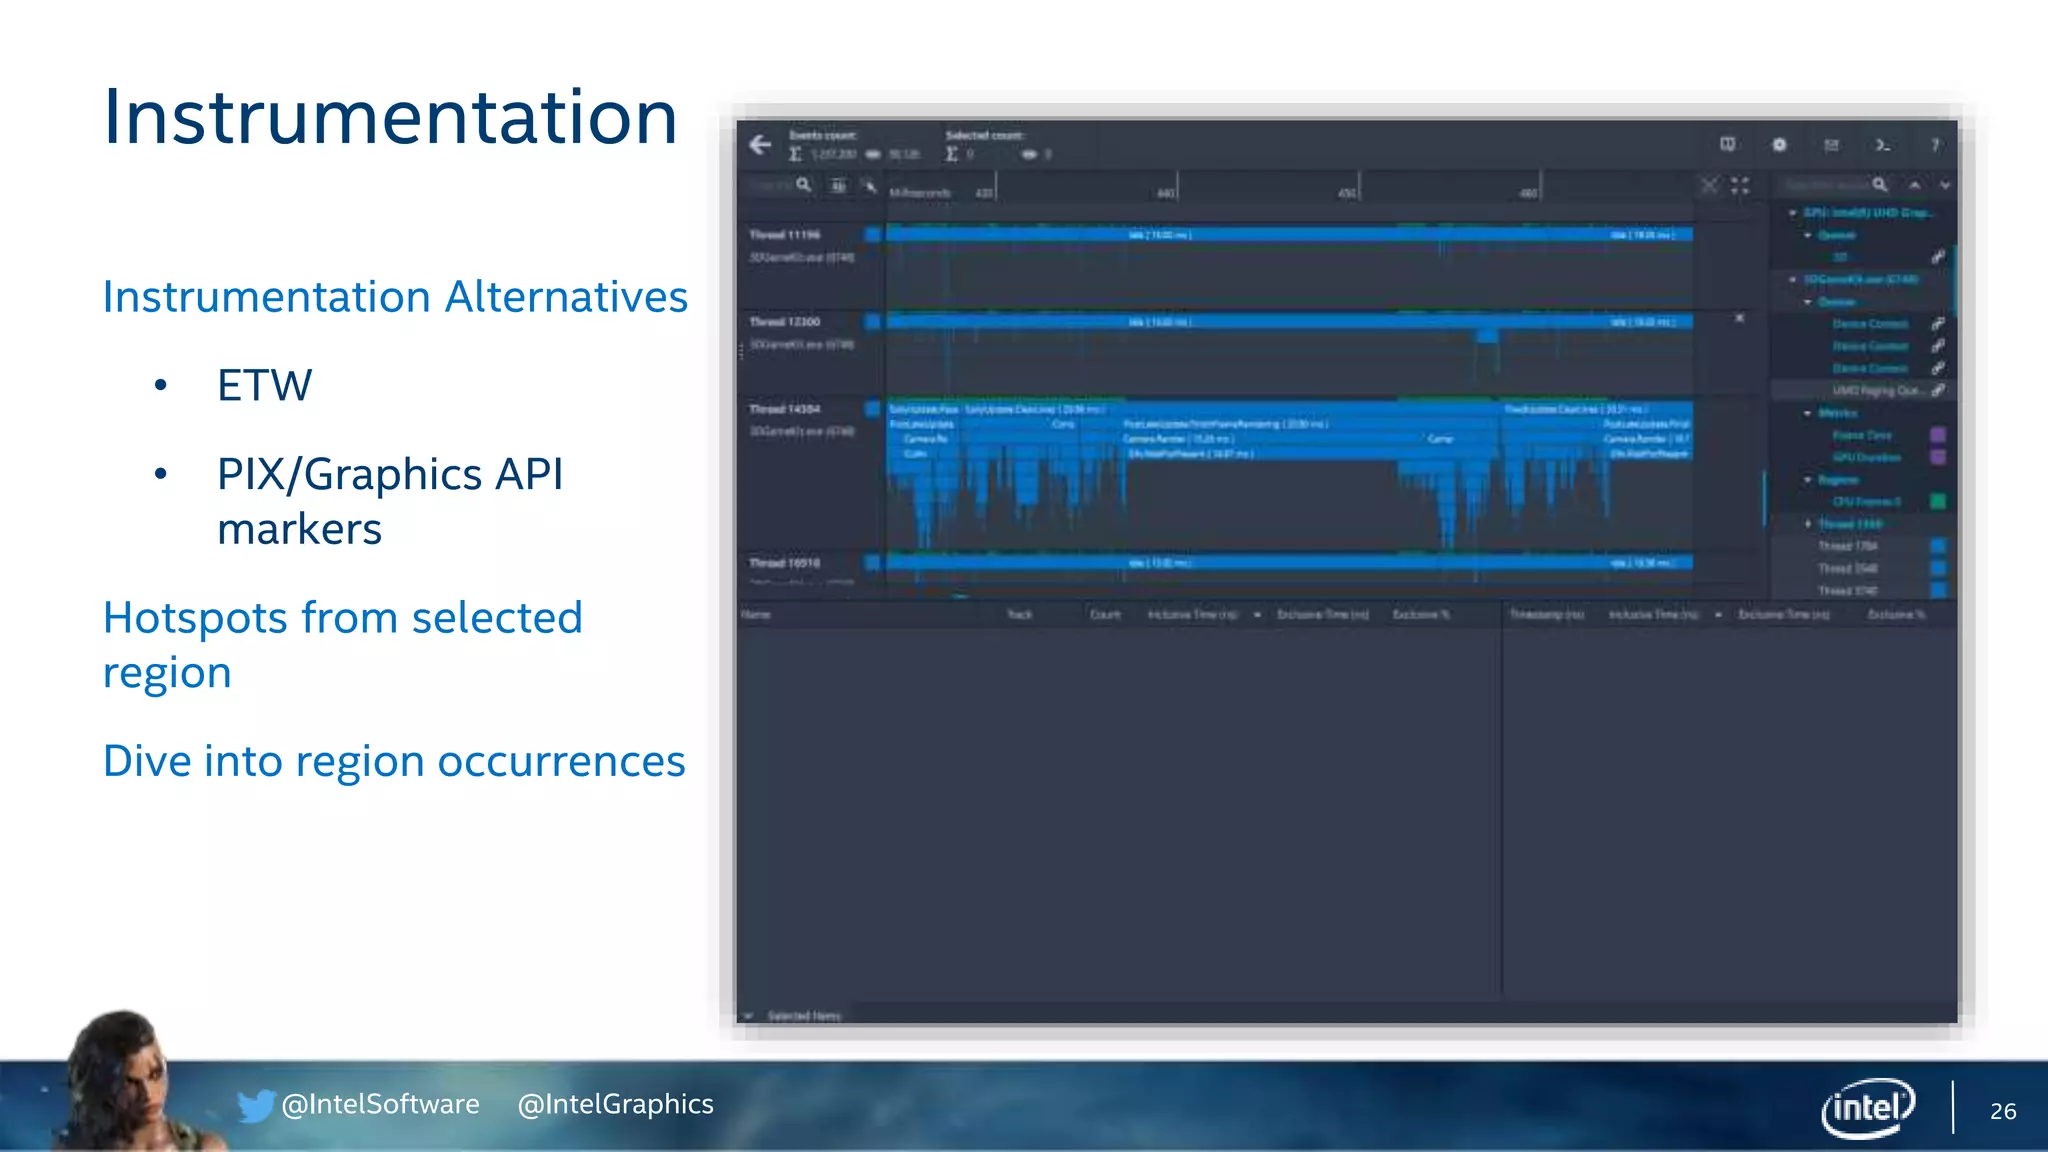
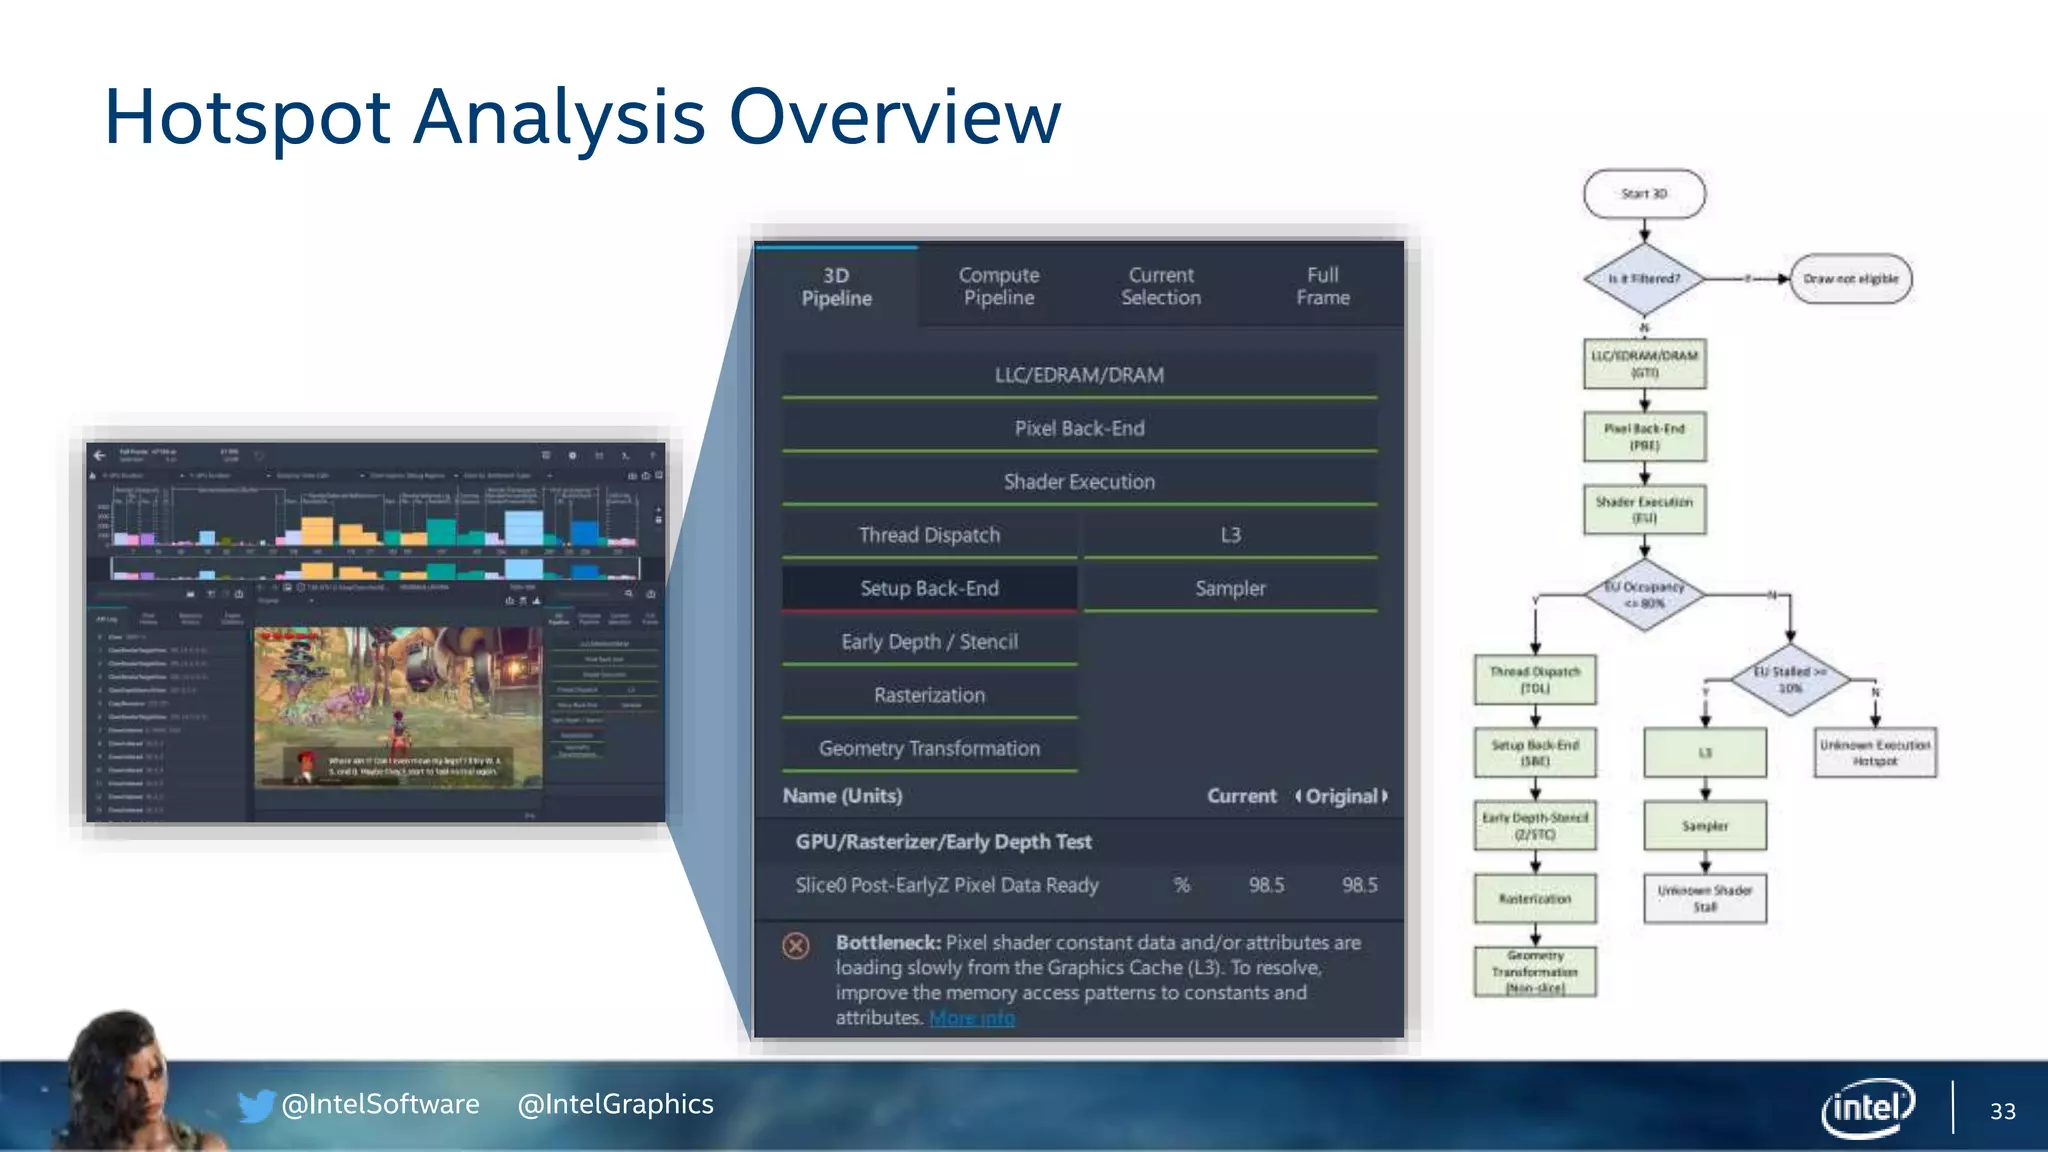
Discusses methods for identifying hotspots through instrumentation alternatives and profiling workflows.
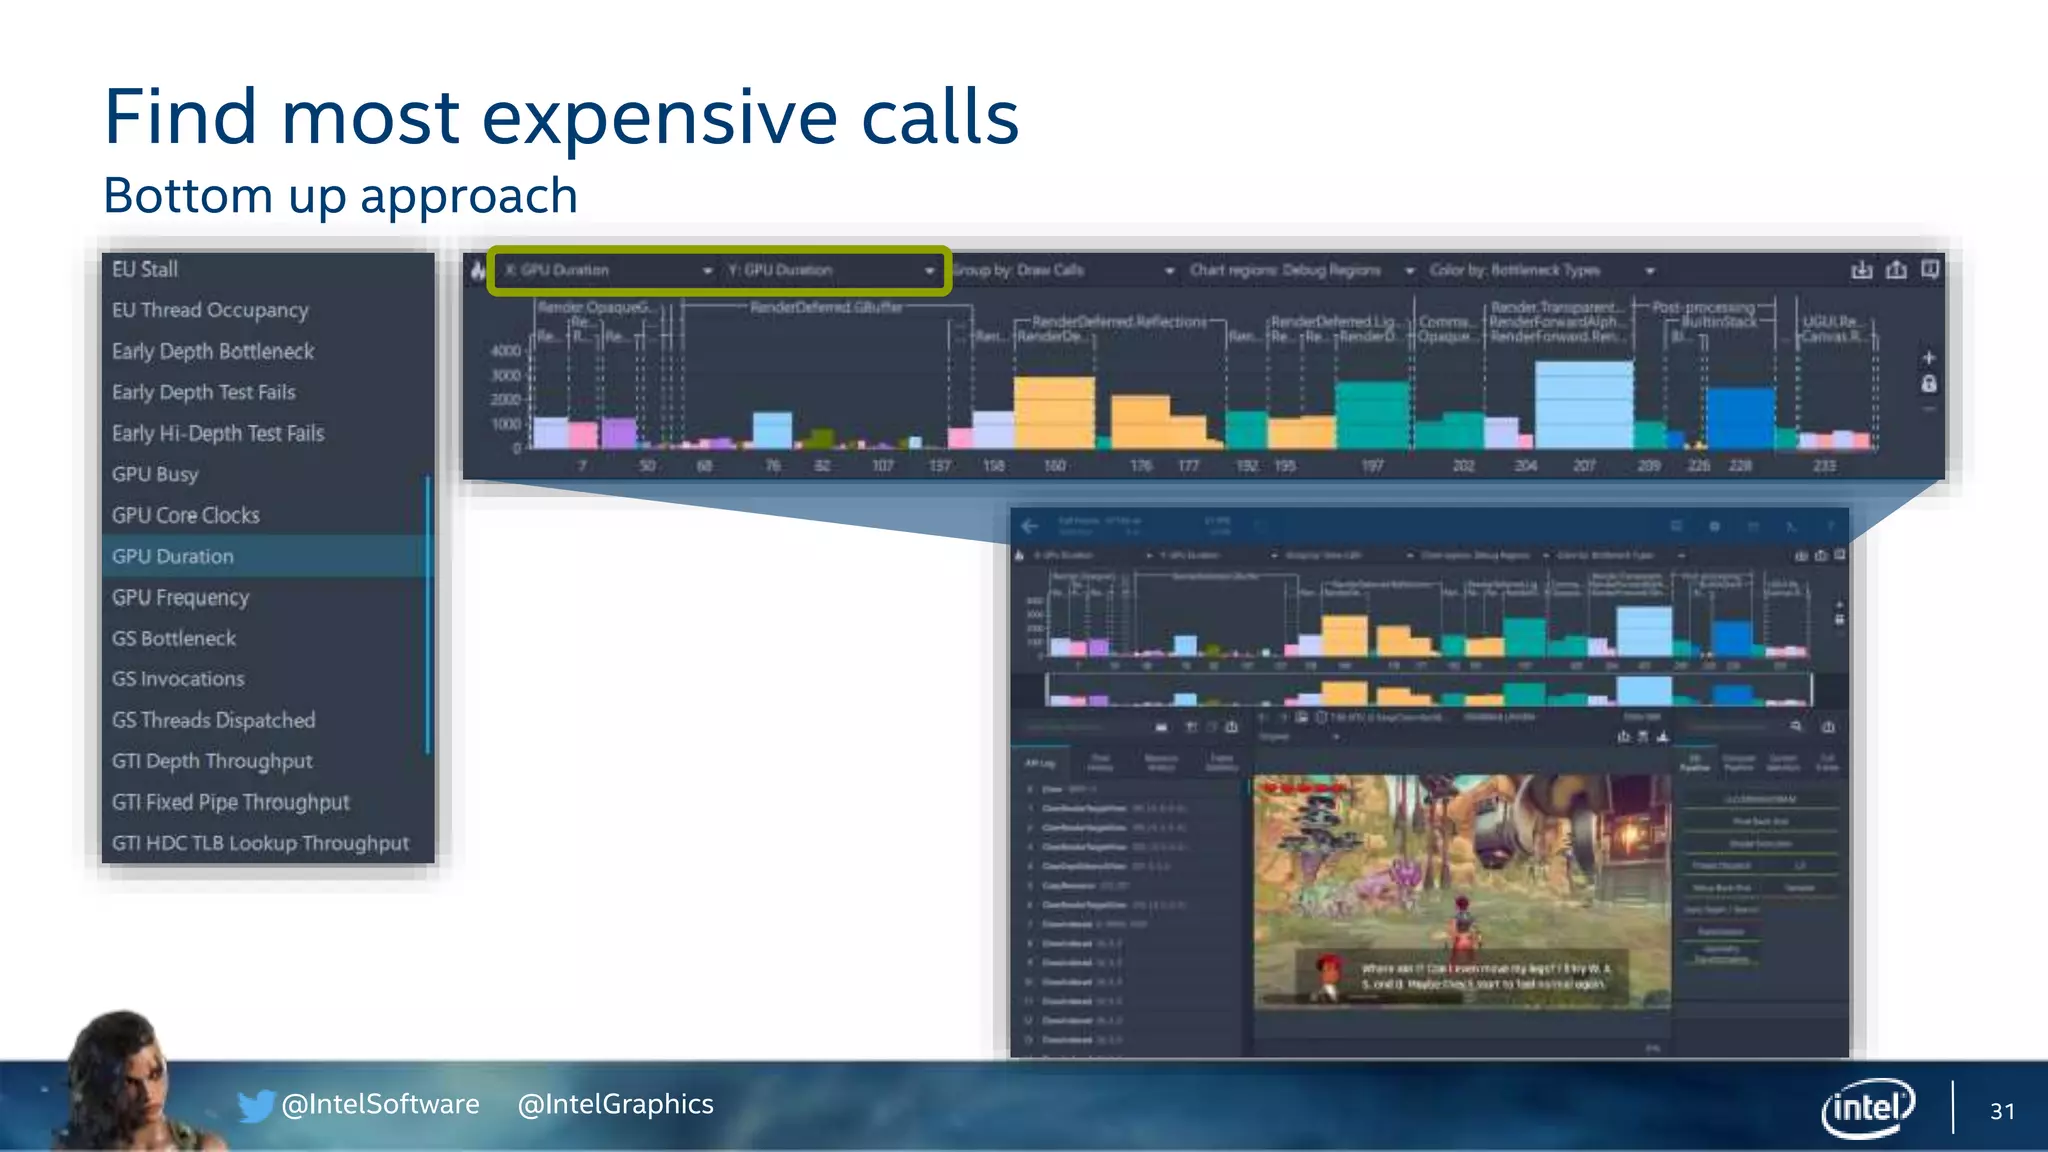
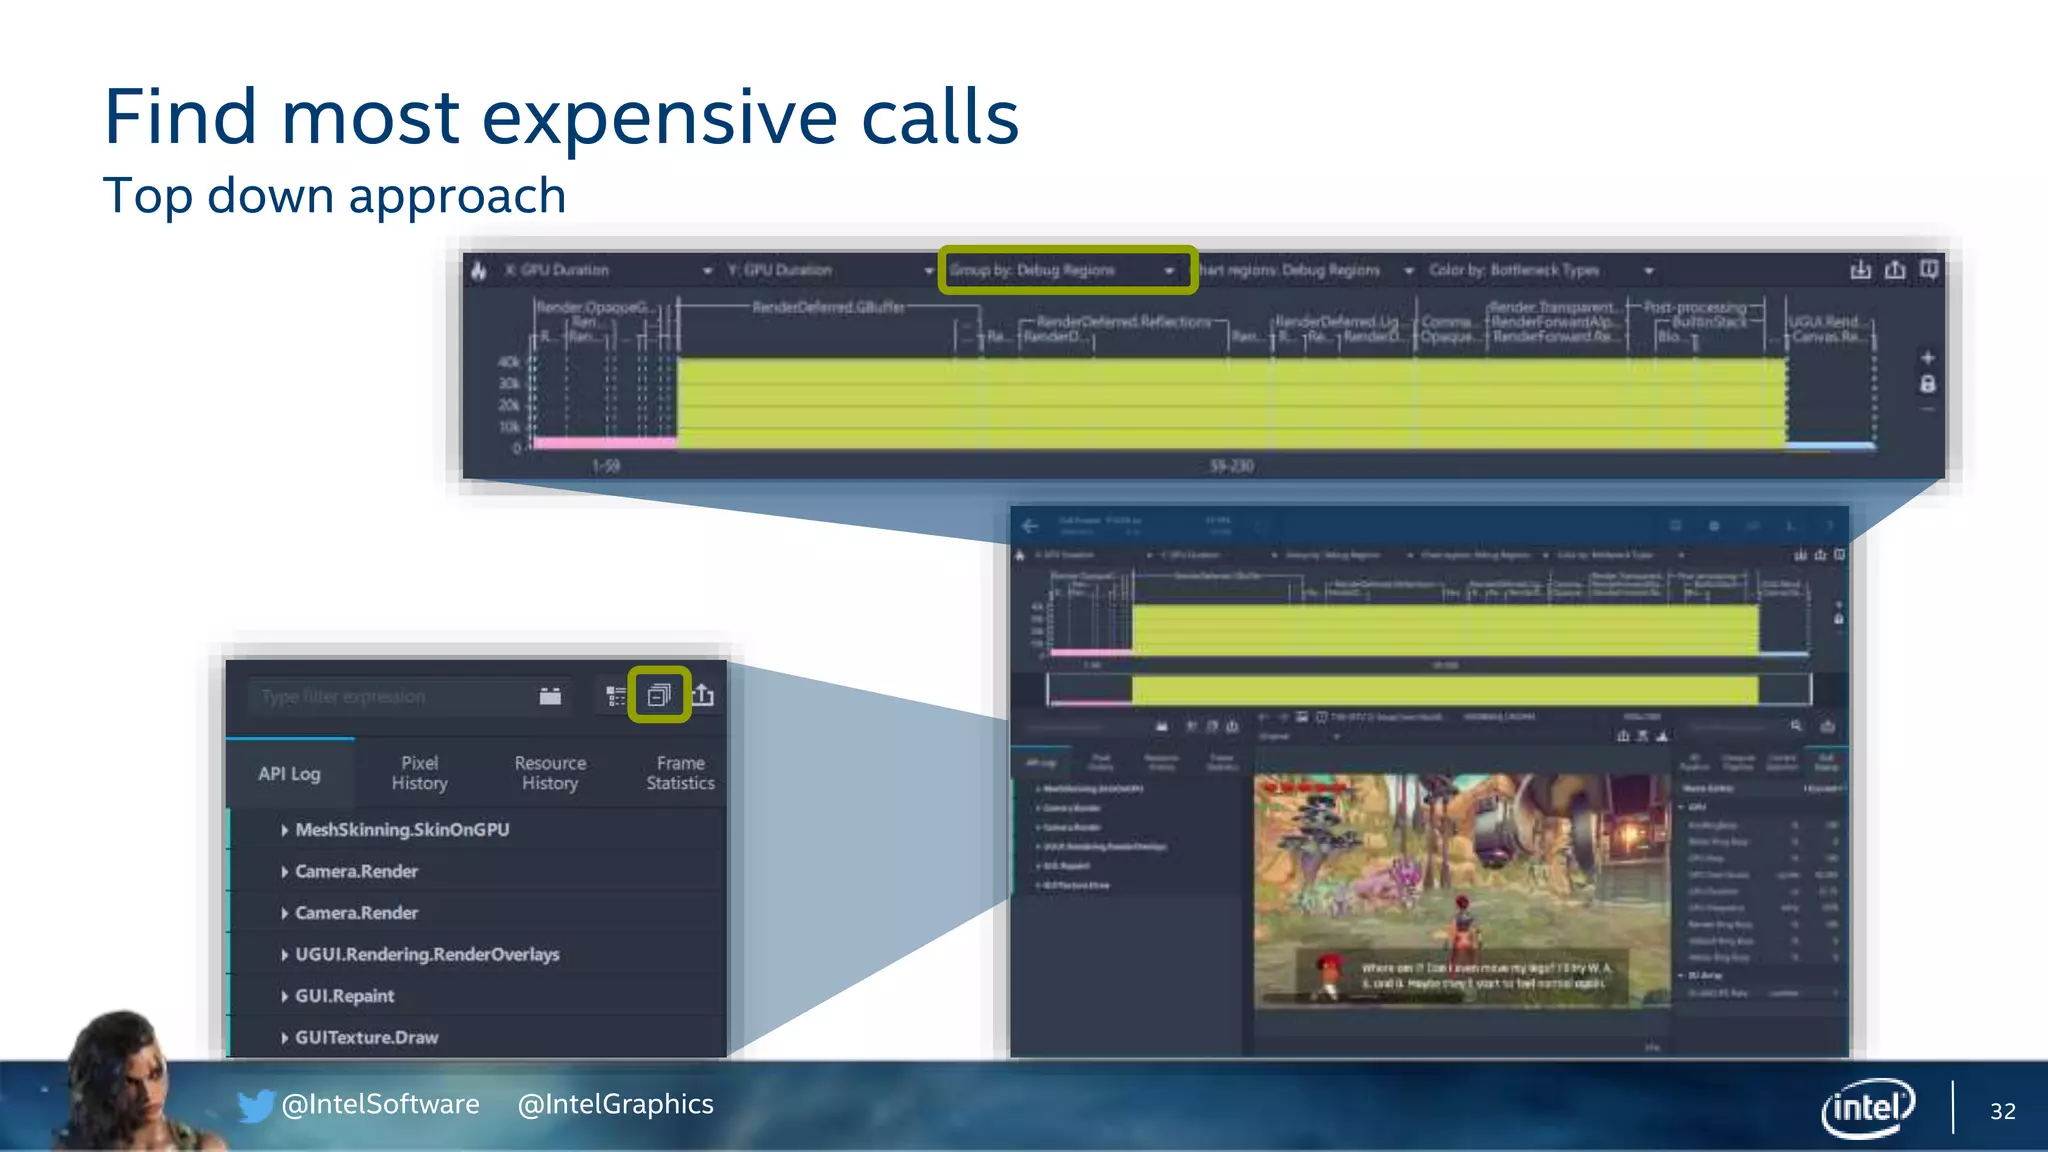
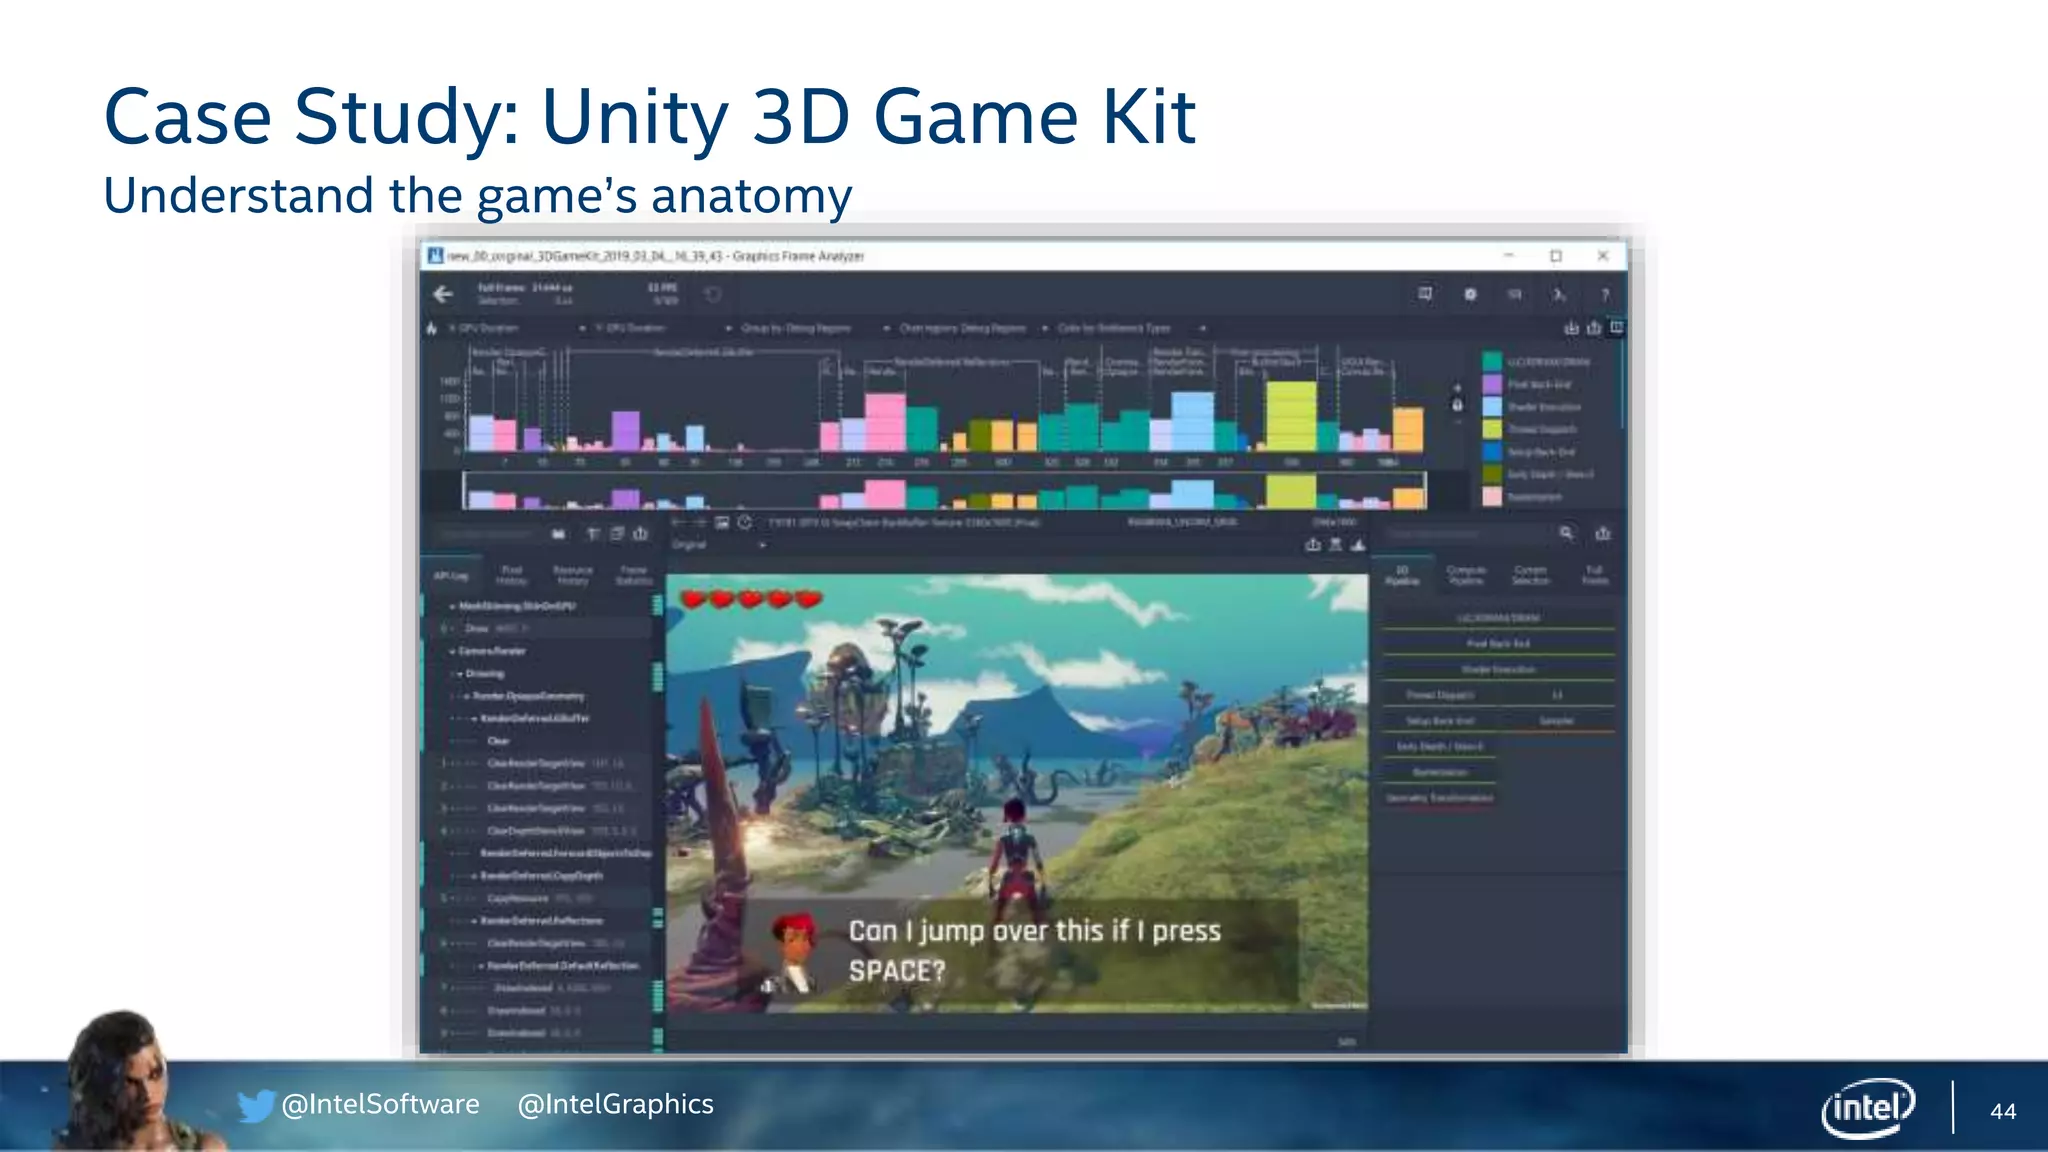
Focus on analyzing frame calls to identify performance bottlenecks and hotspots in graphics rendering.
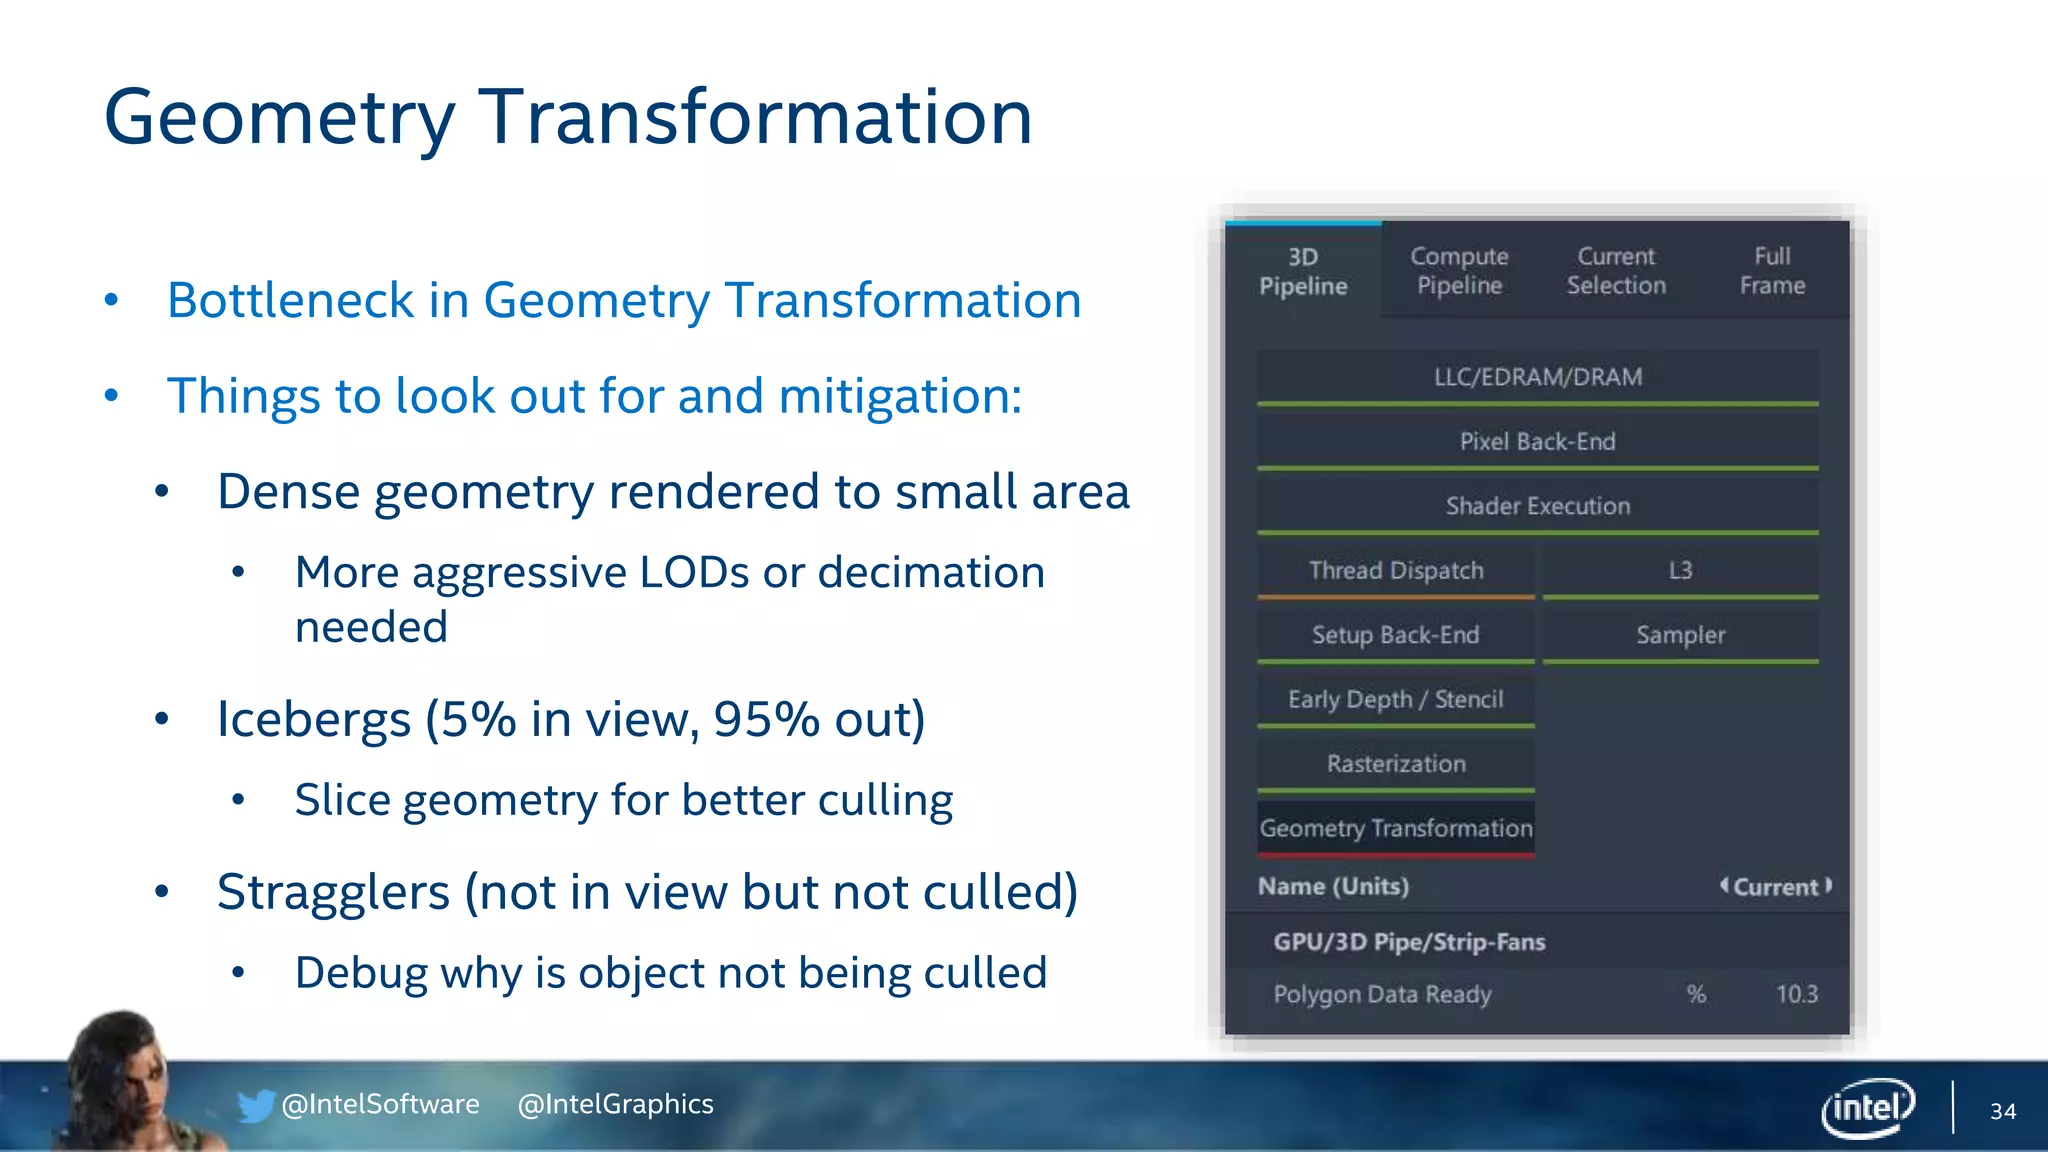
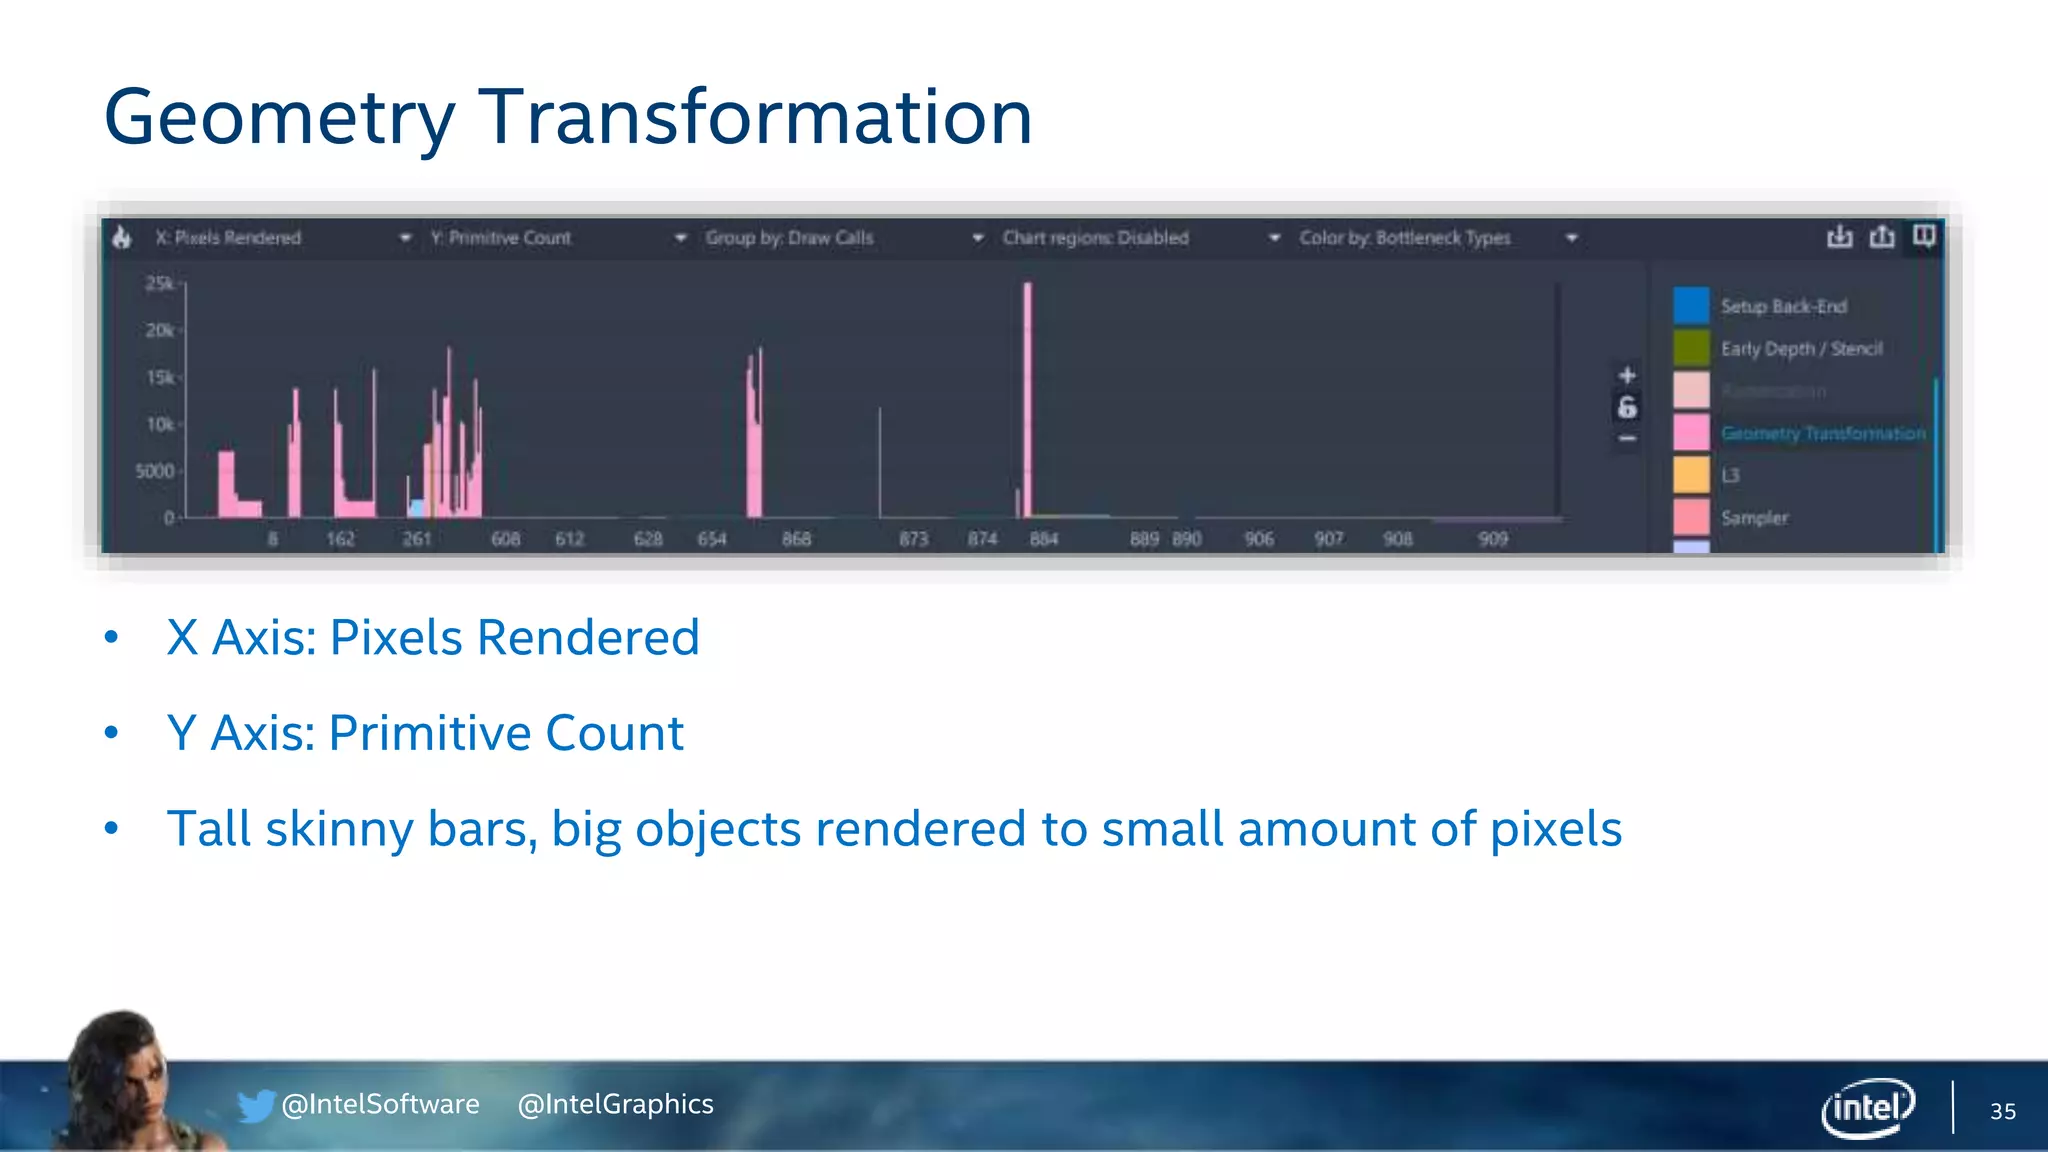
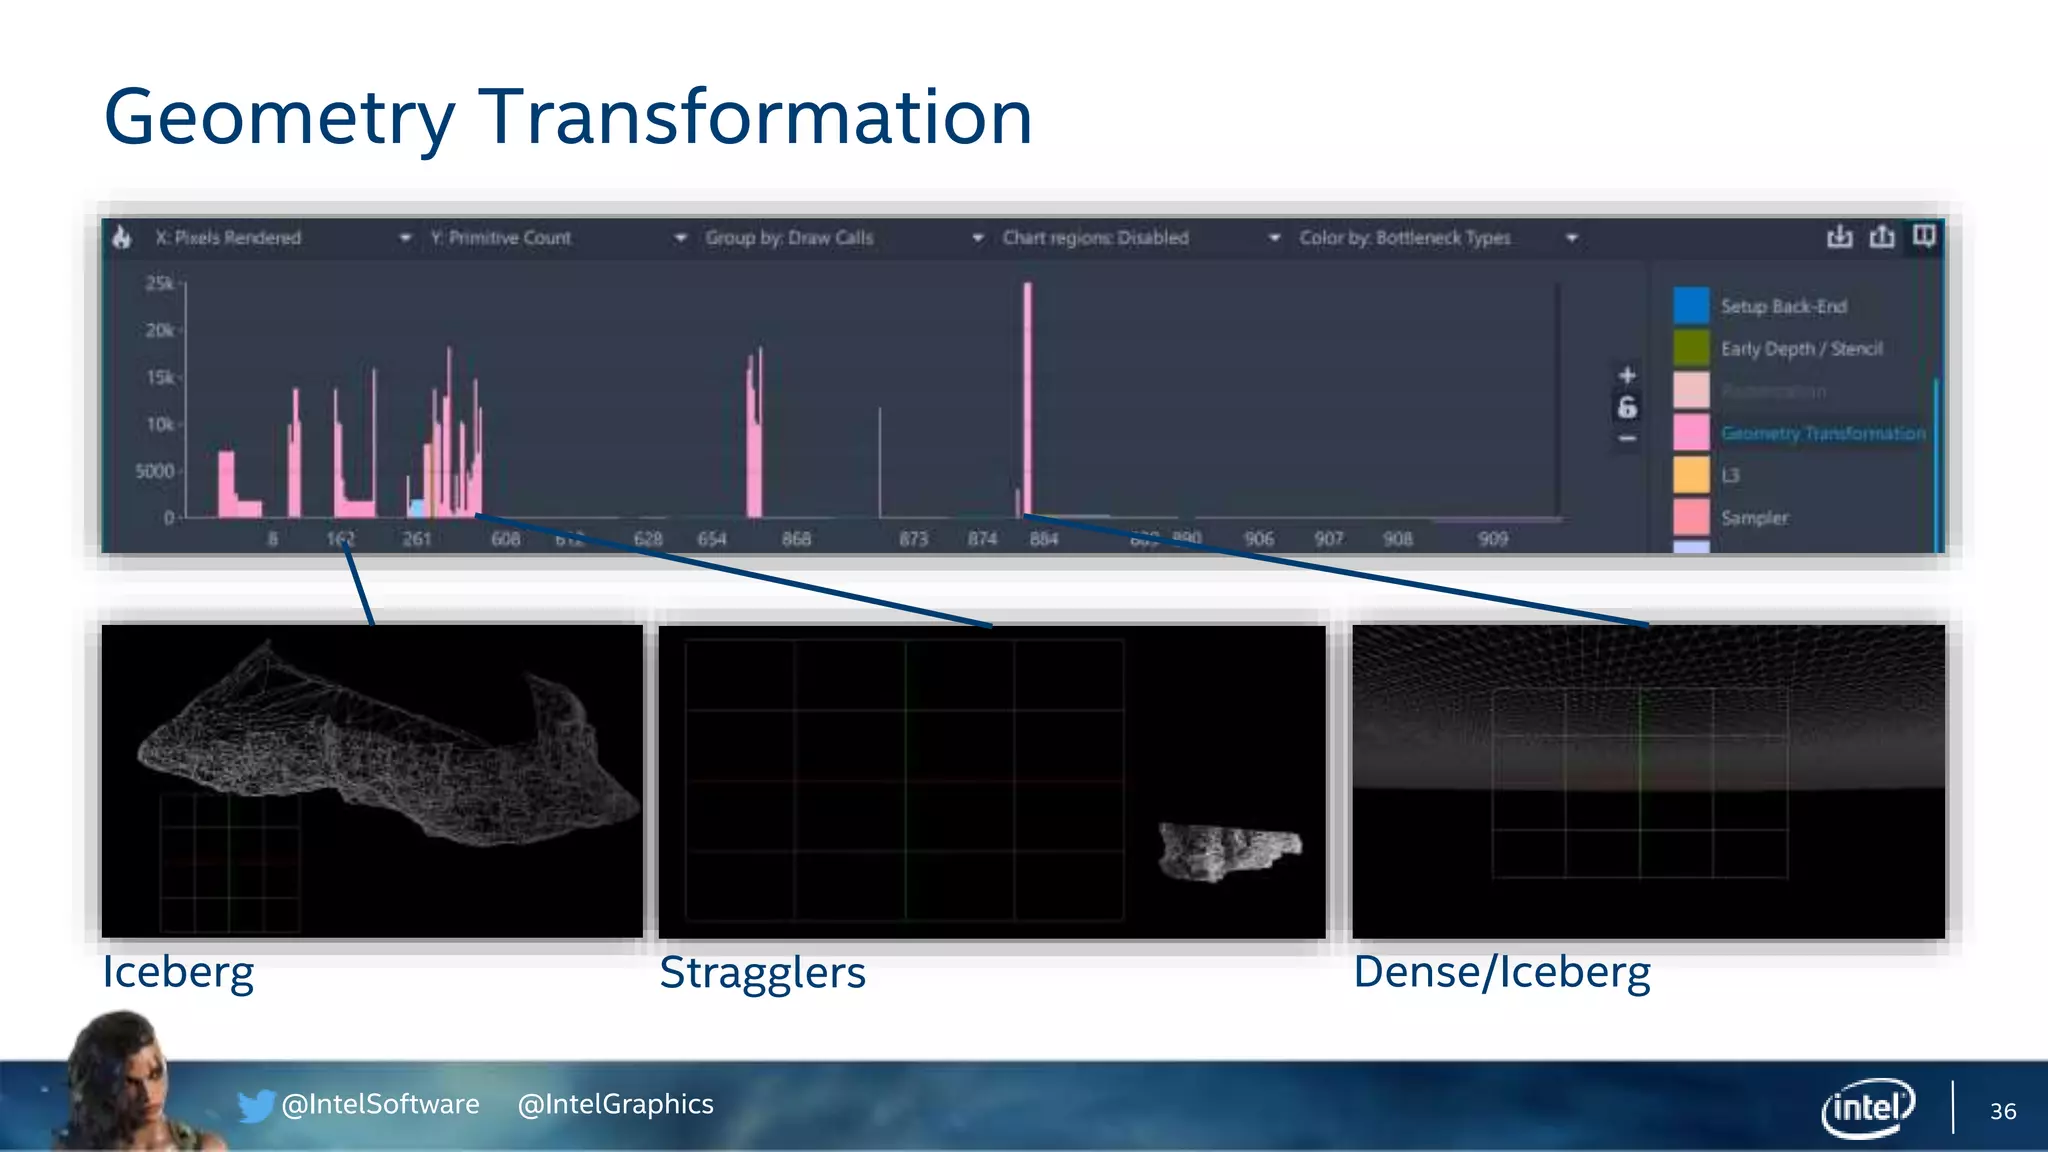
Insights into geometry transformation problems in rendering, exploring techniques for optimization and analysis.
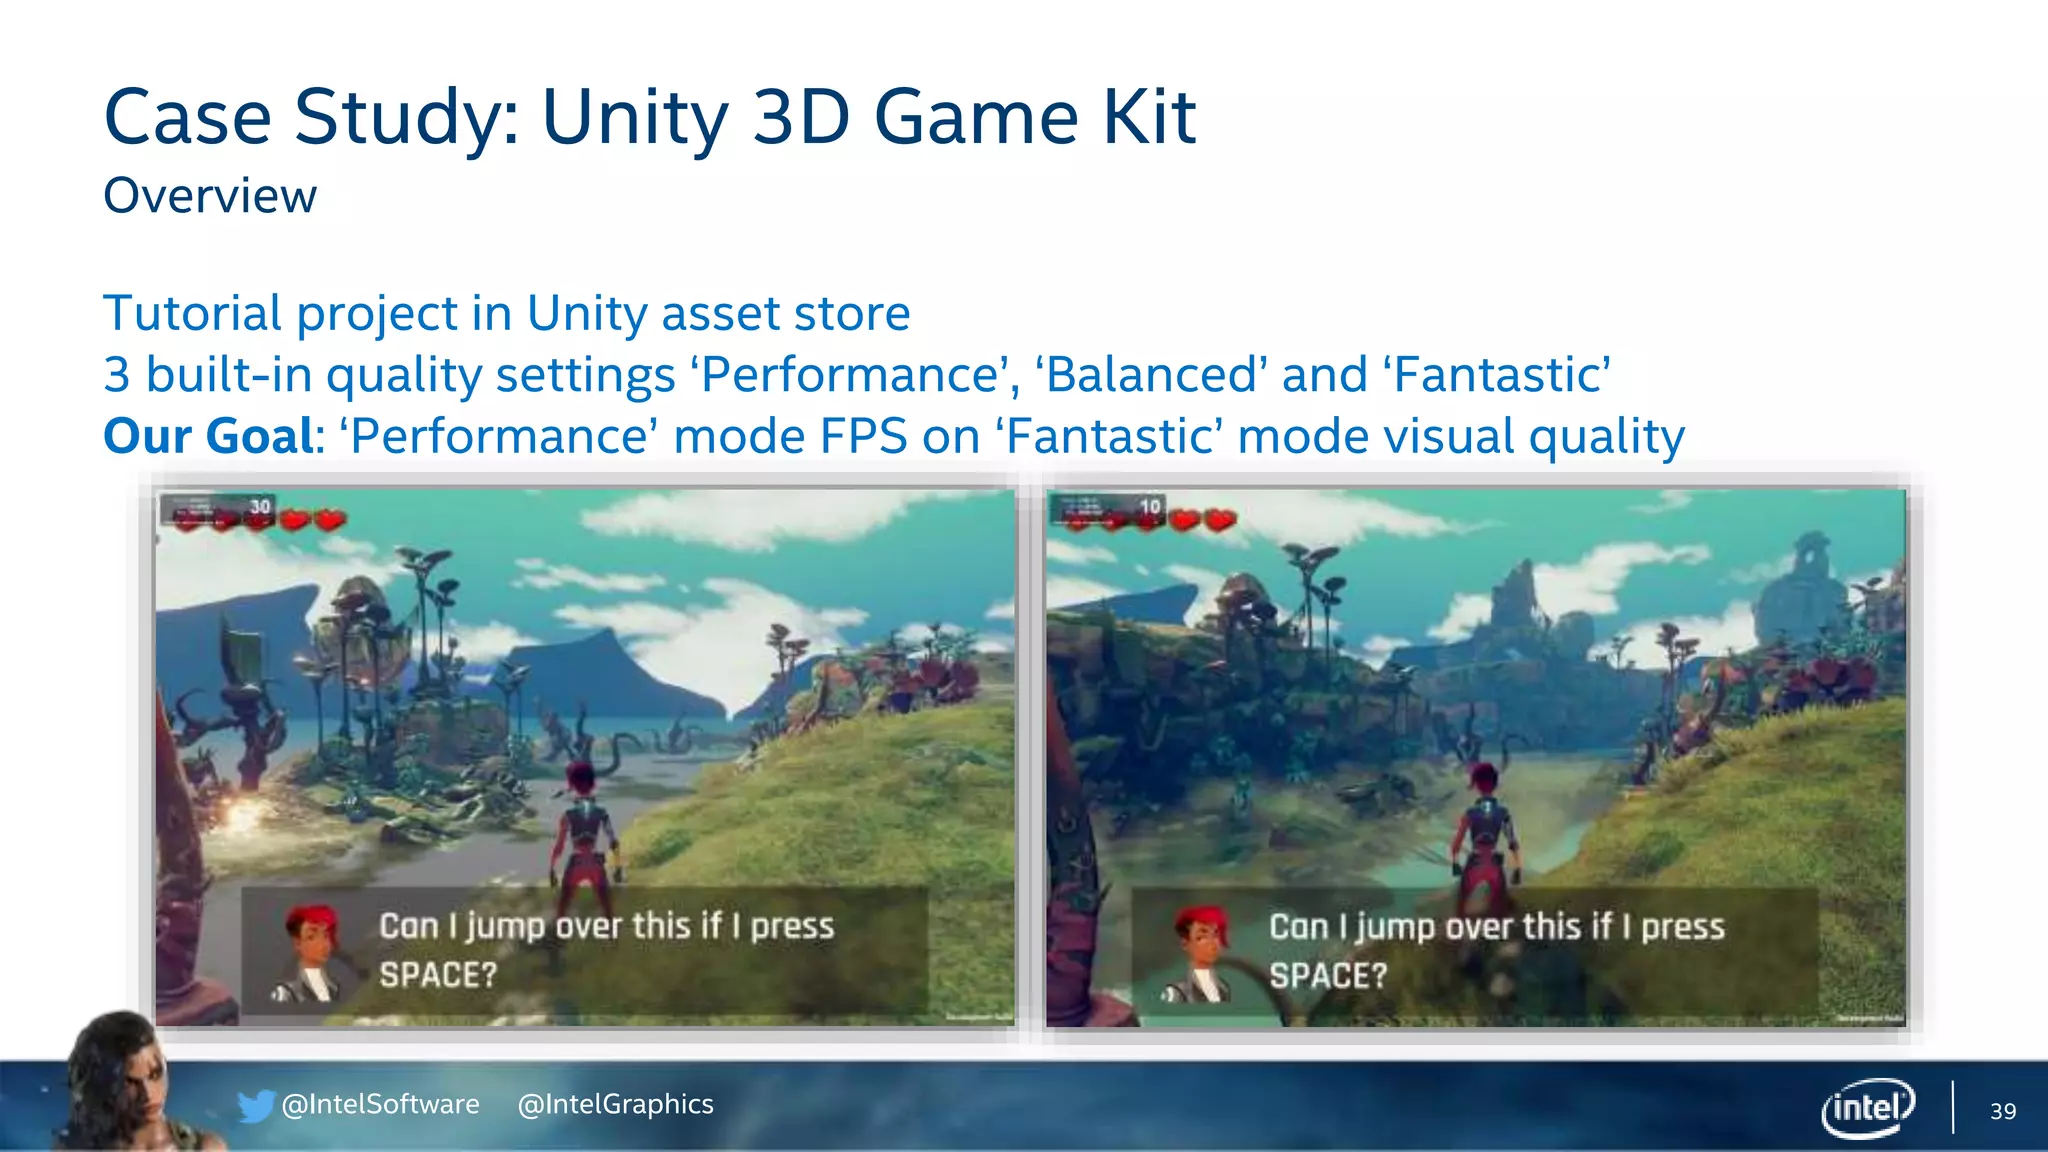
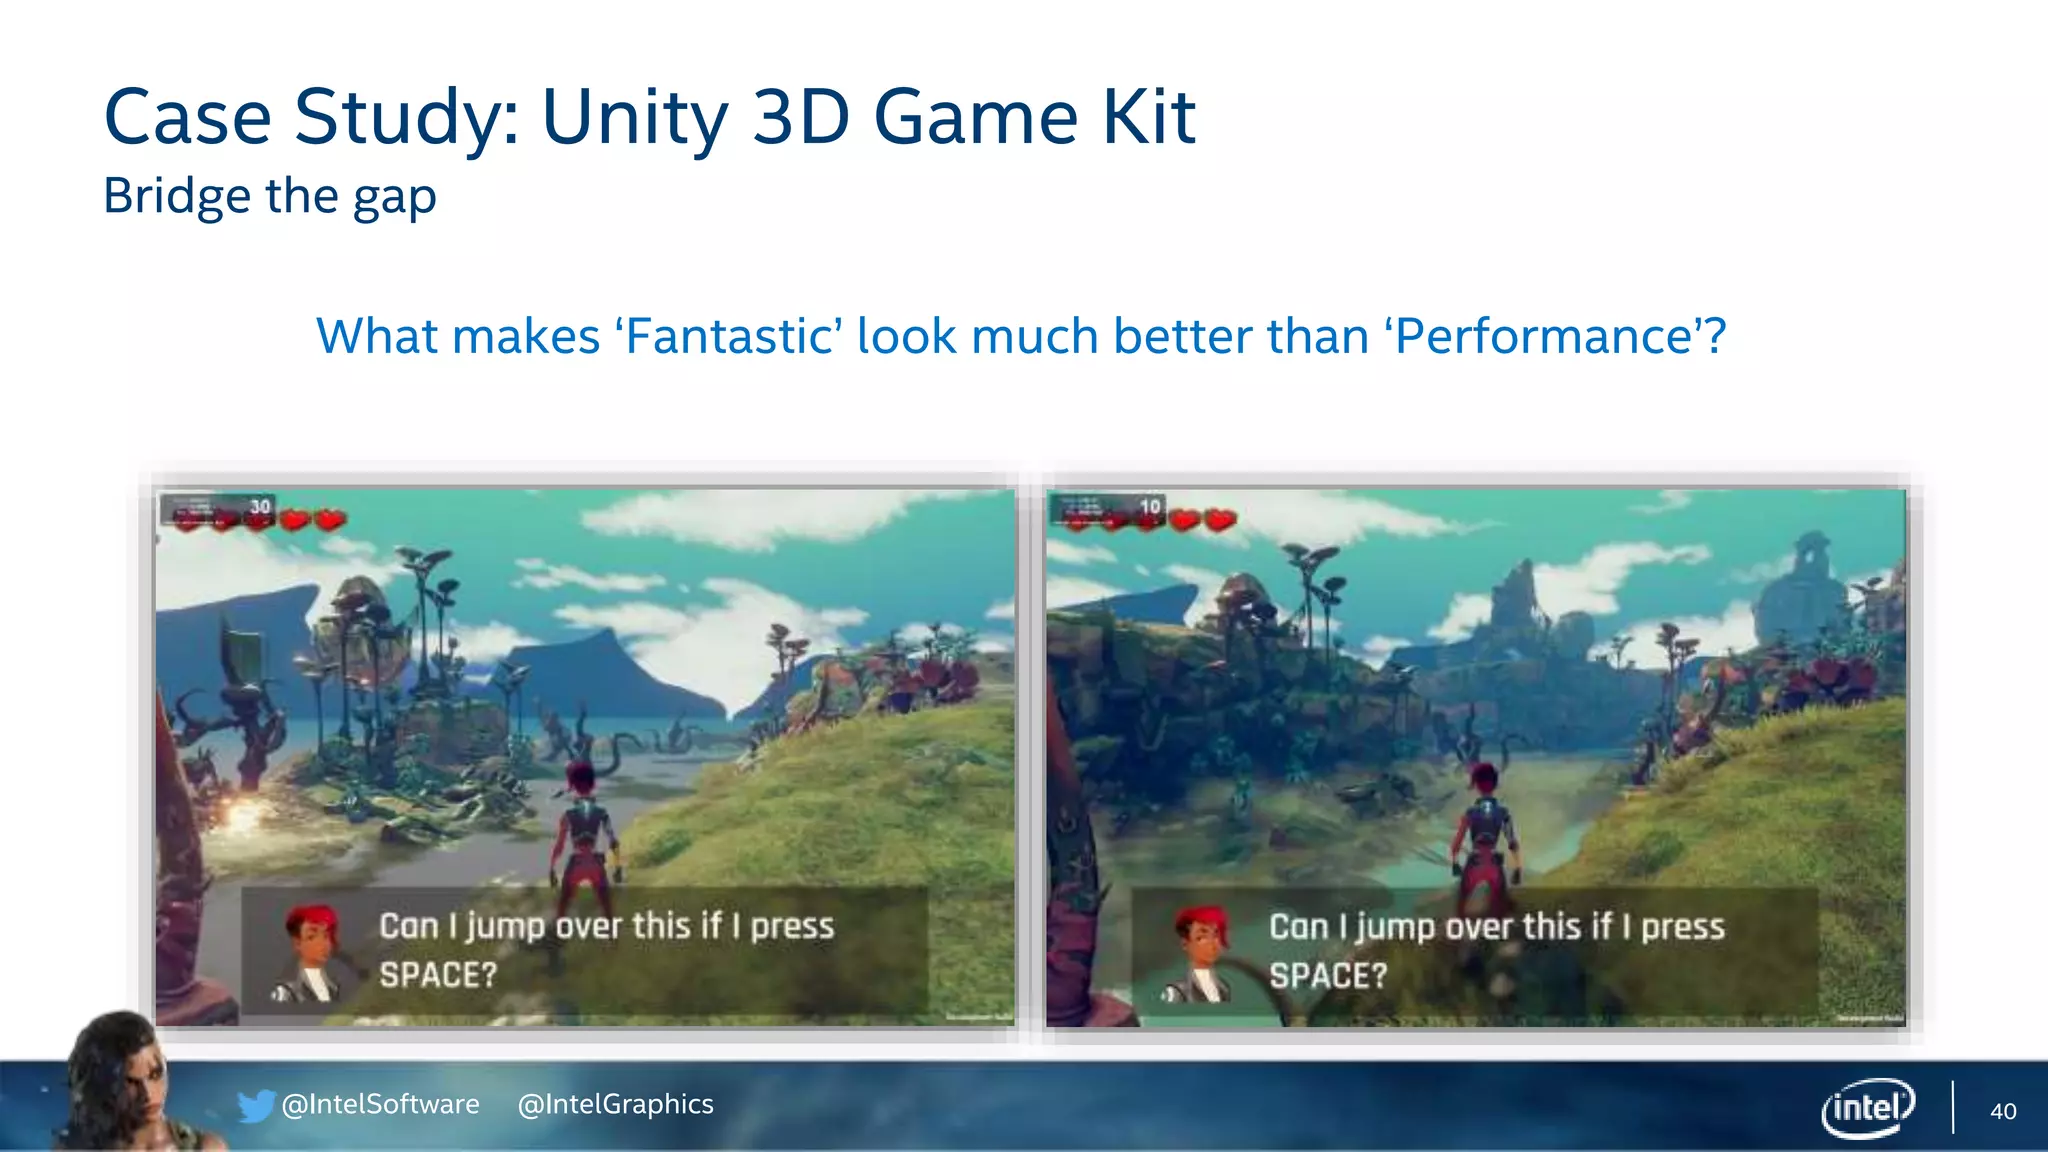
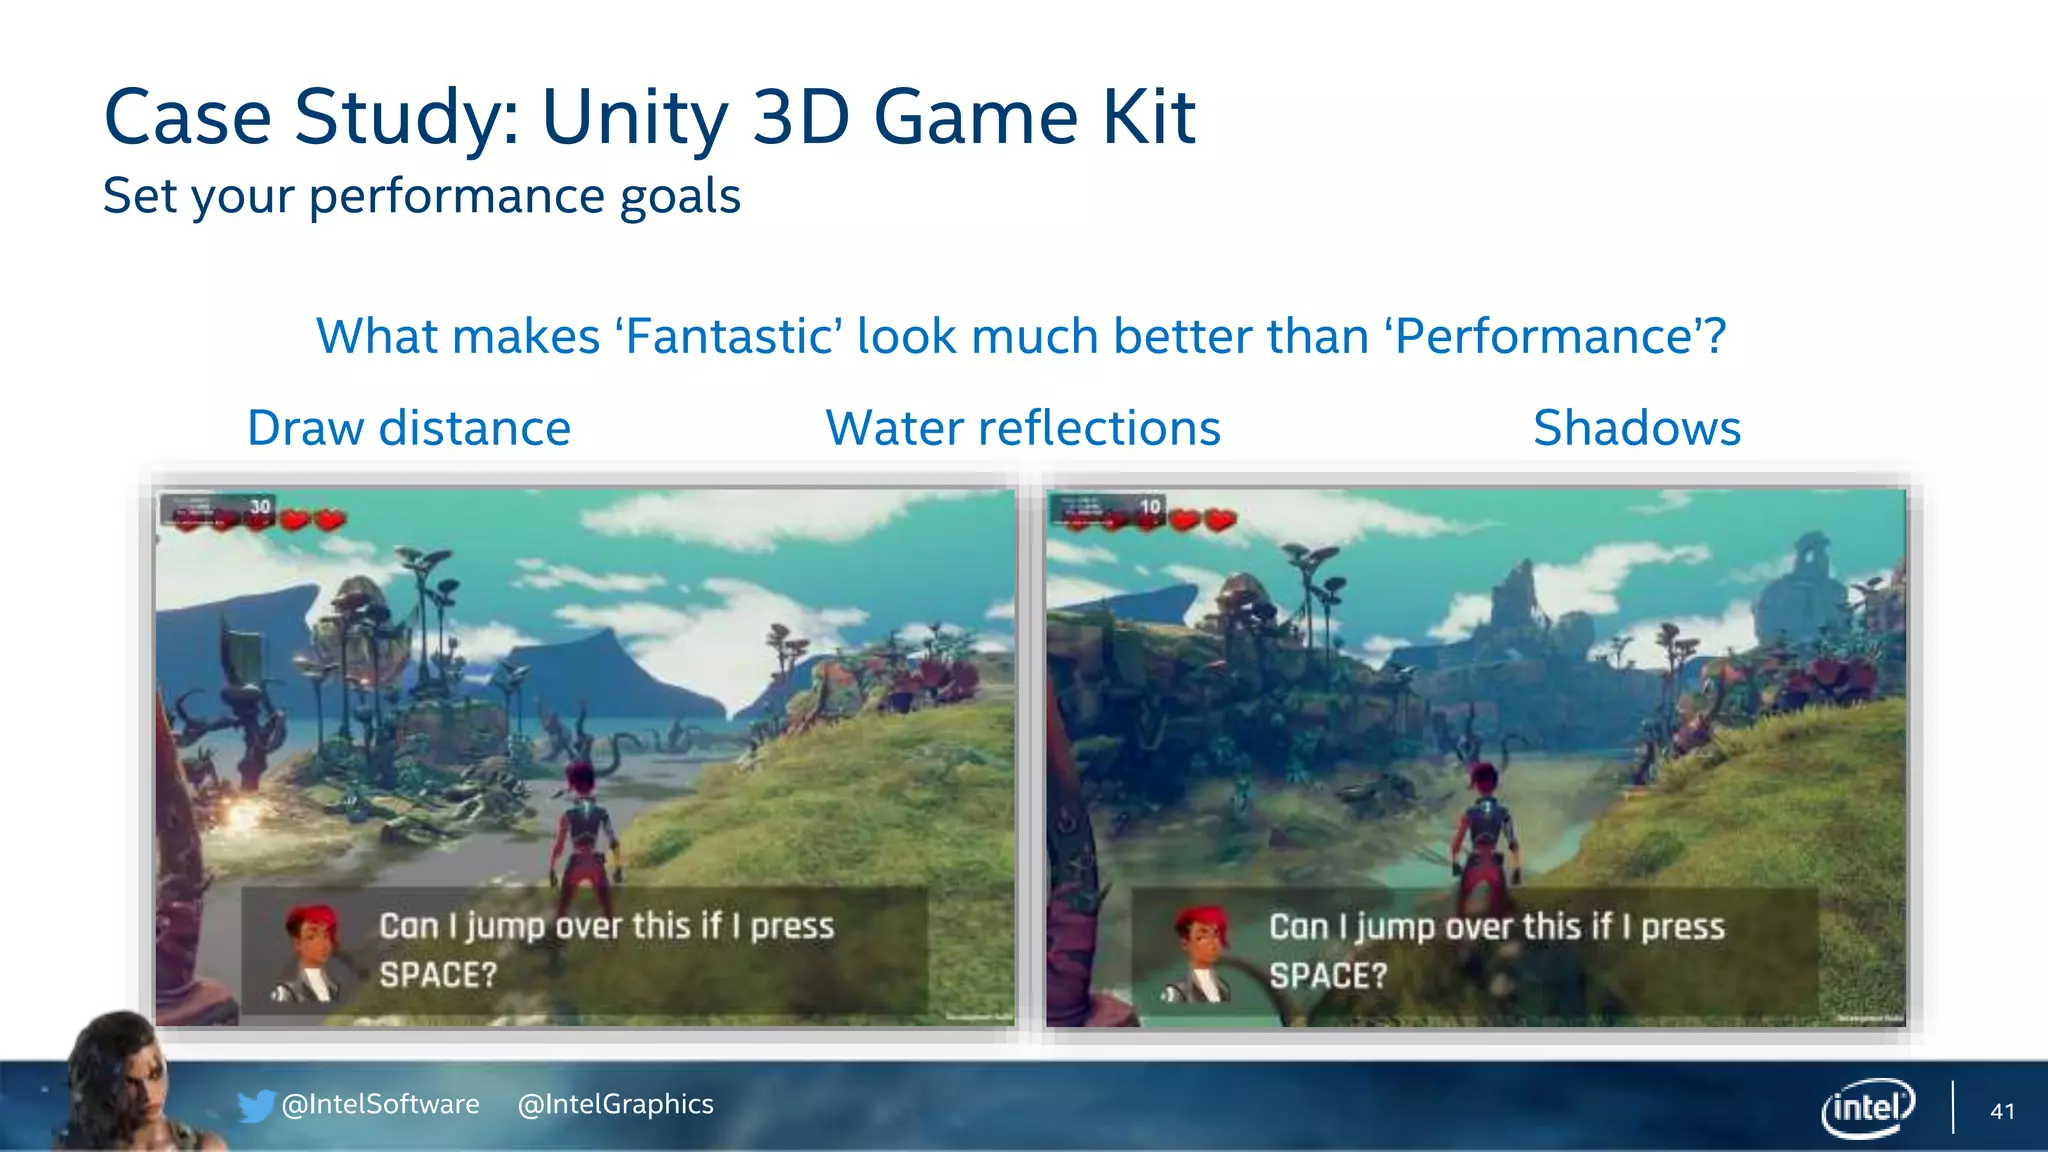
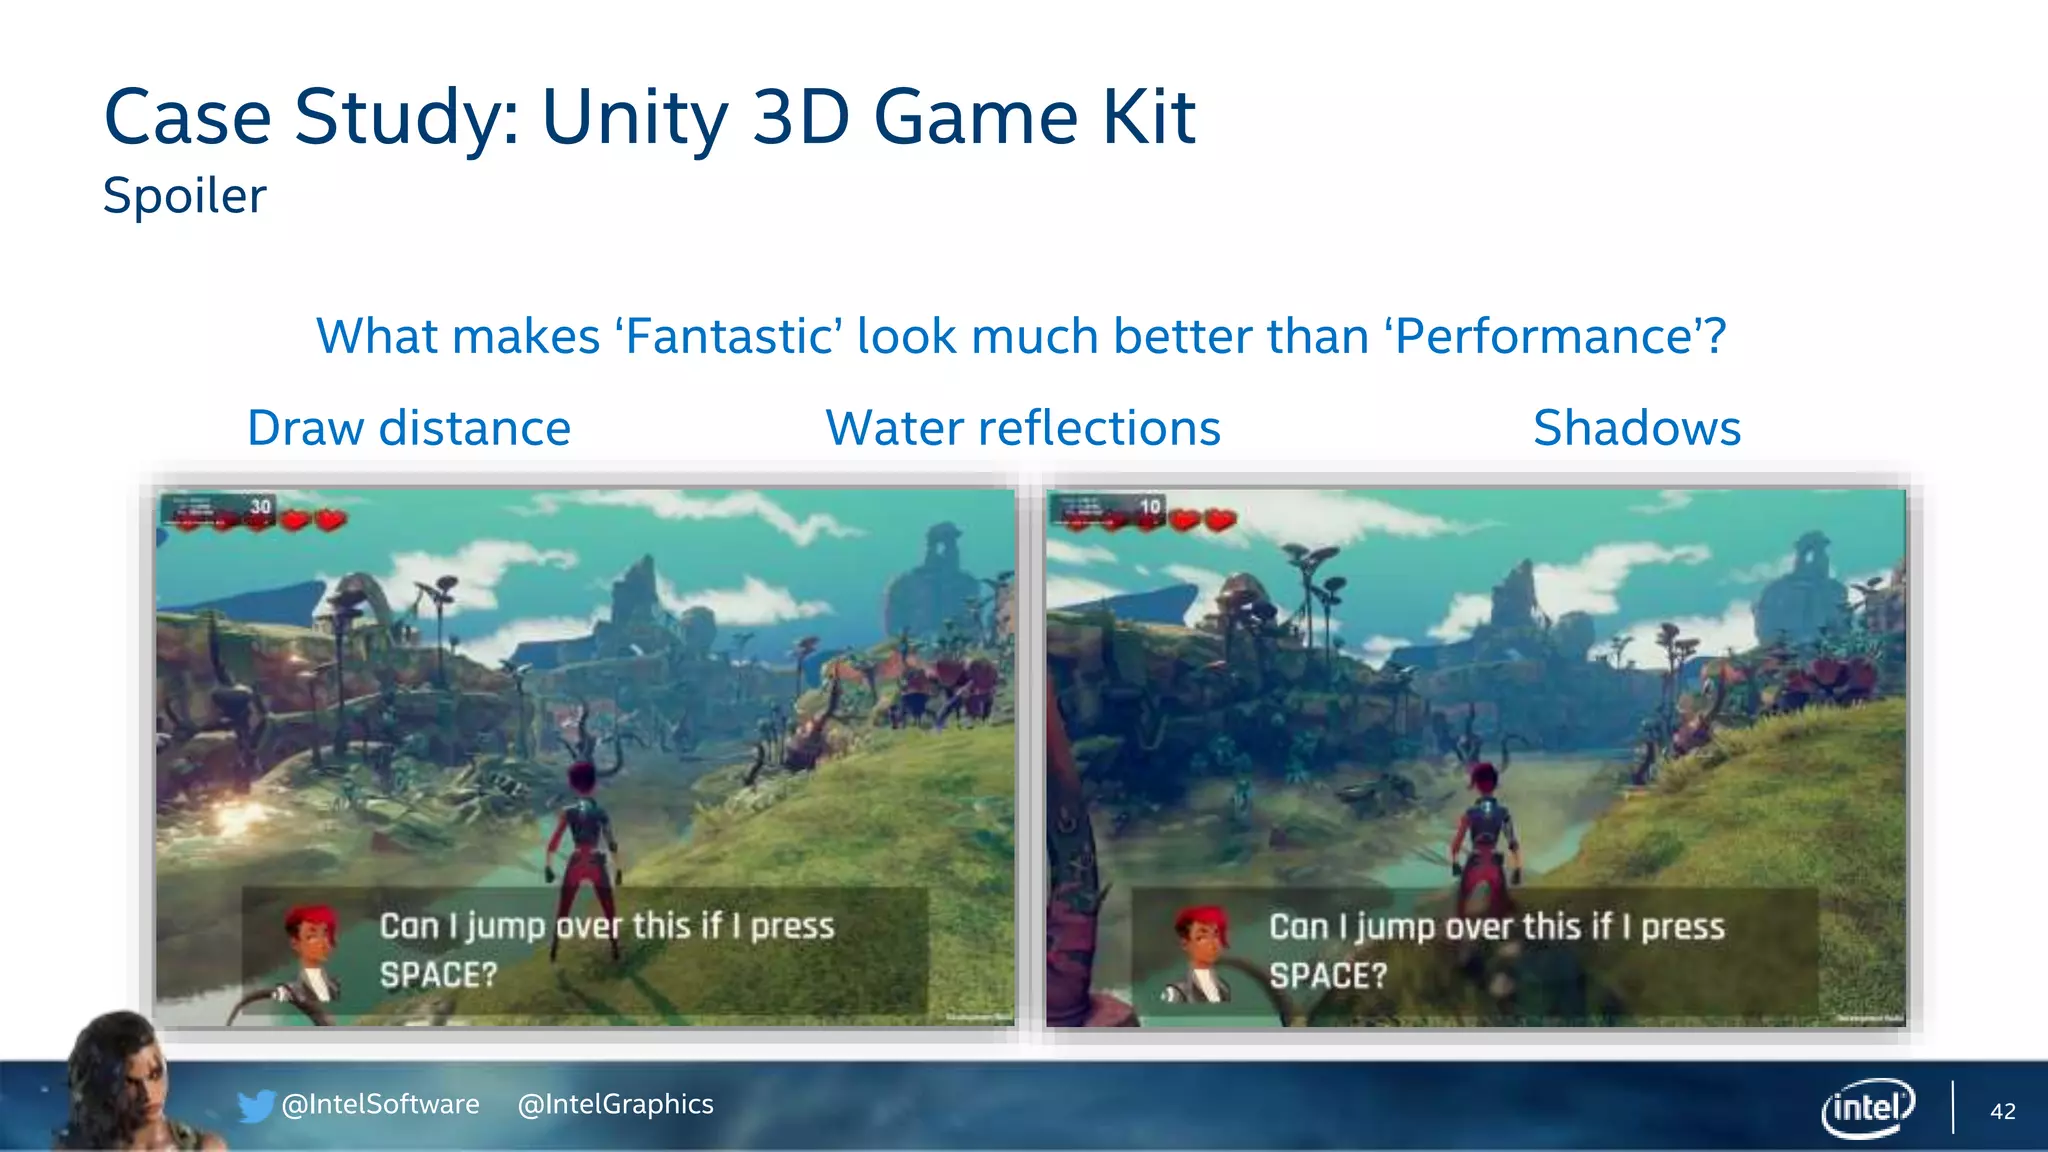
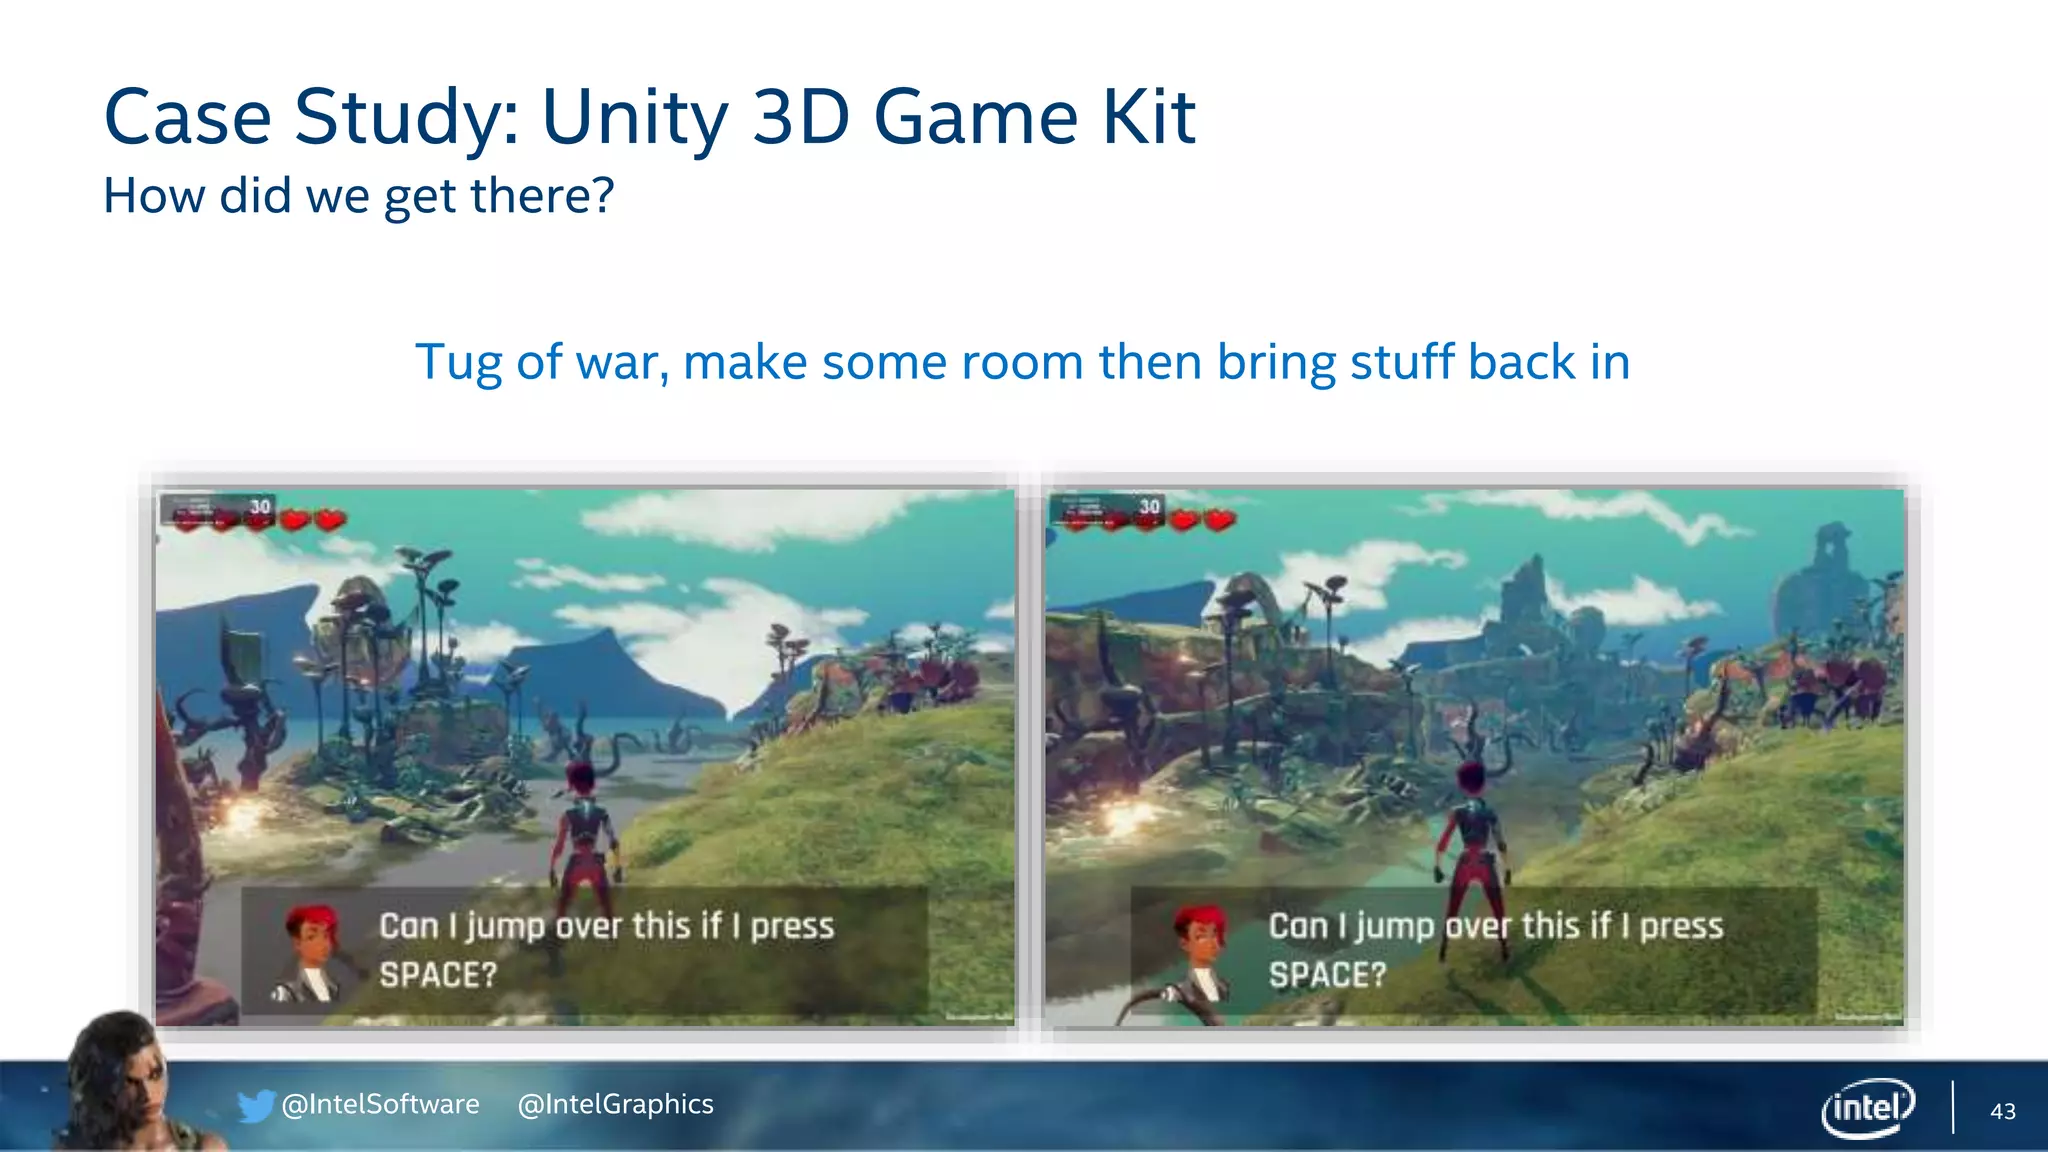
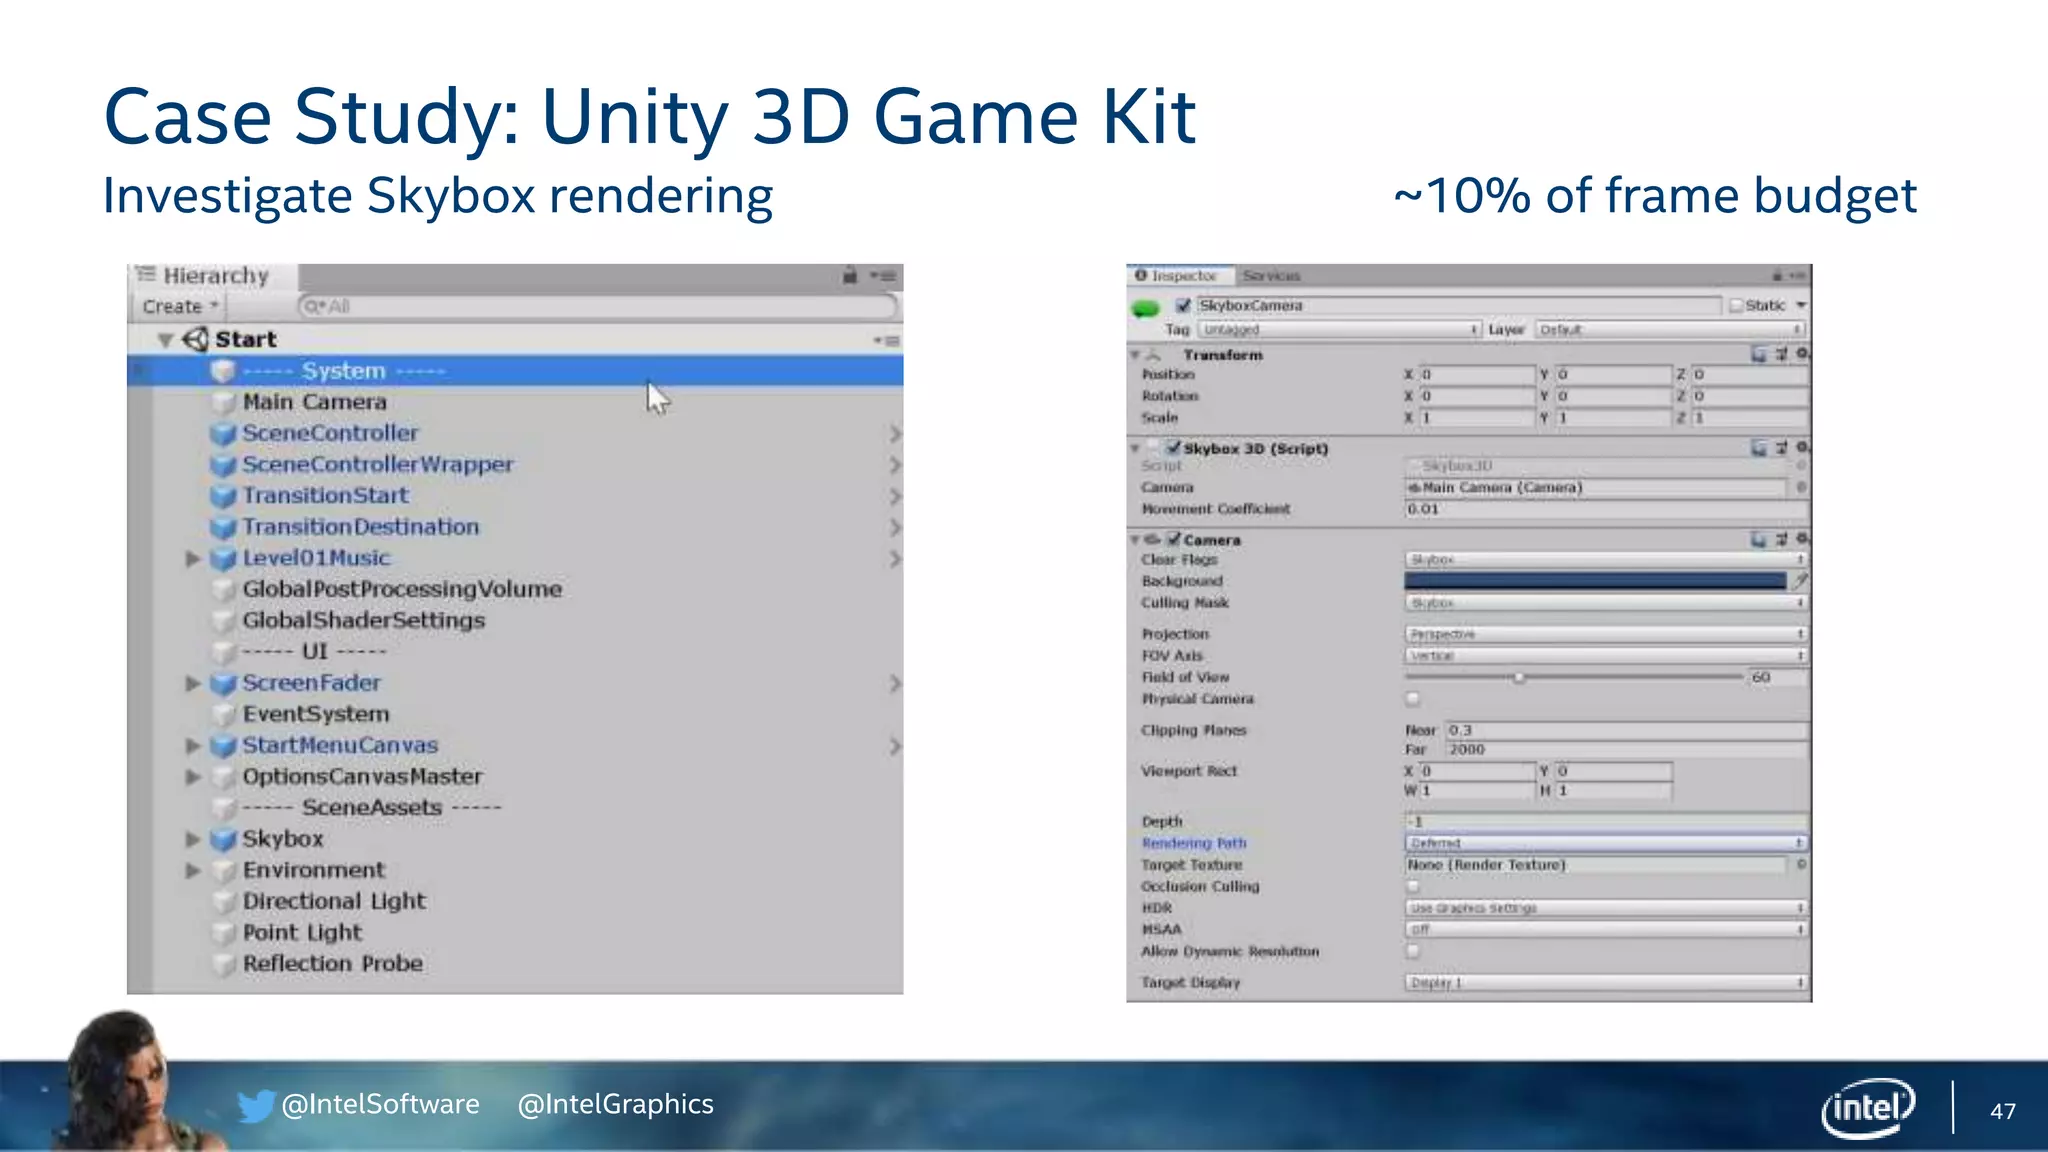
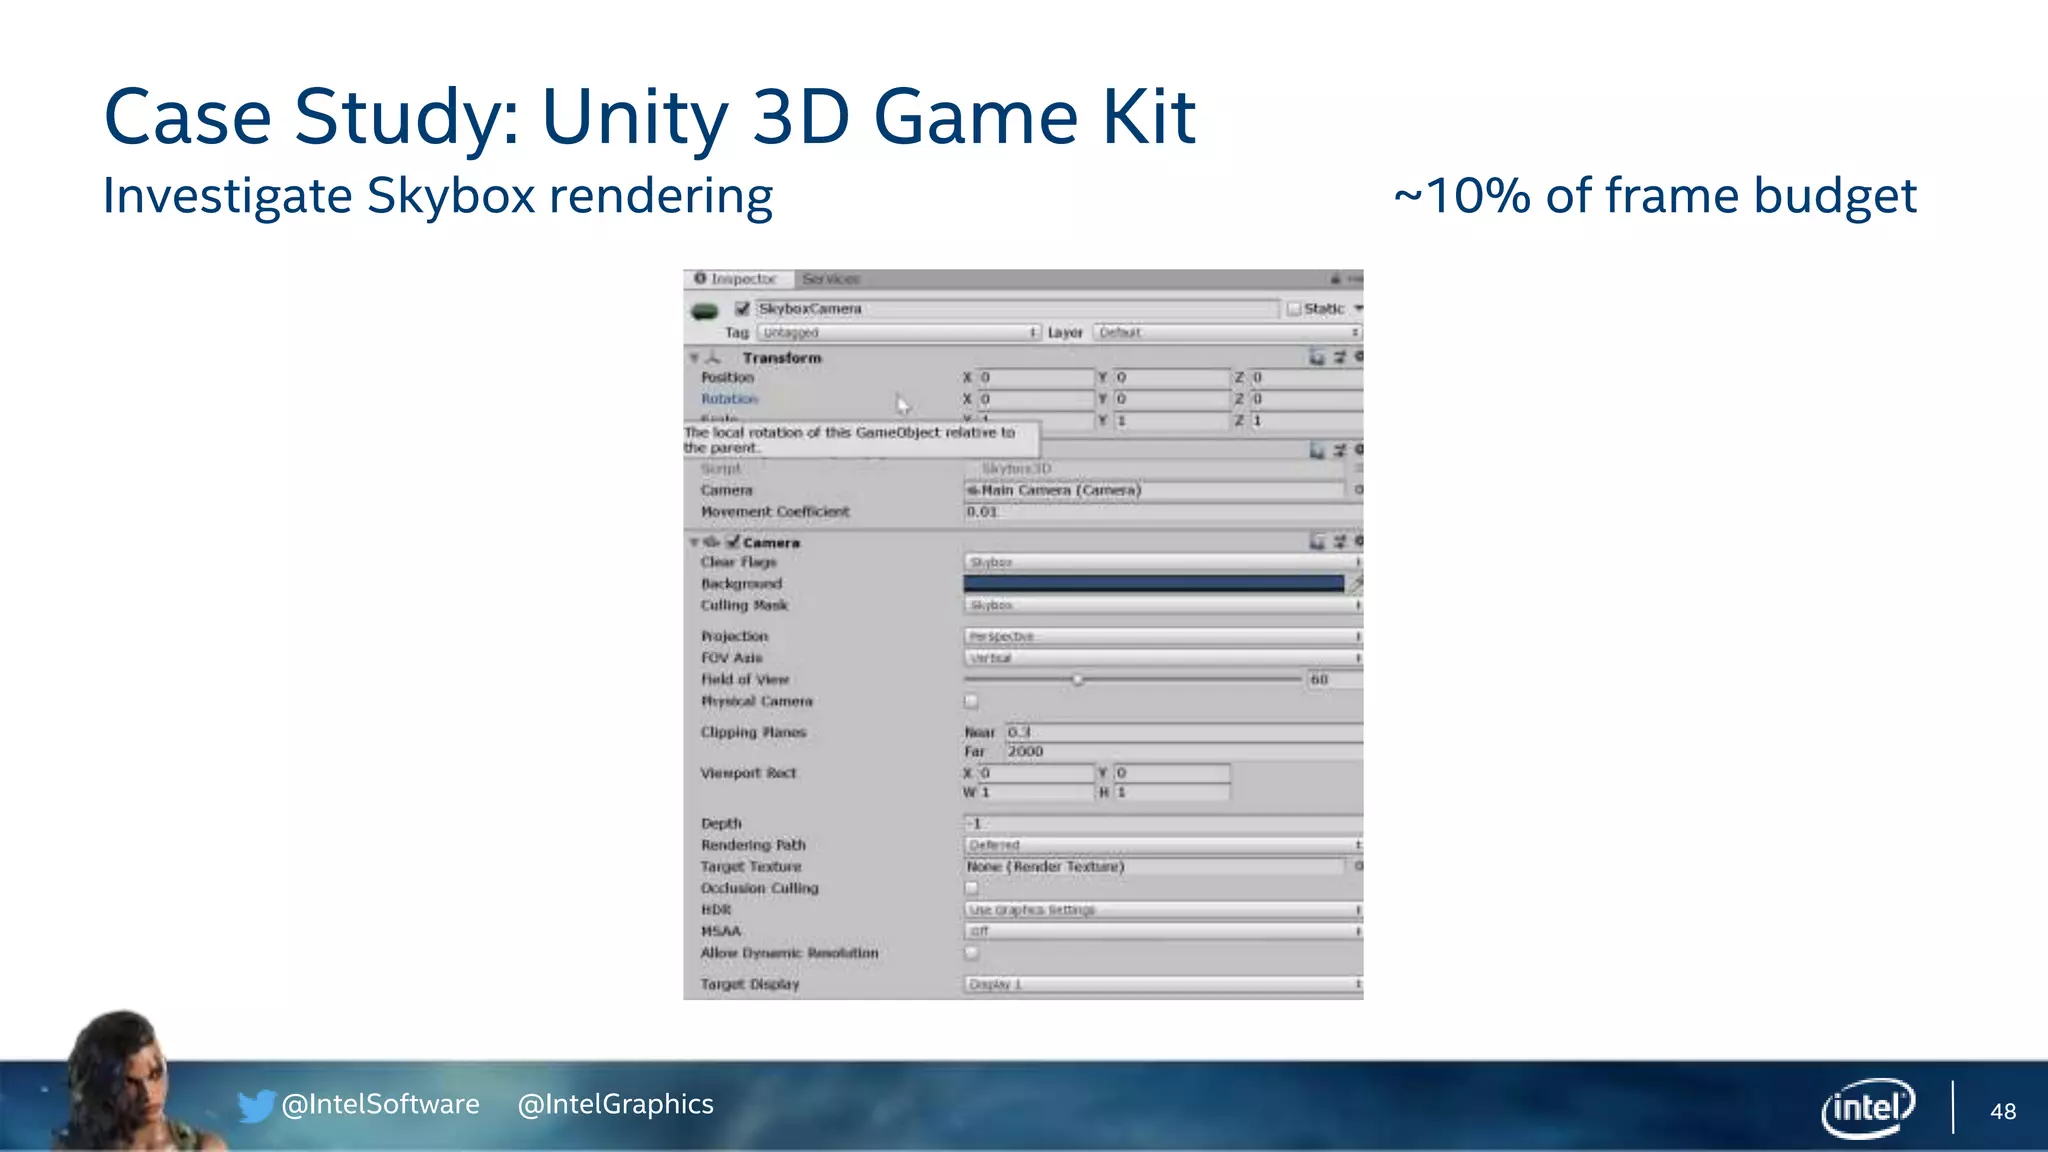
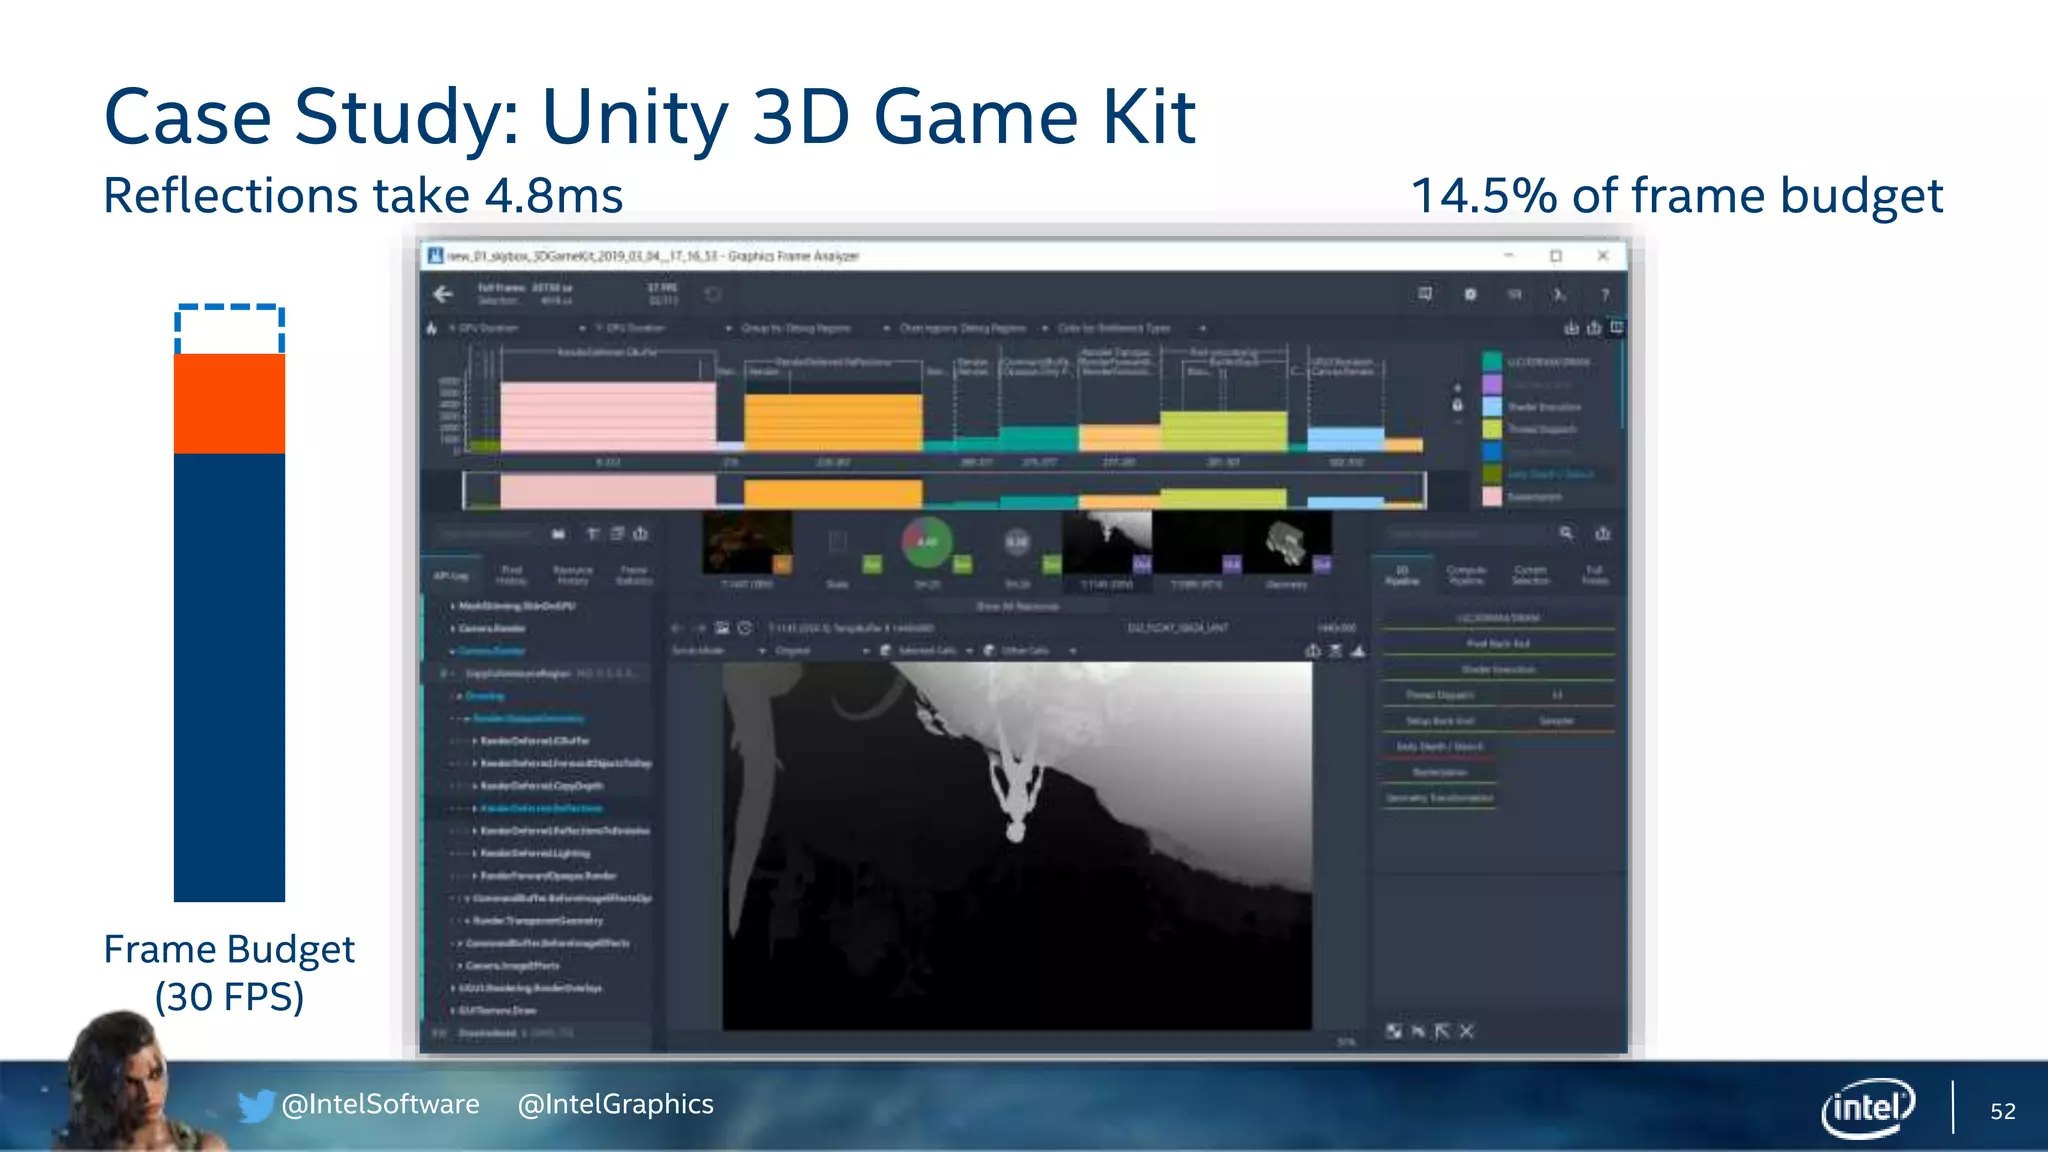
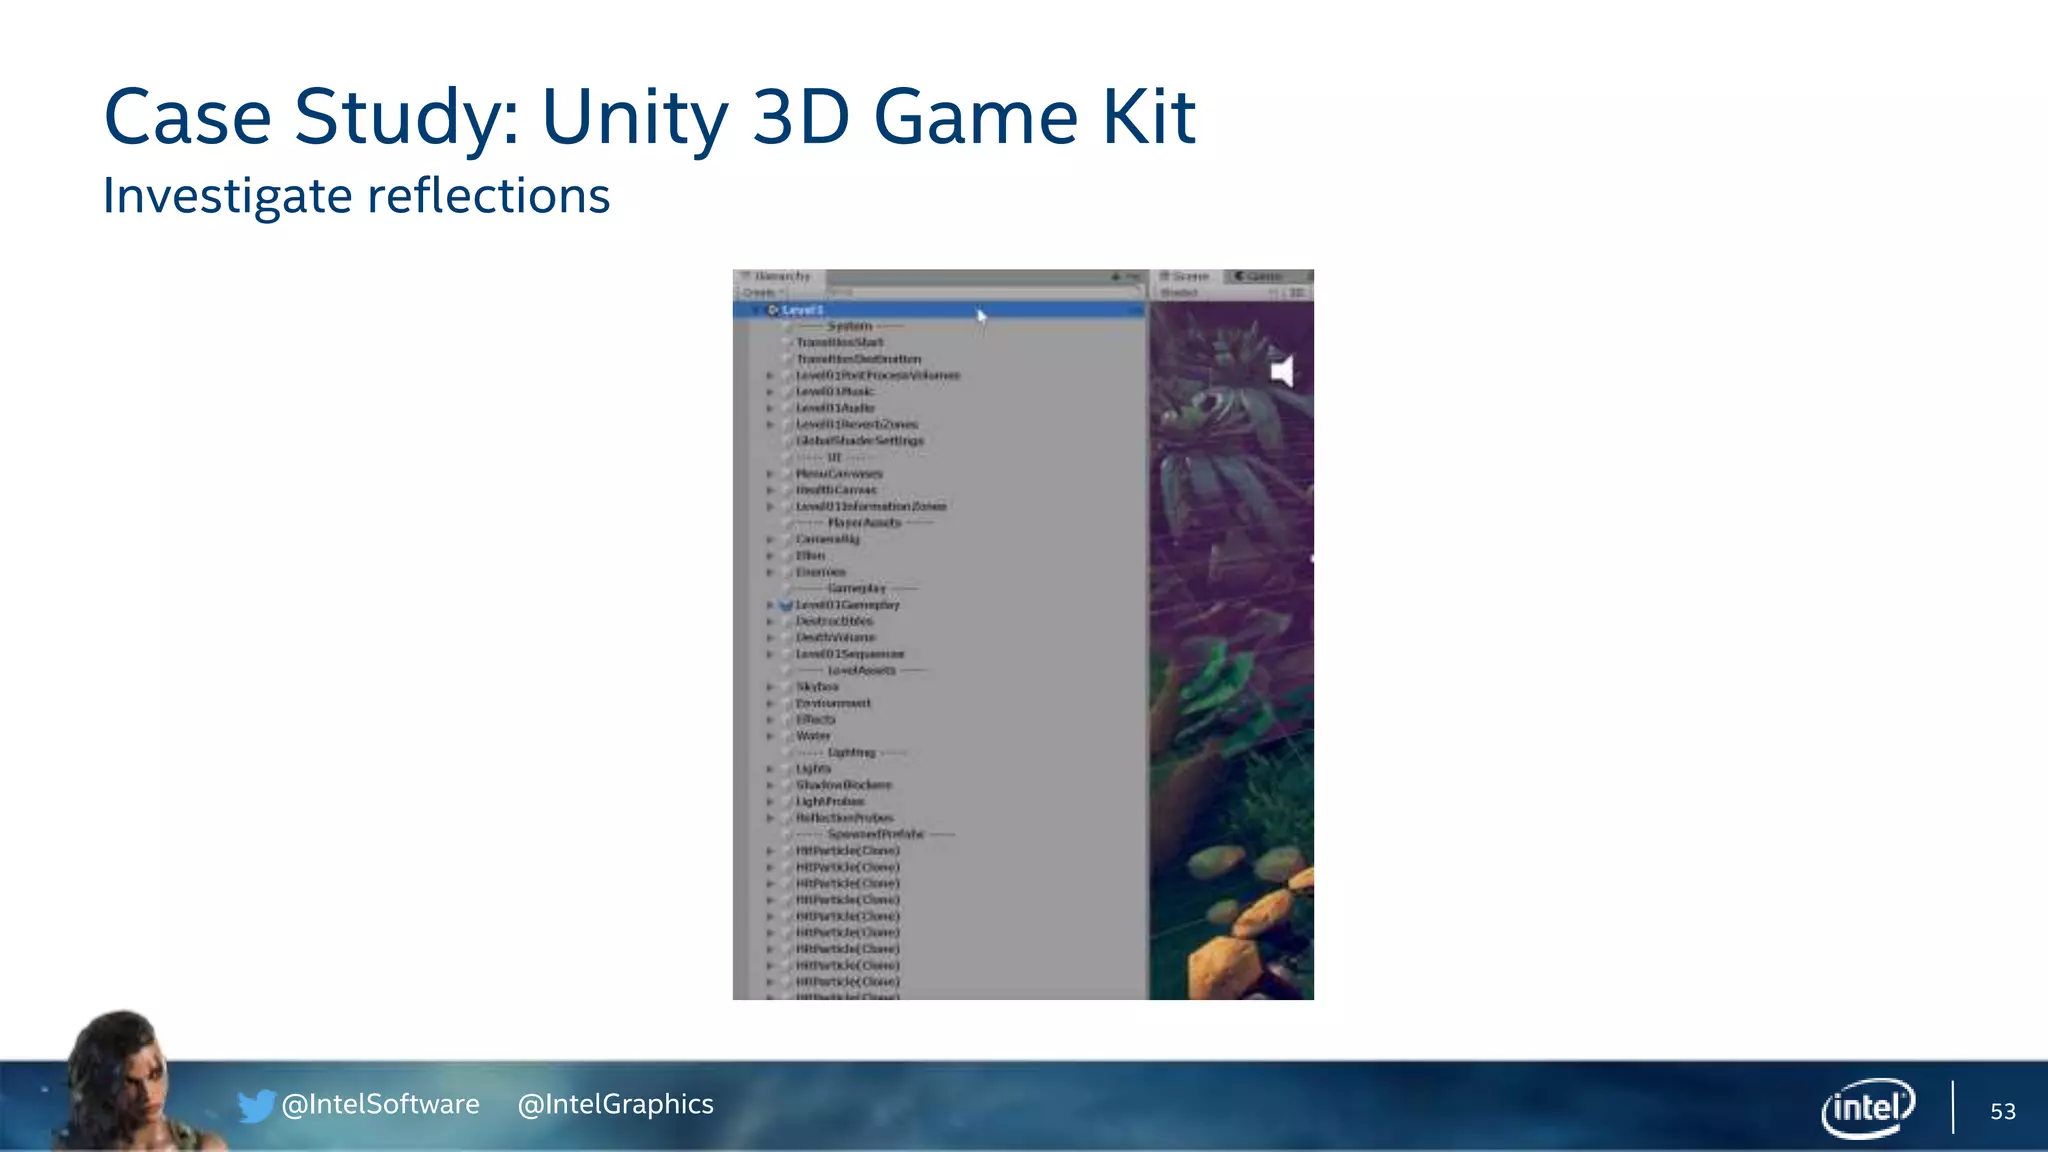
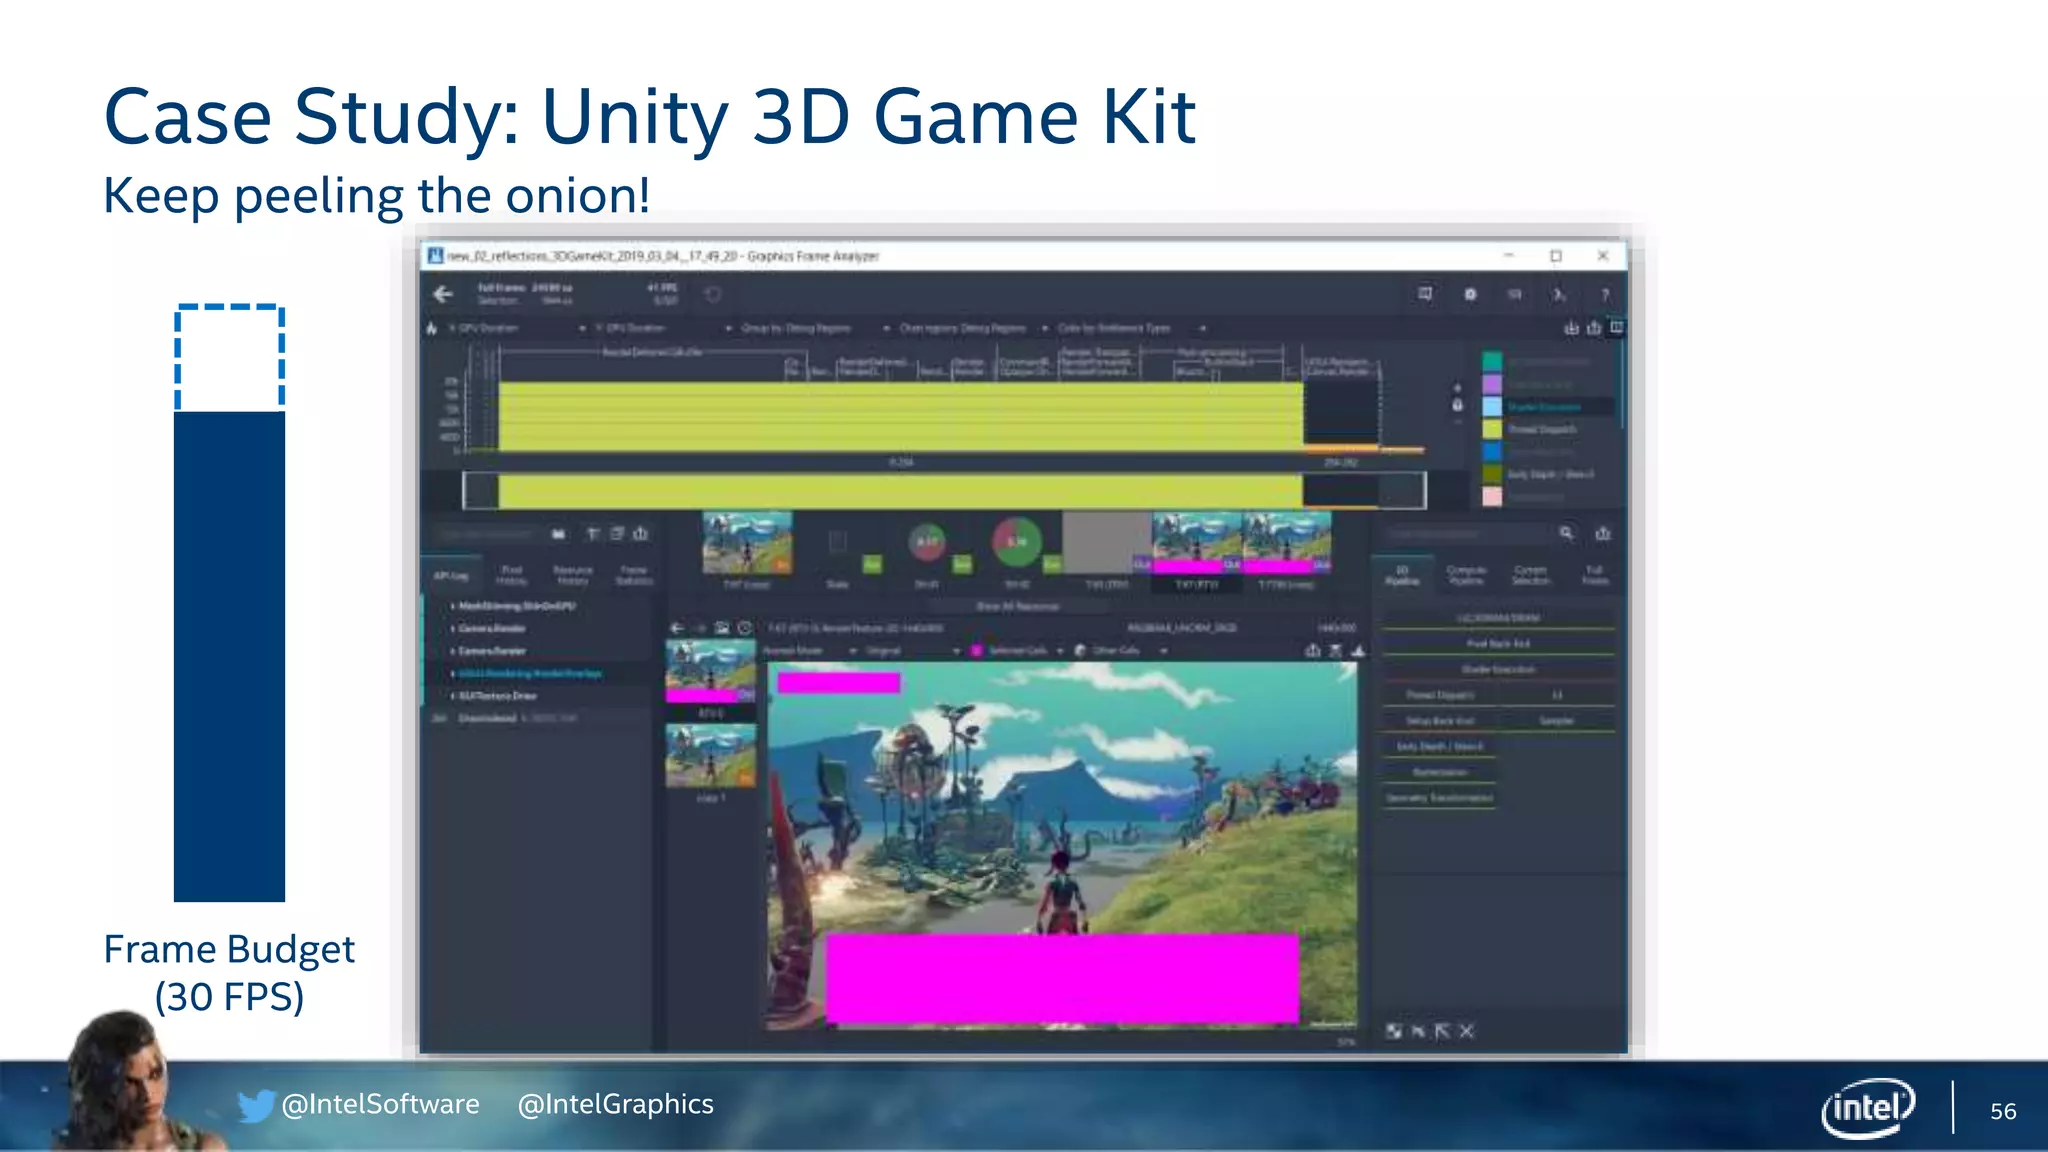
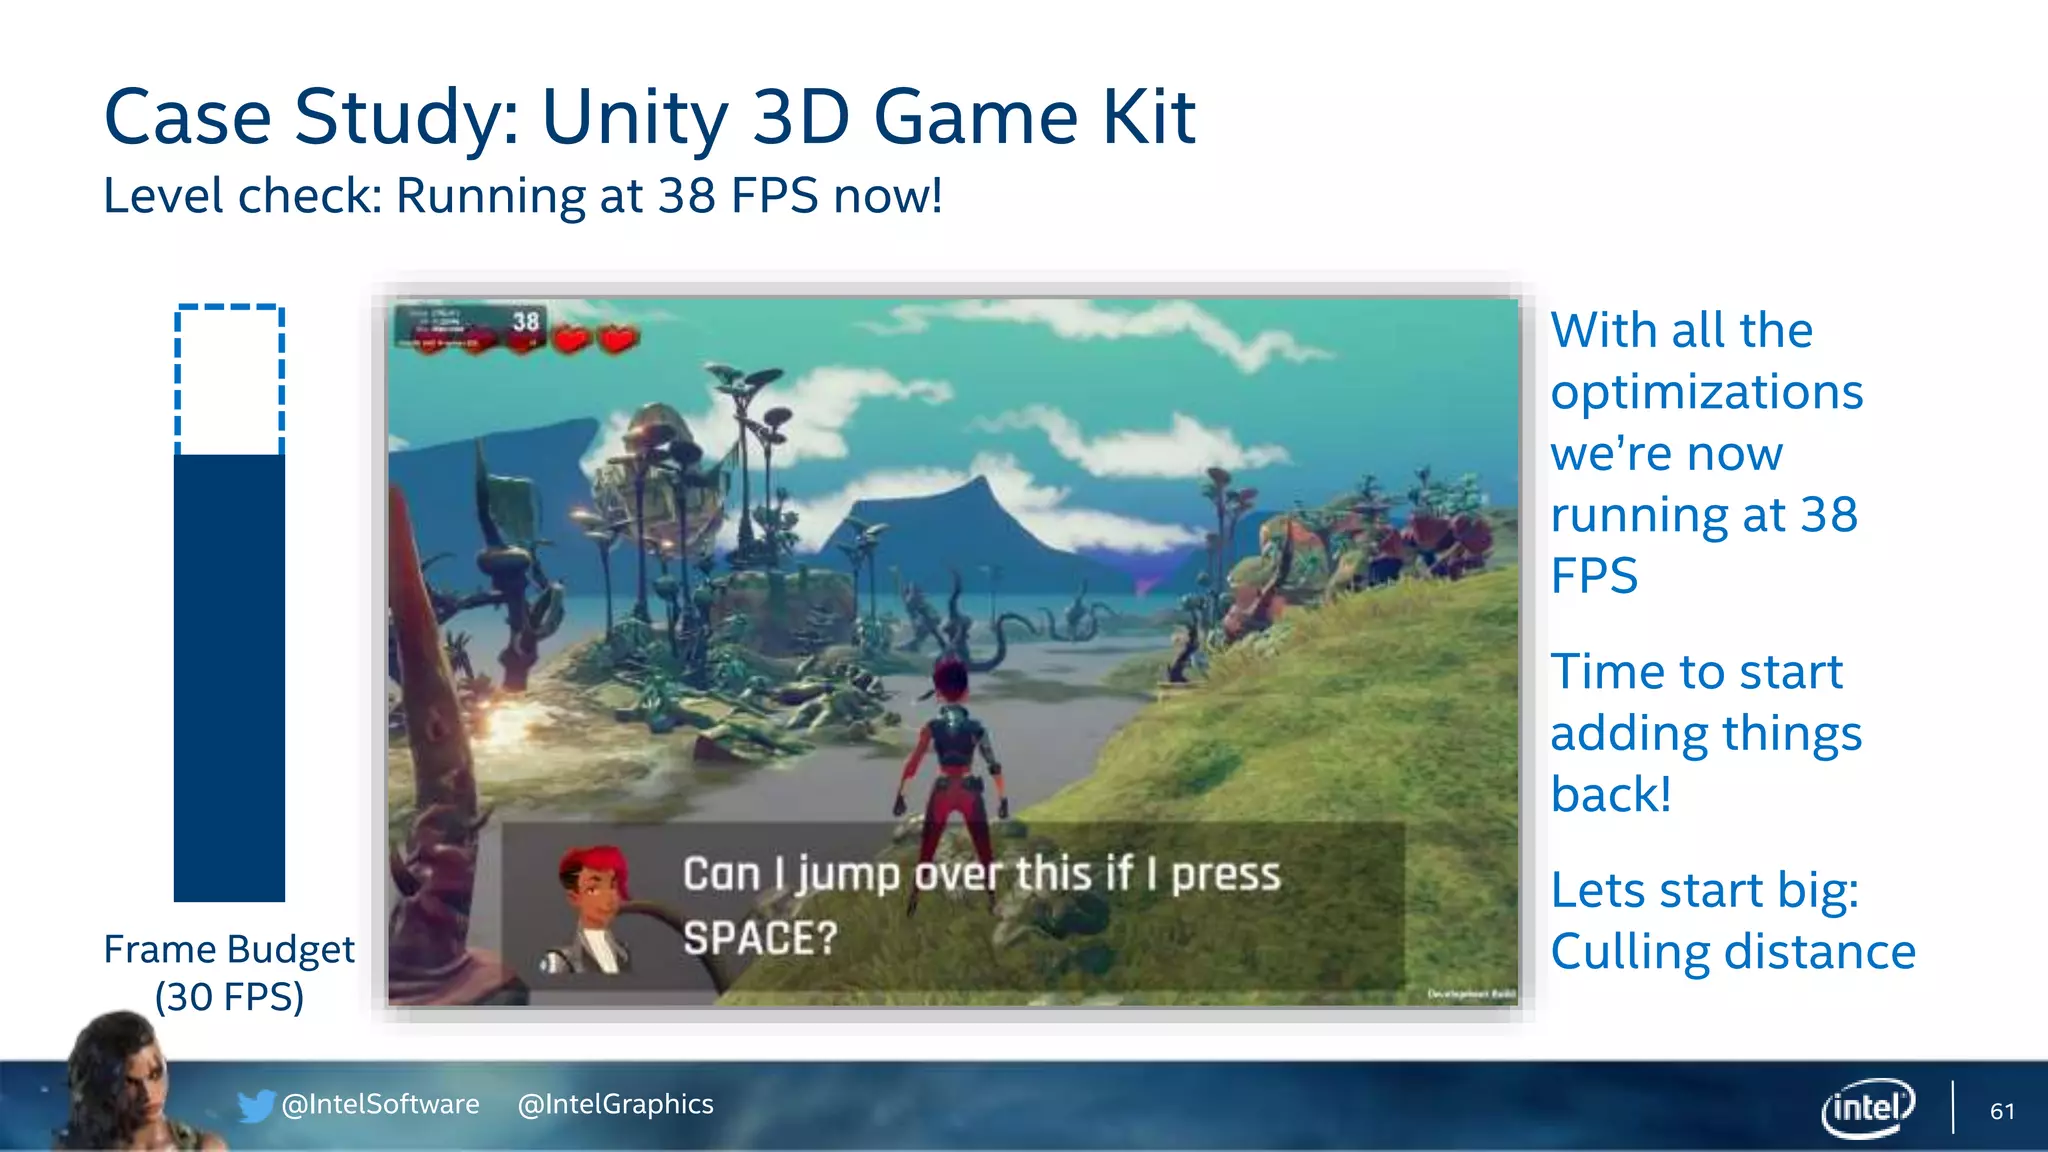
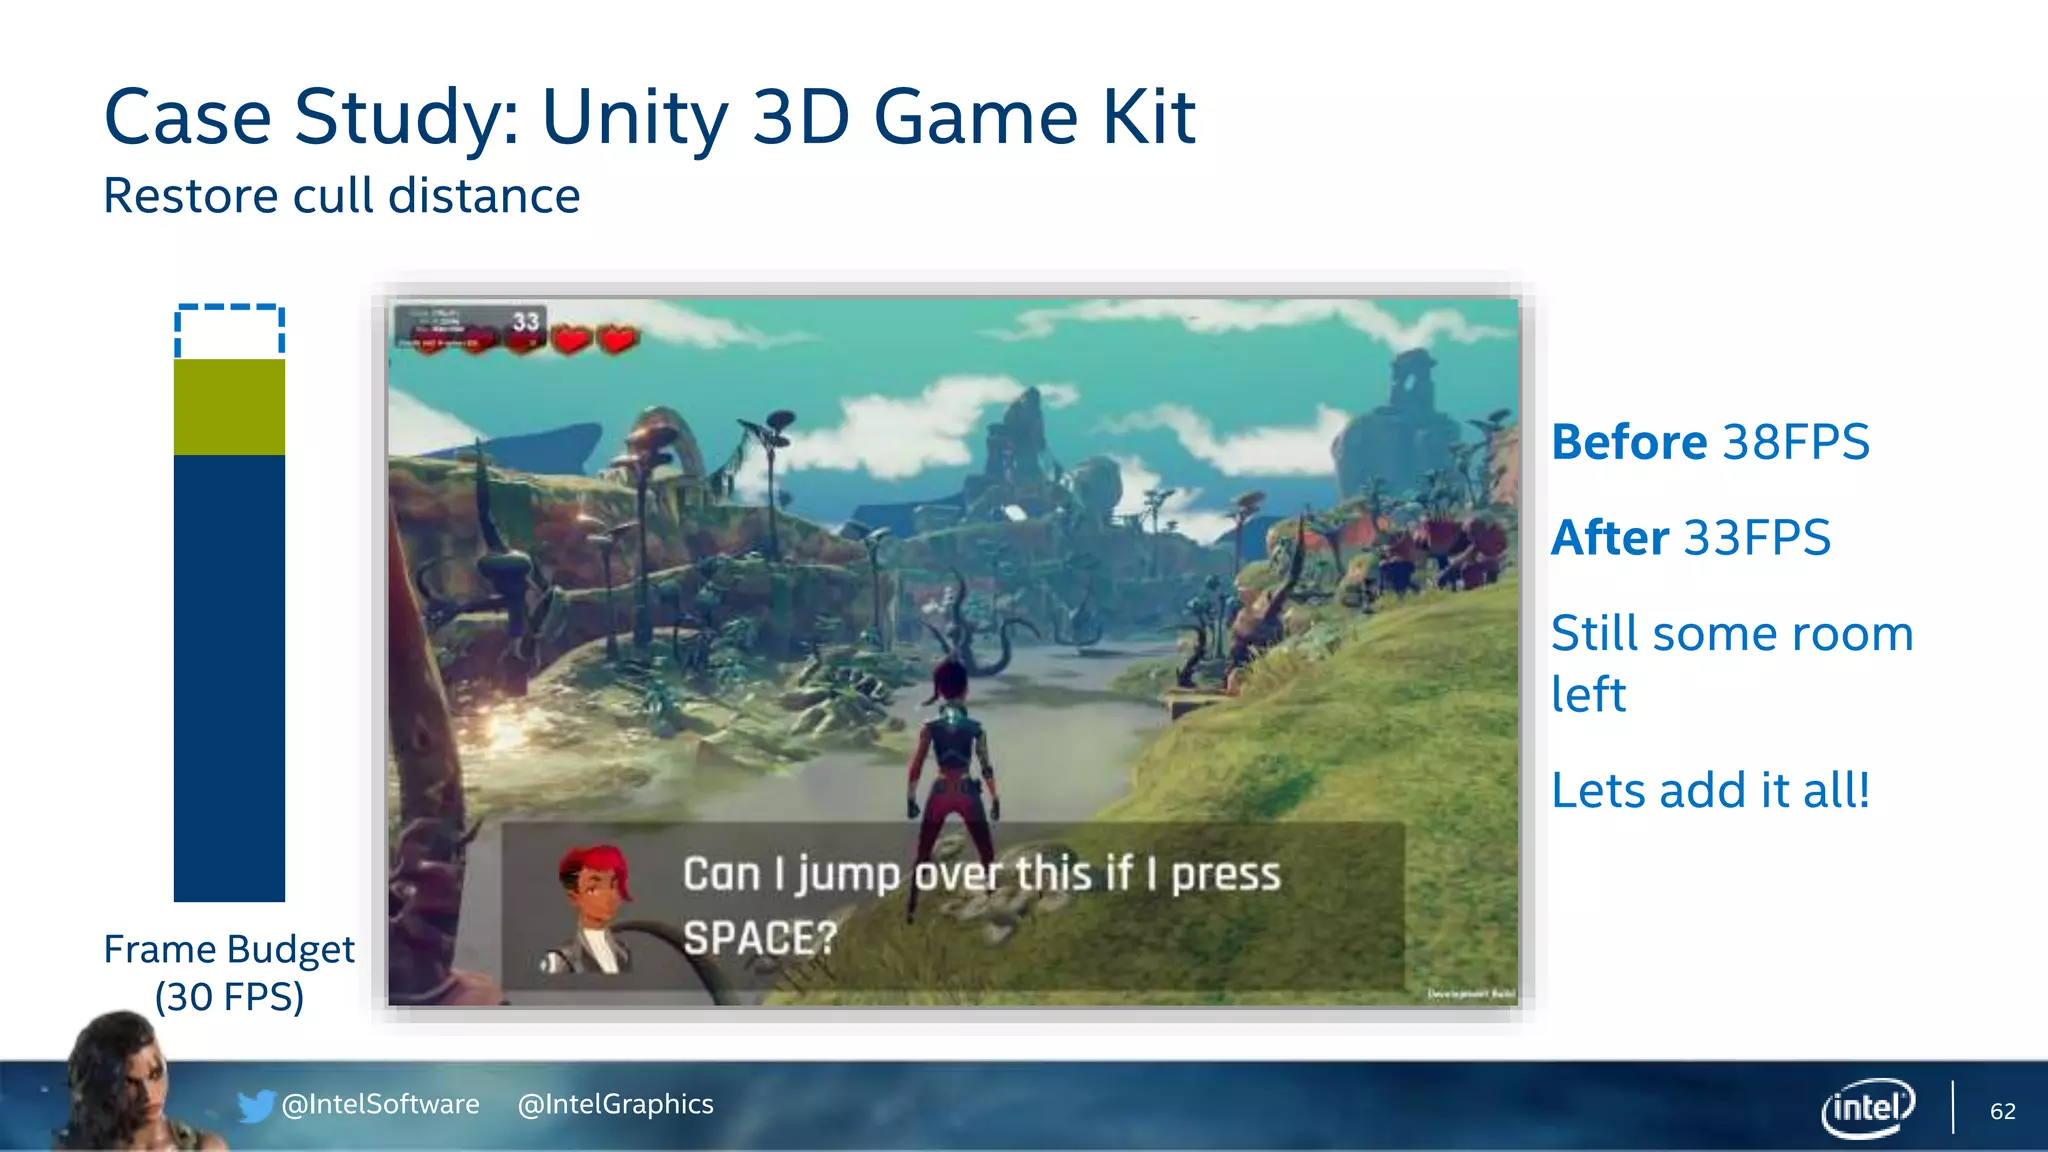
Examines optimizing Unity’s 3D Game Kit, focusing on performance settings and visual quality enhancements.
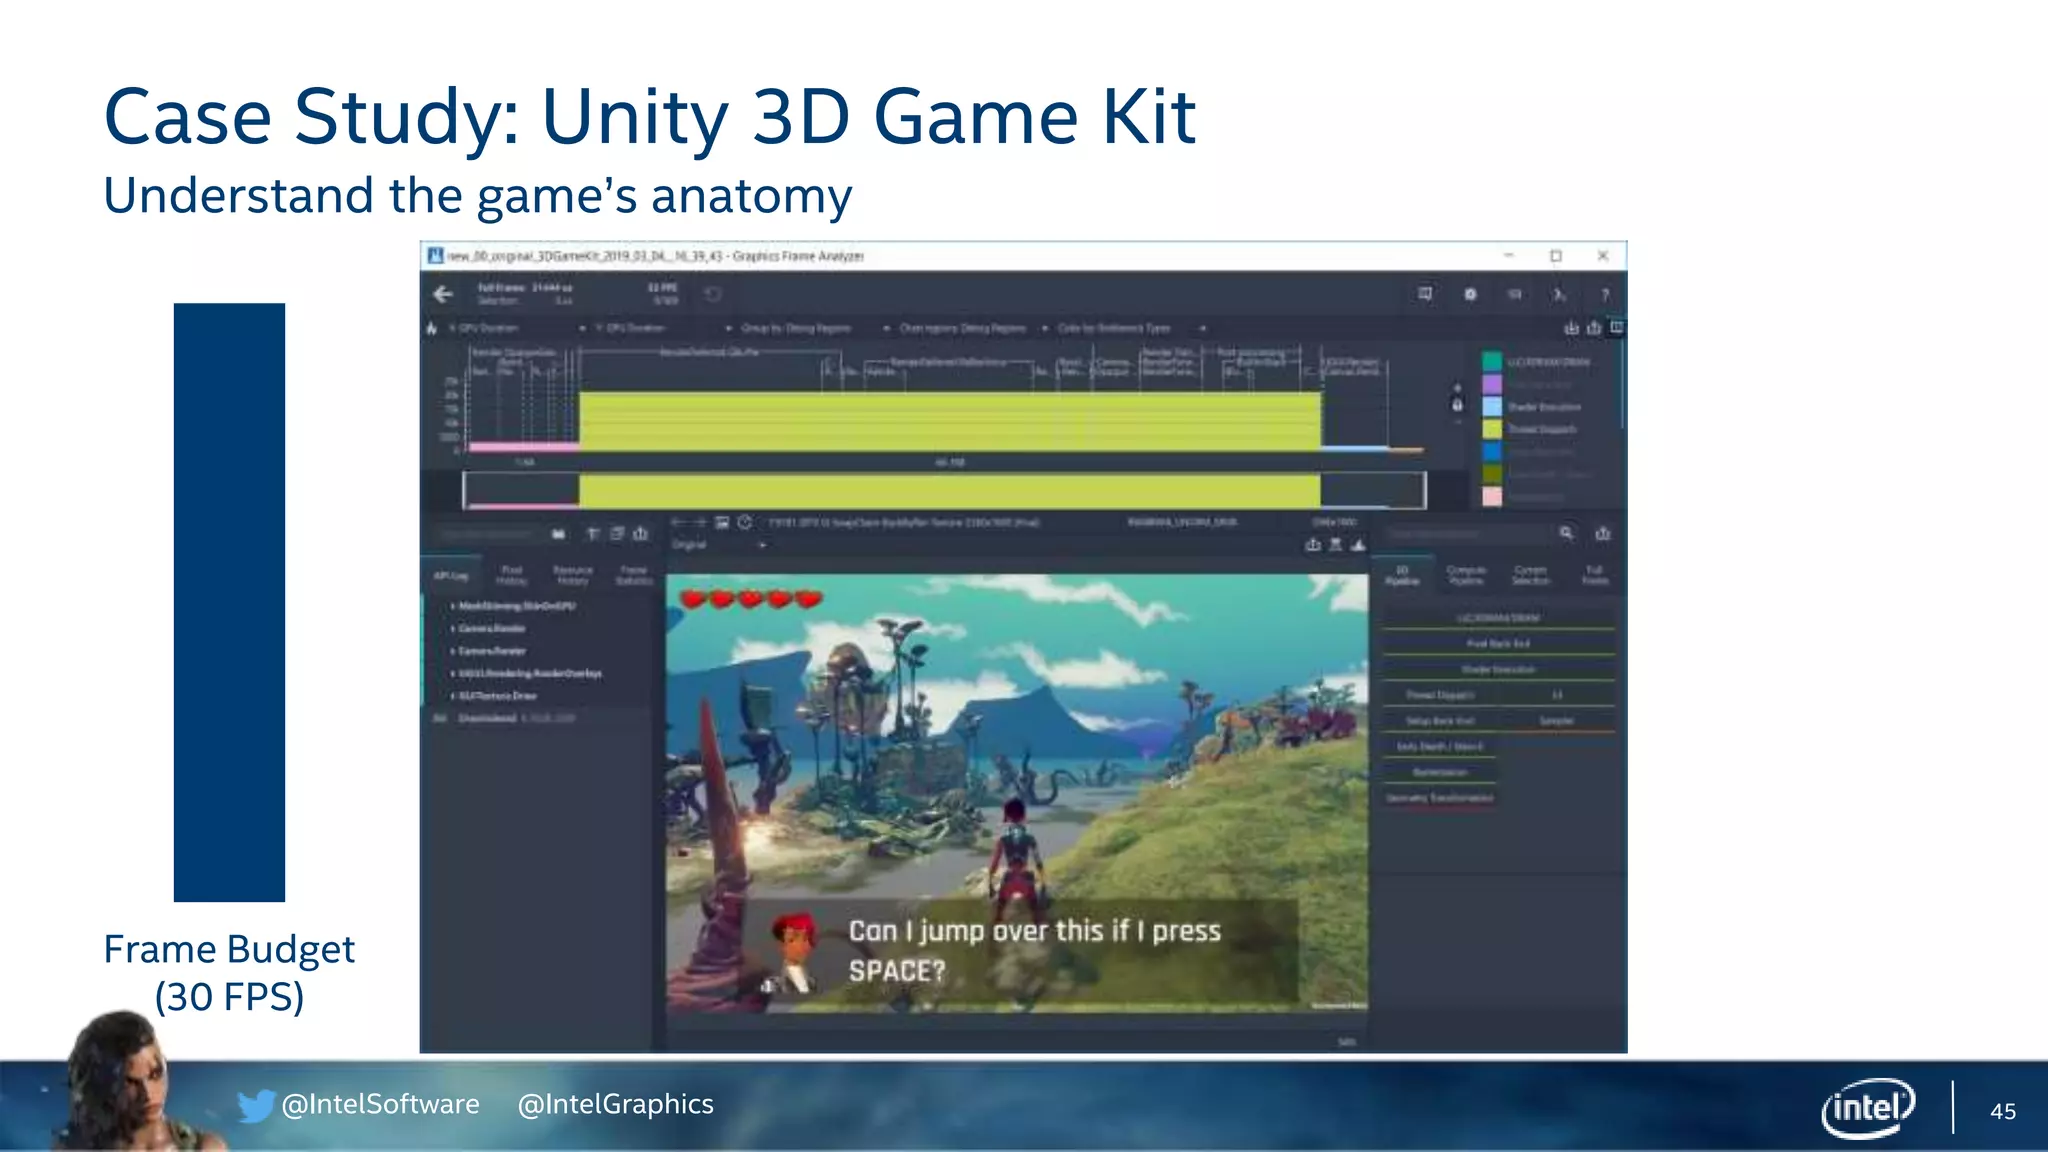
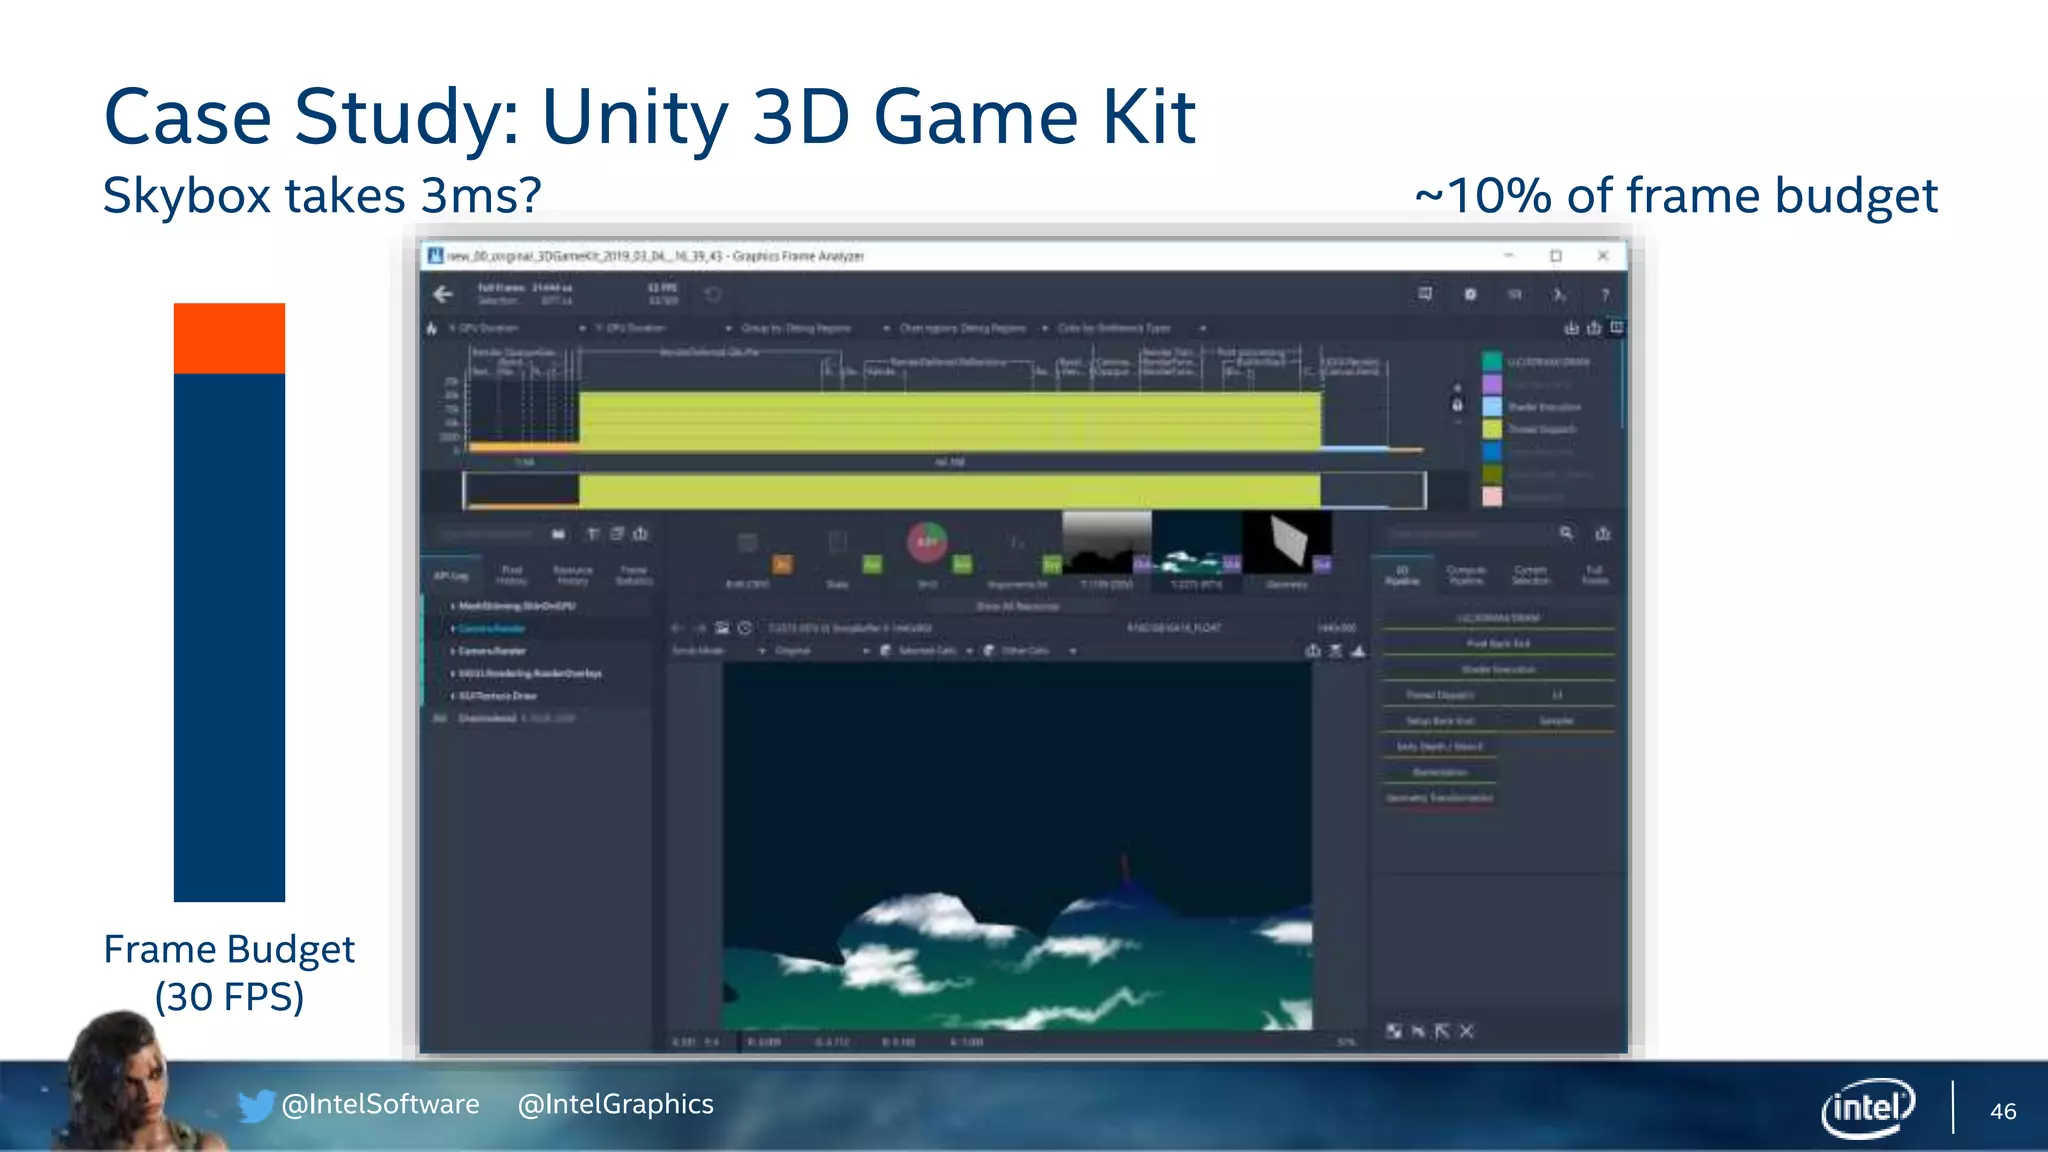
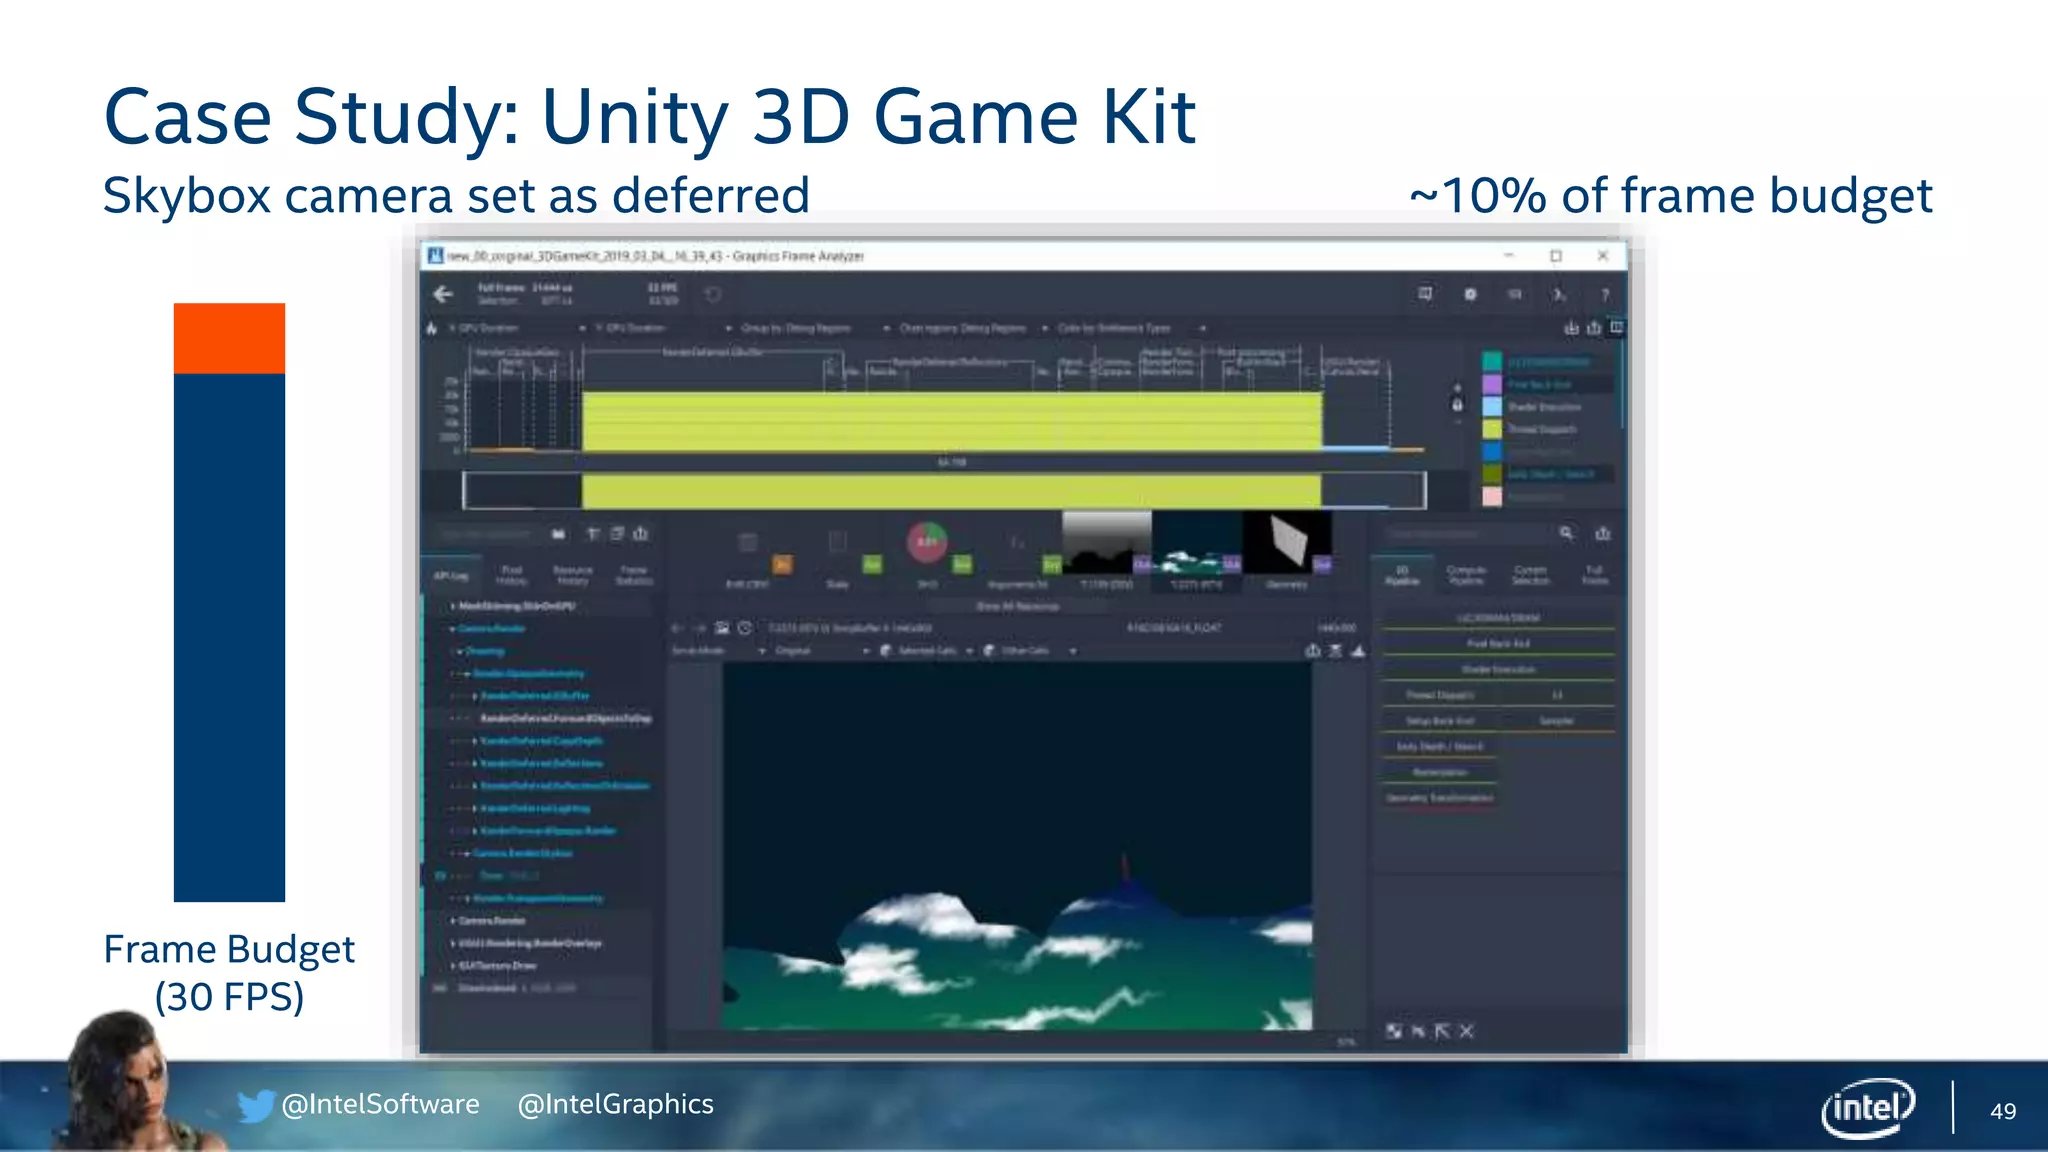
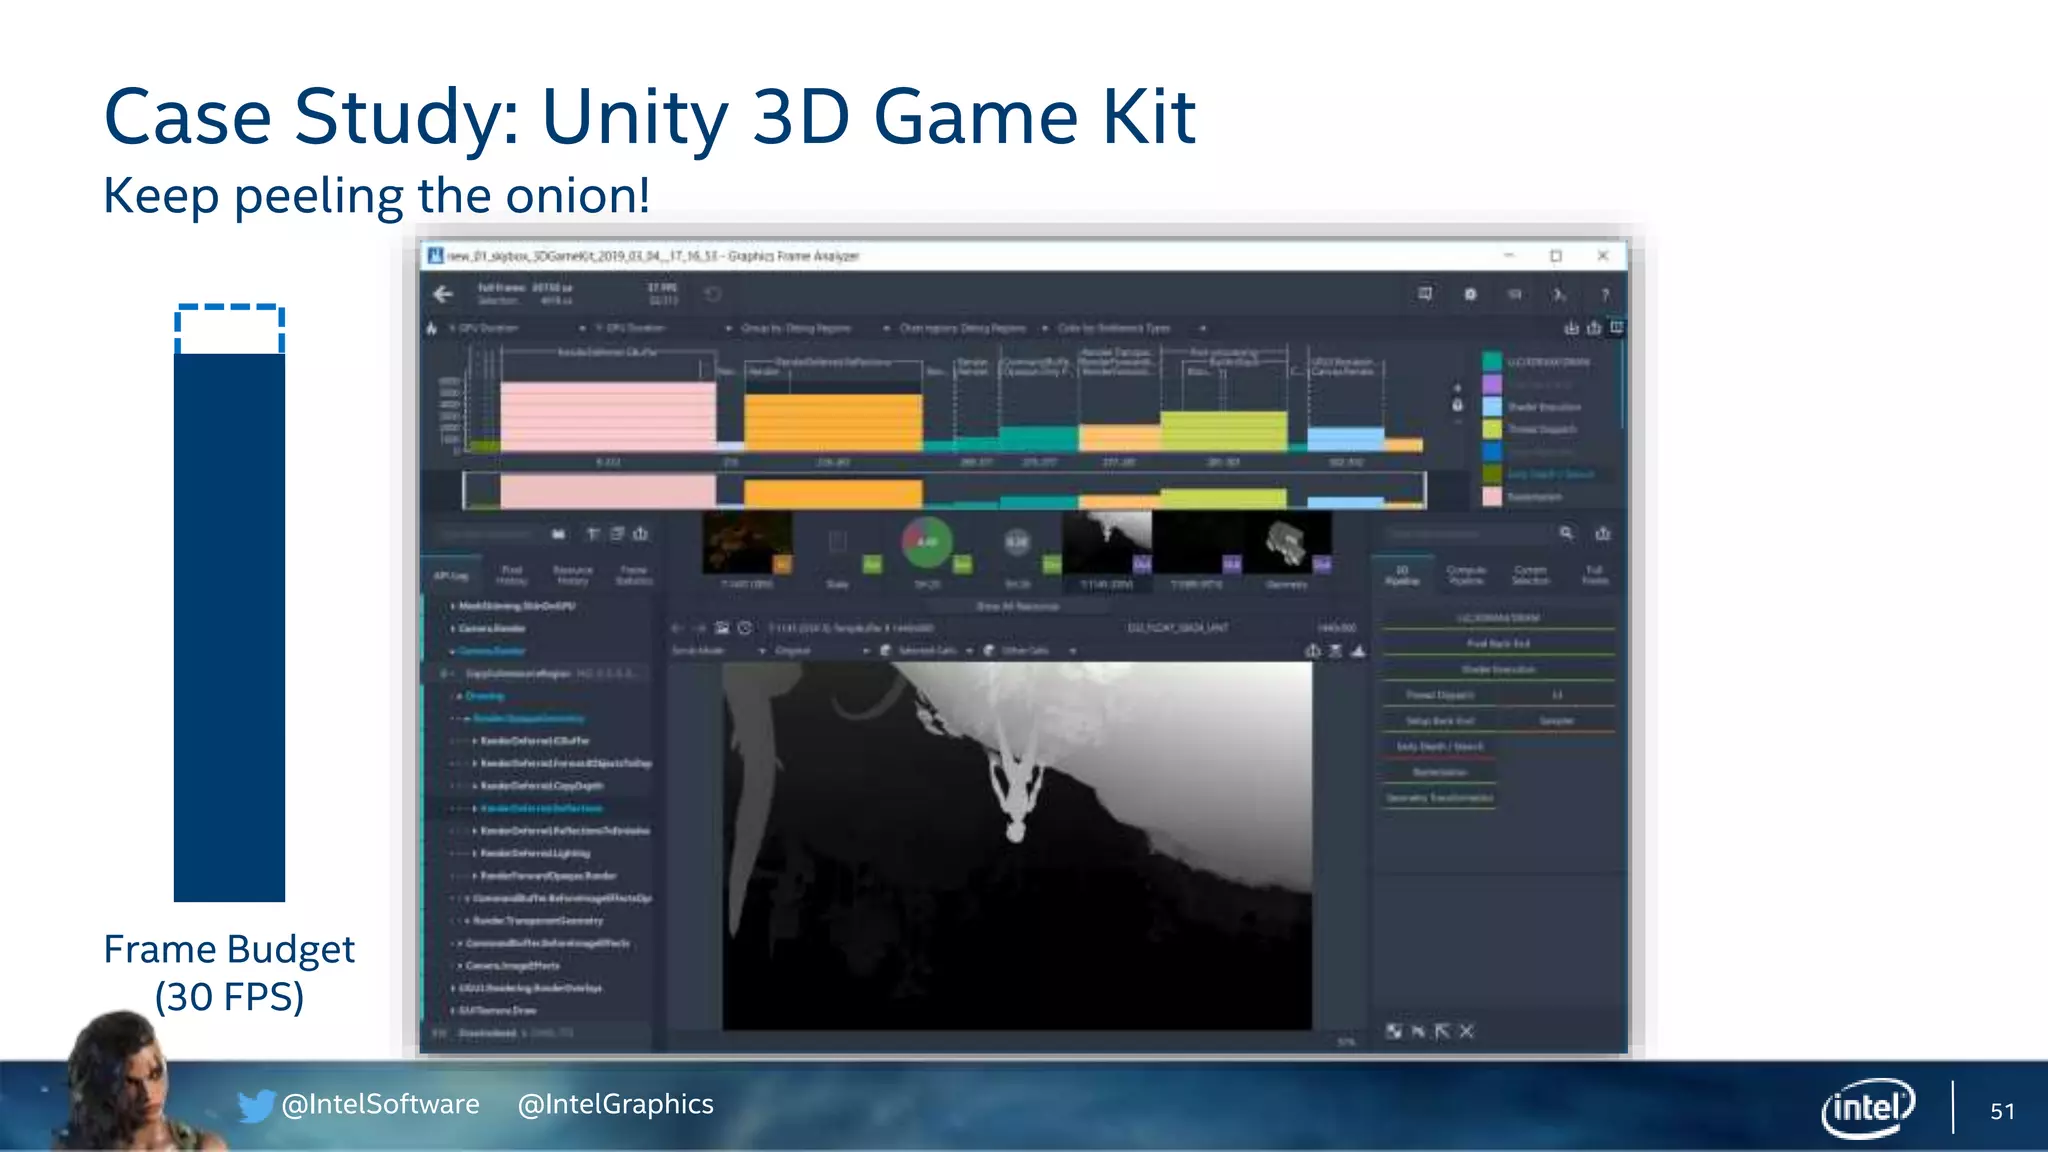
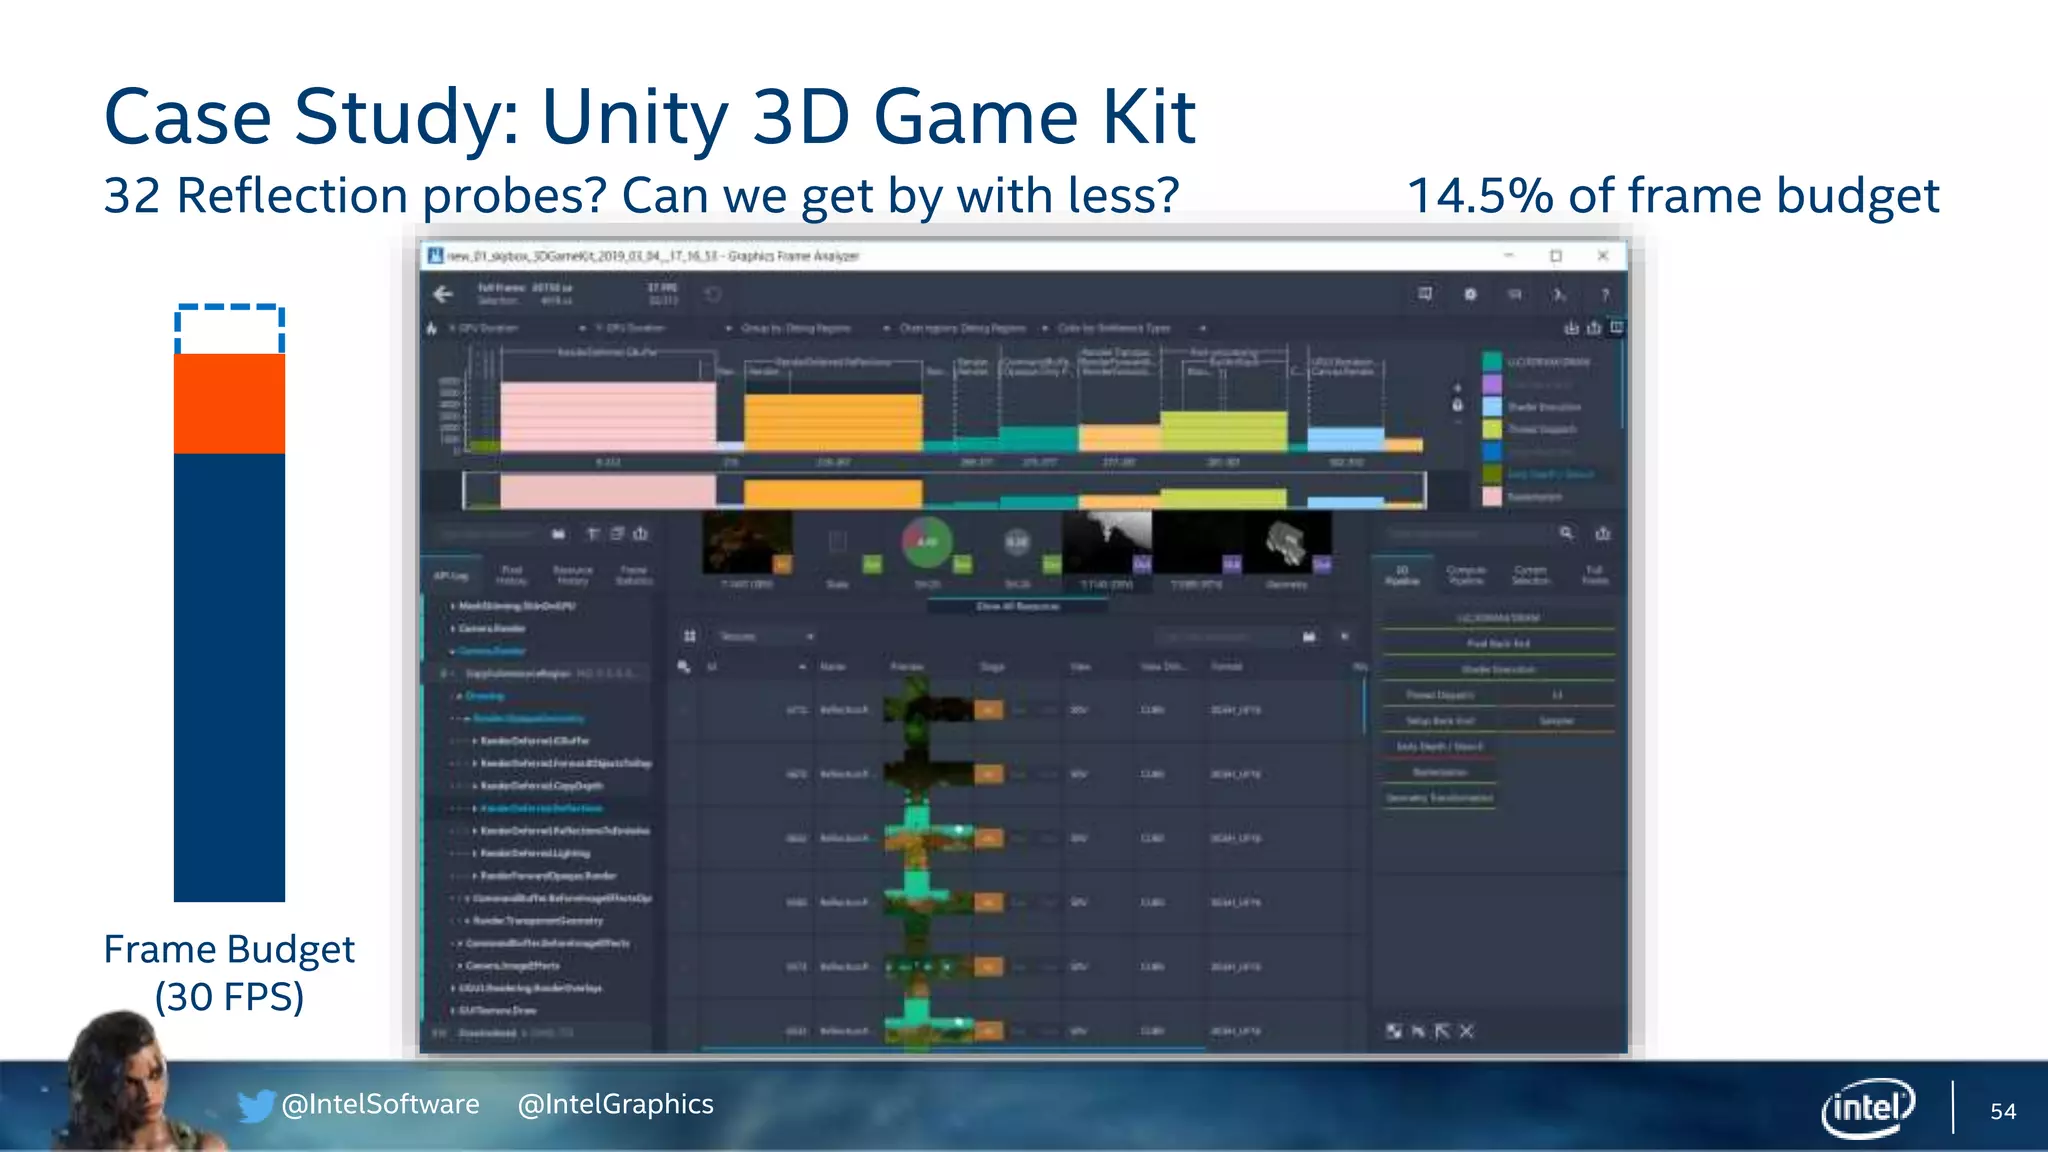
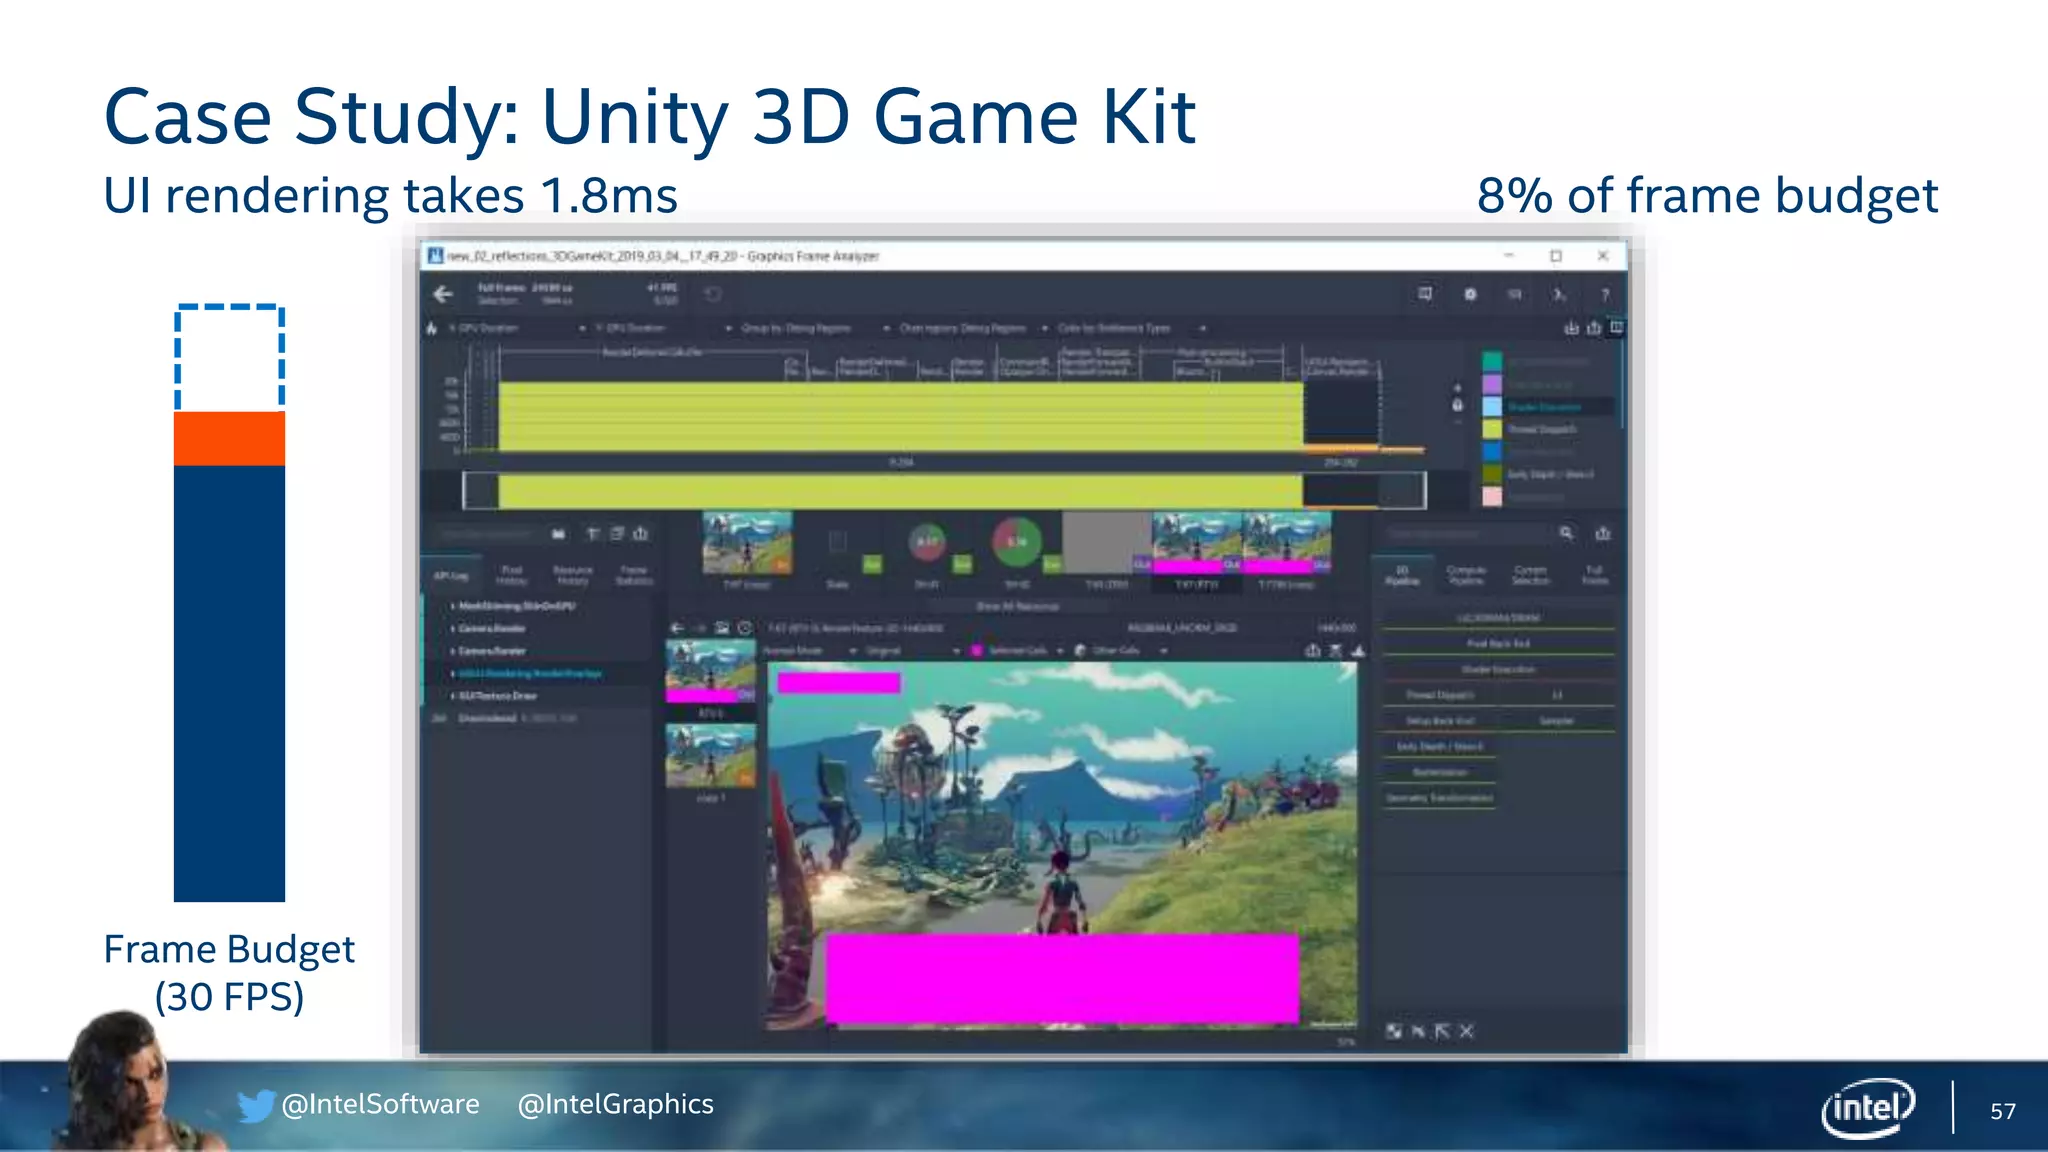
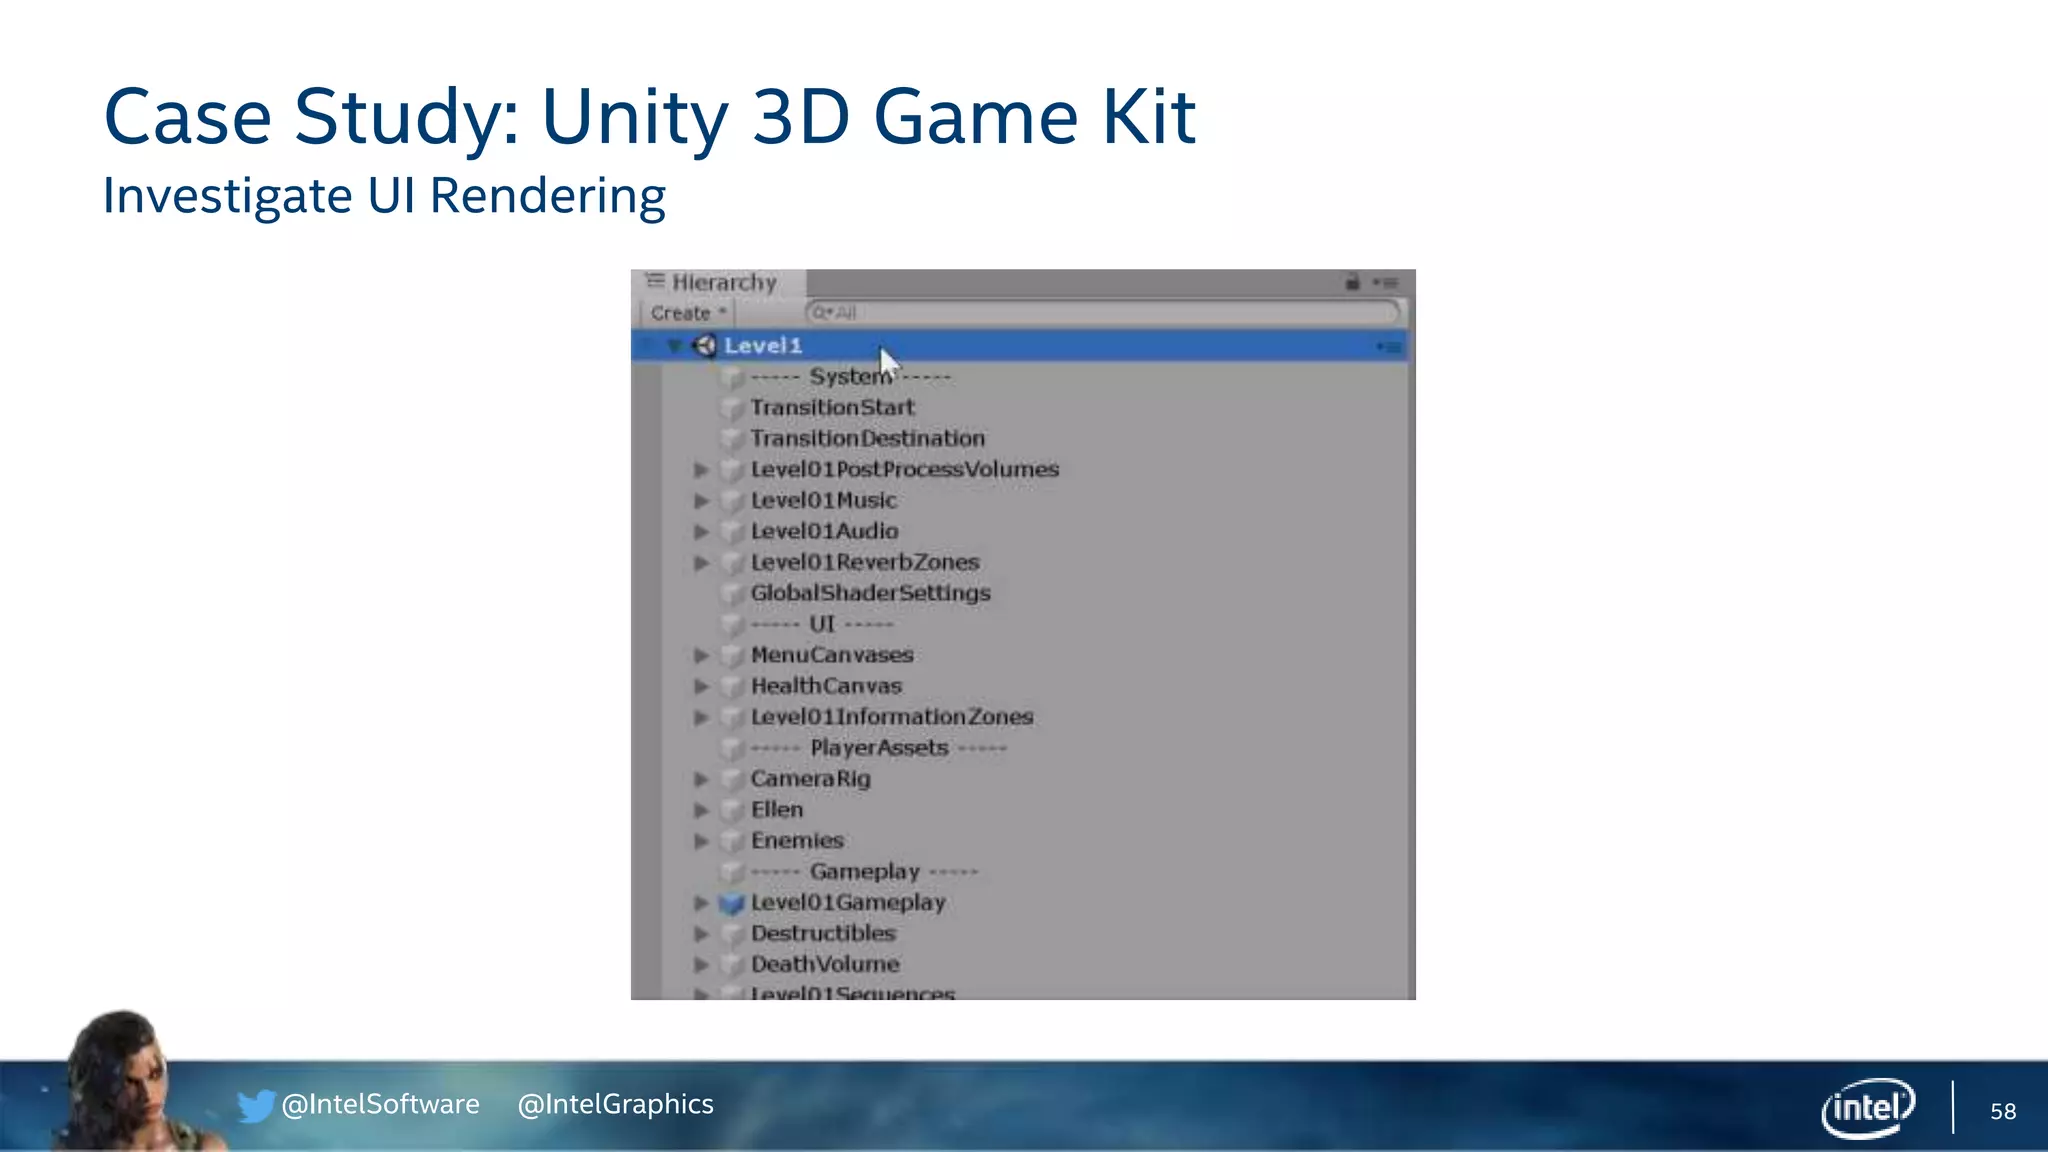
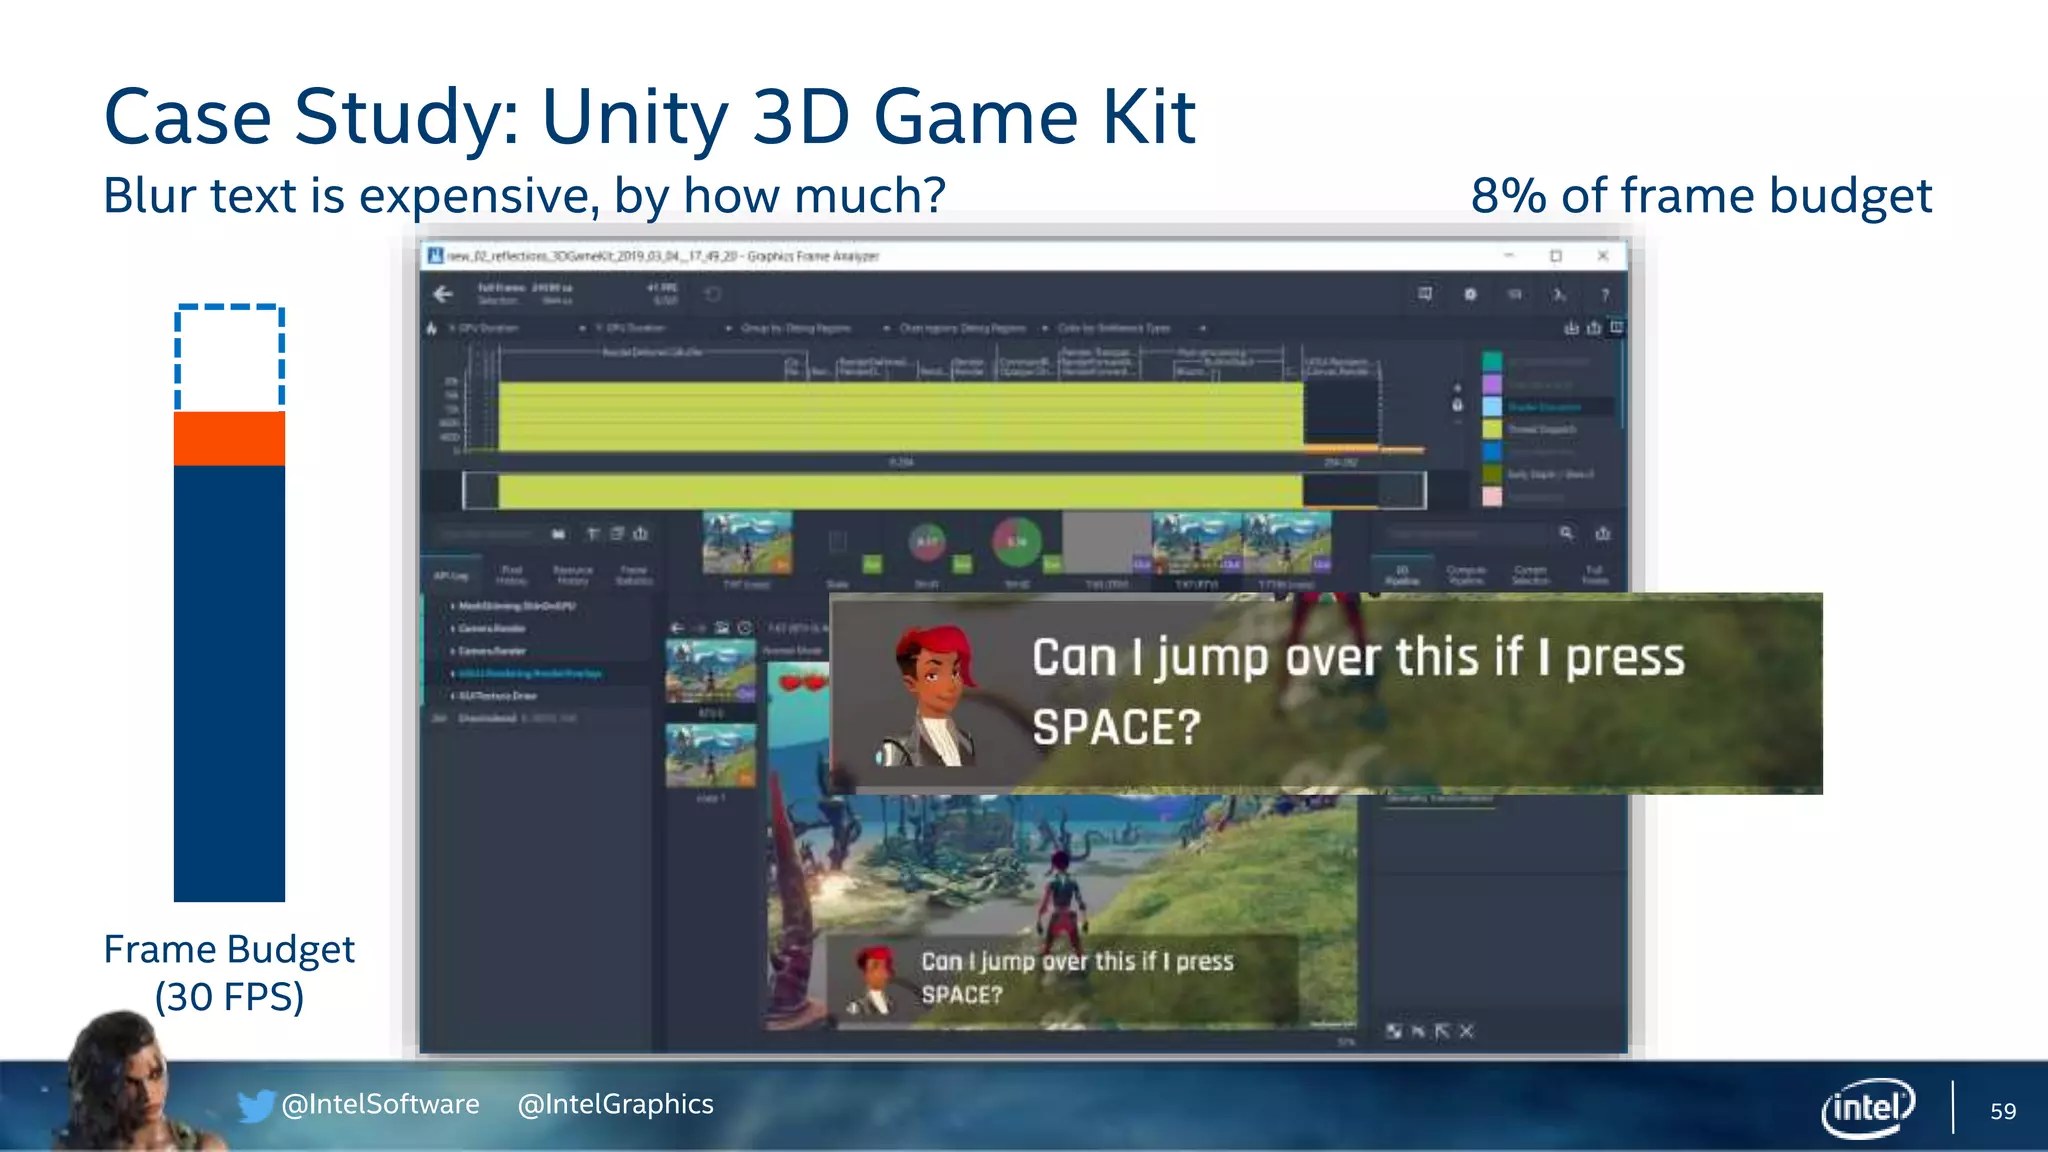
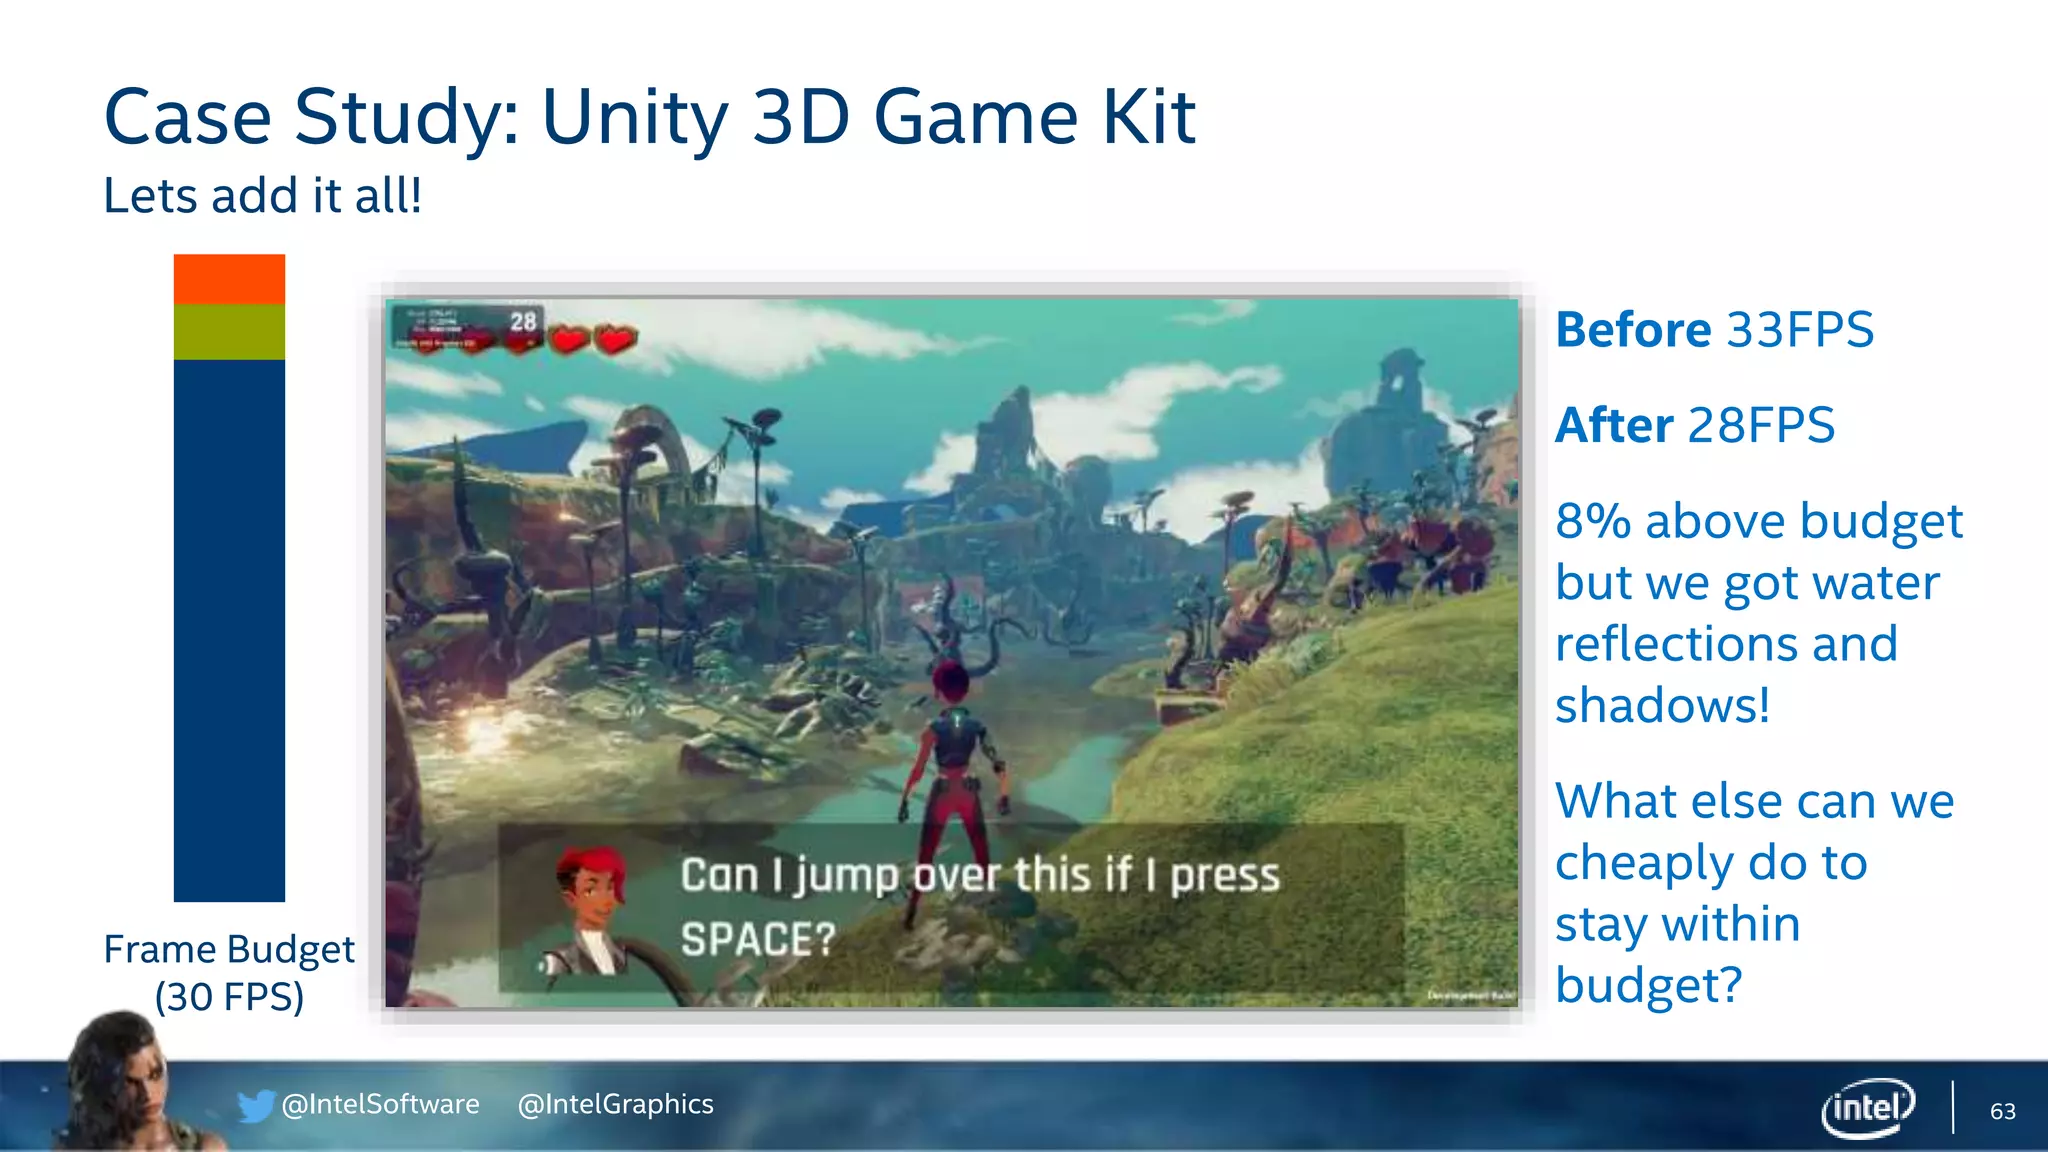
Analyzes frame budget in Unity, detailing component contributions to FPS and efforts taken to optimize performance.
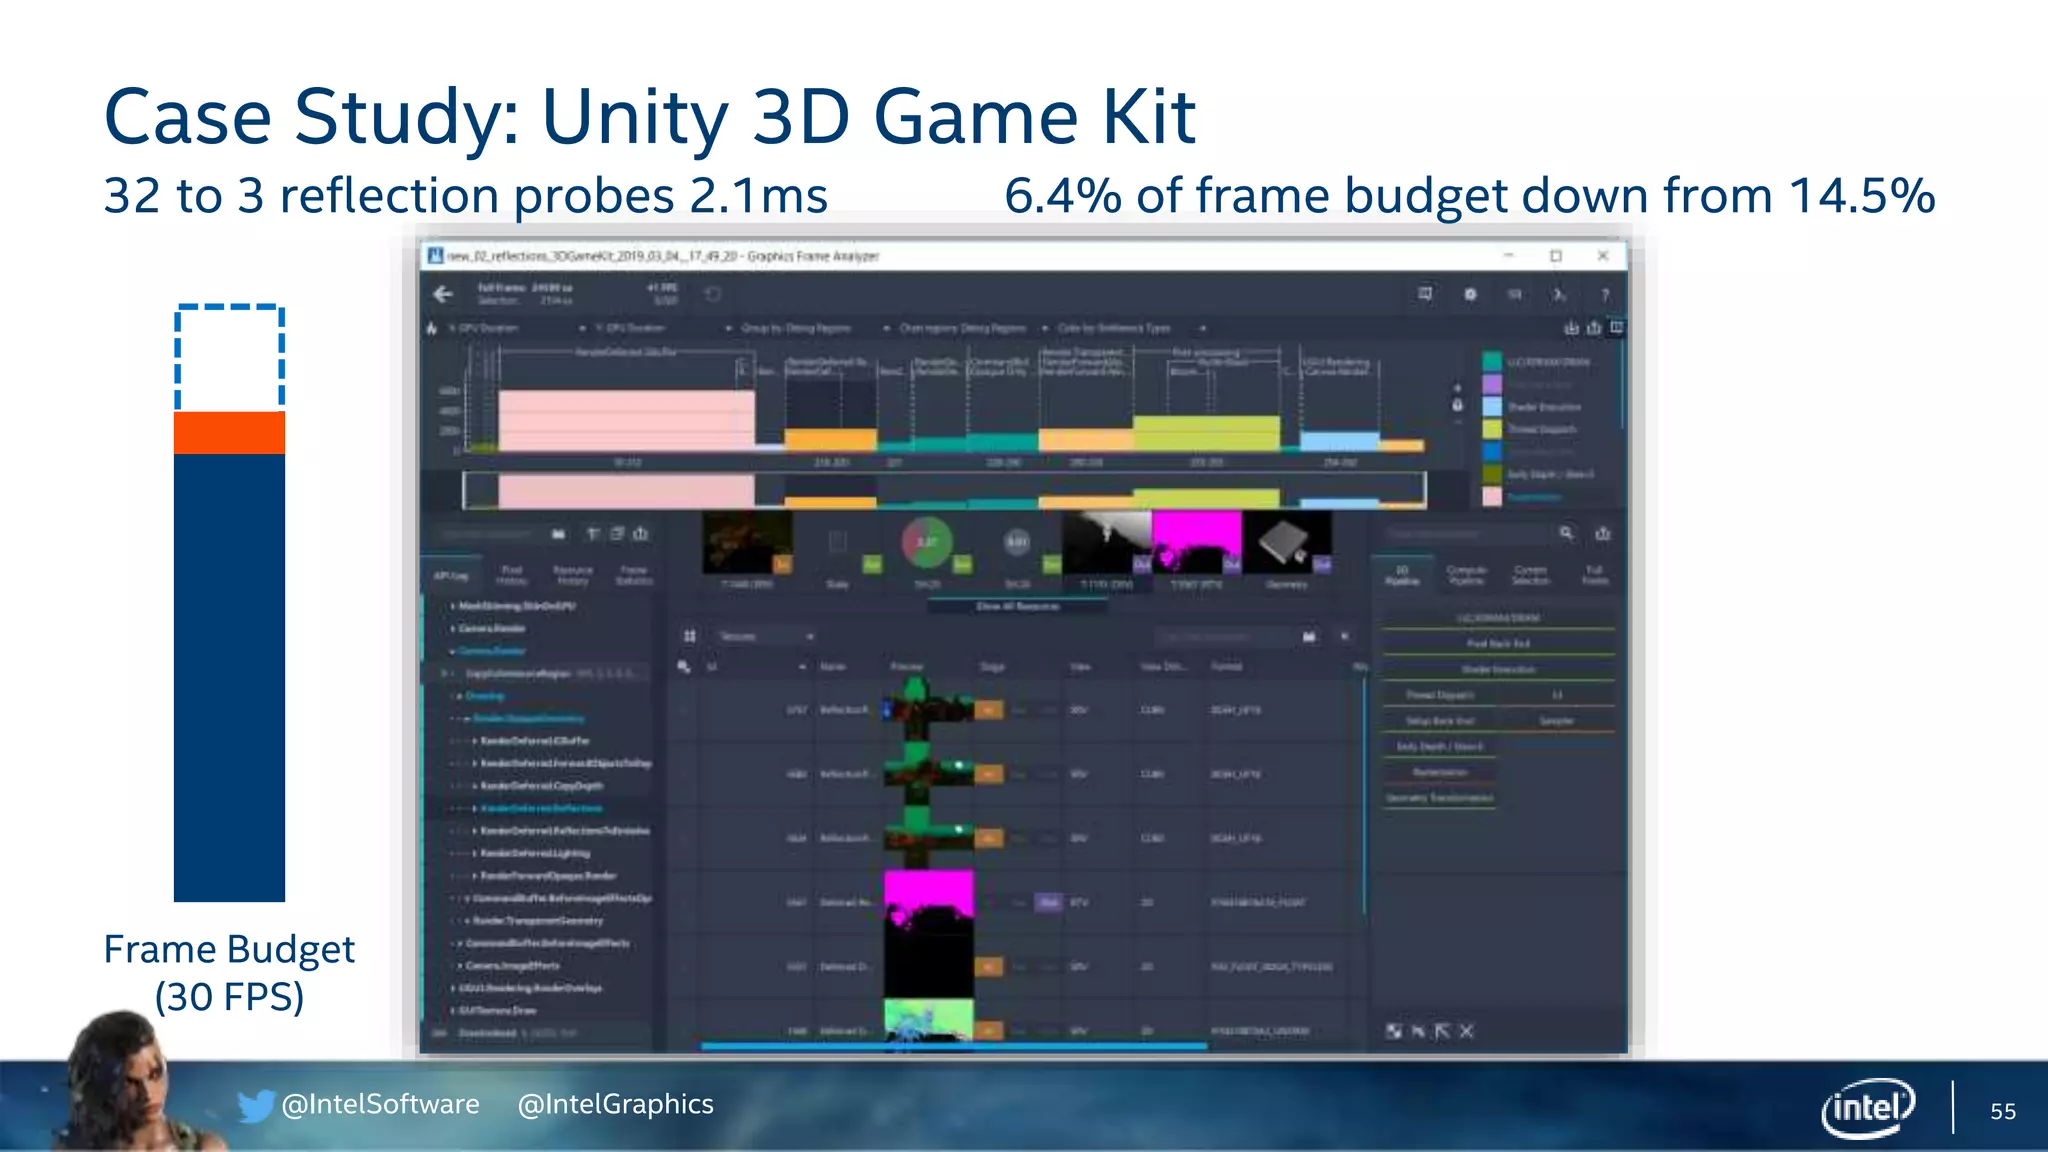
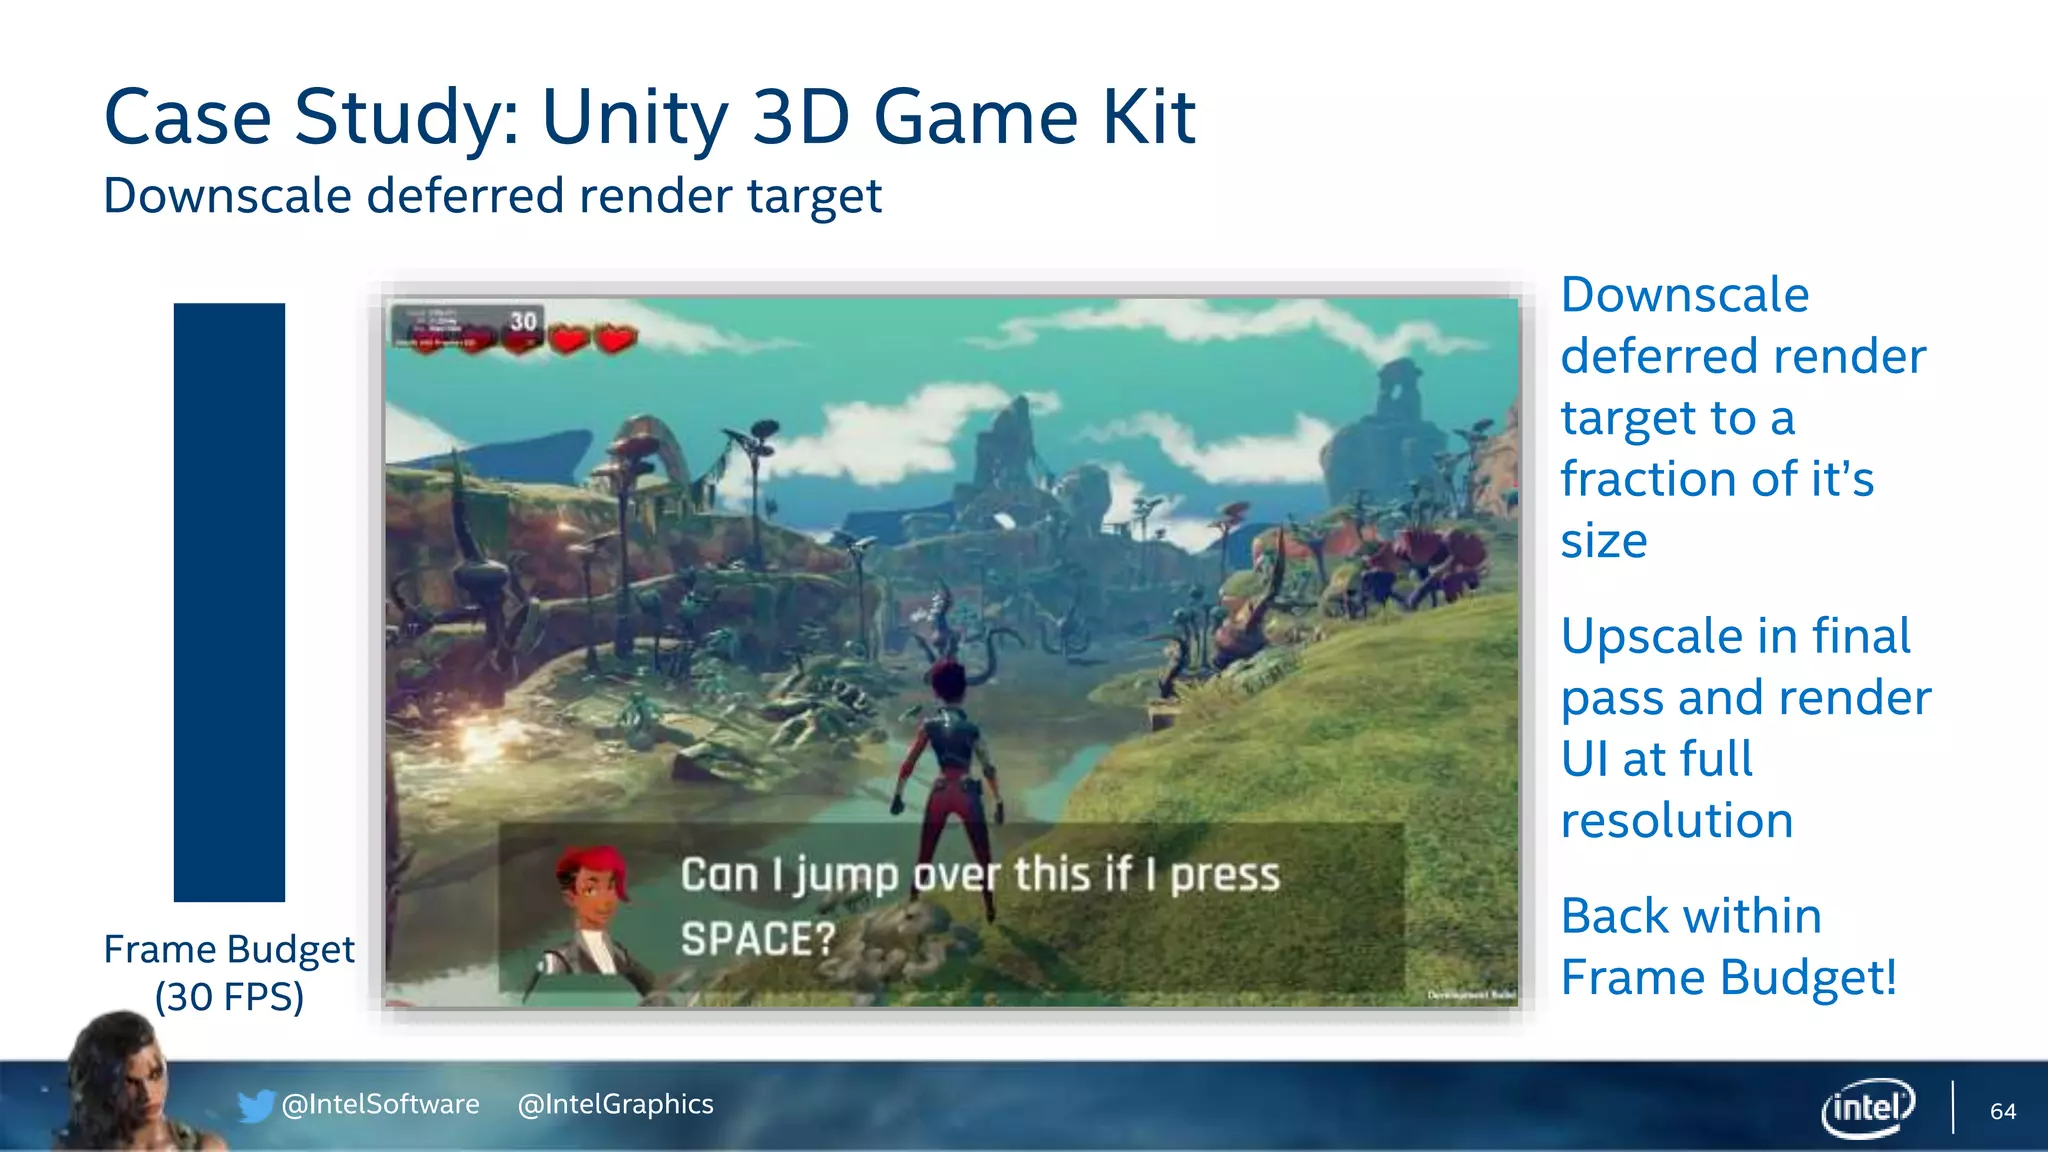
Final optimizations leading to performance improvements in Unity from 38 FPS down to target FPS with visual consolidations.
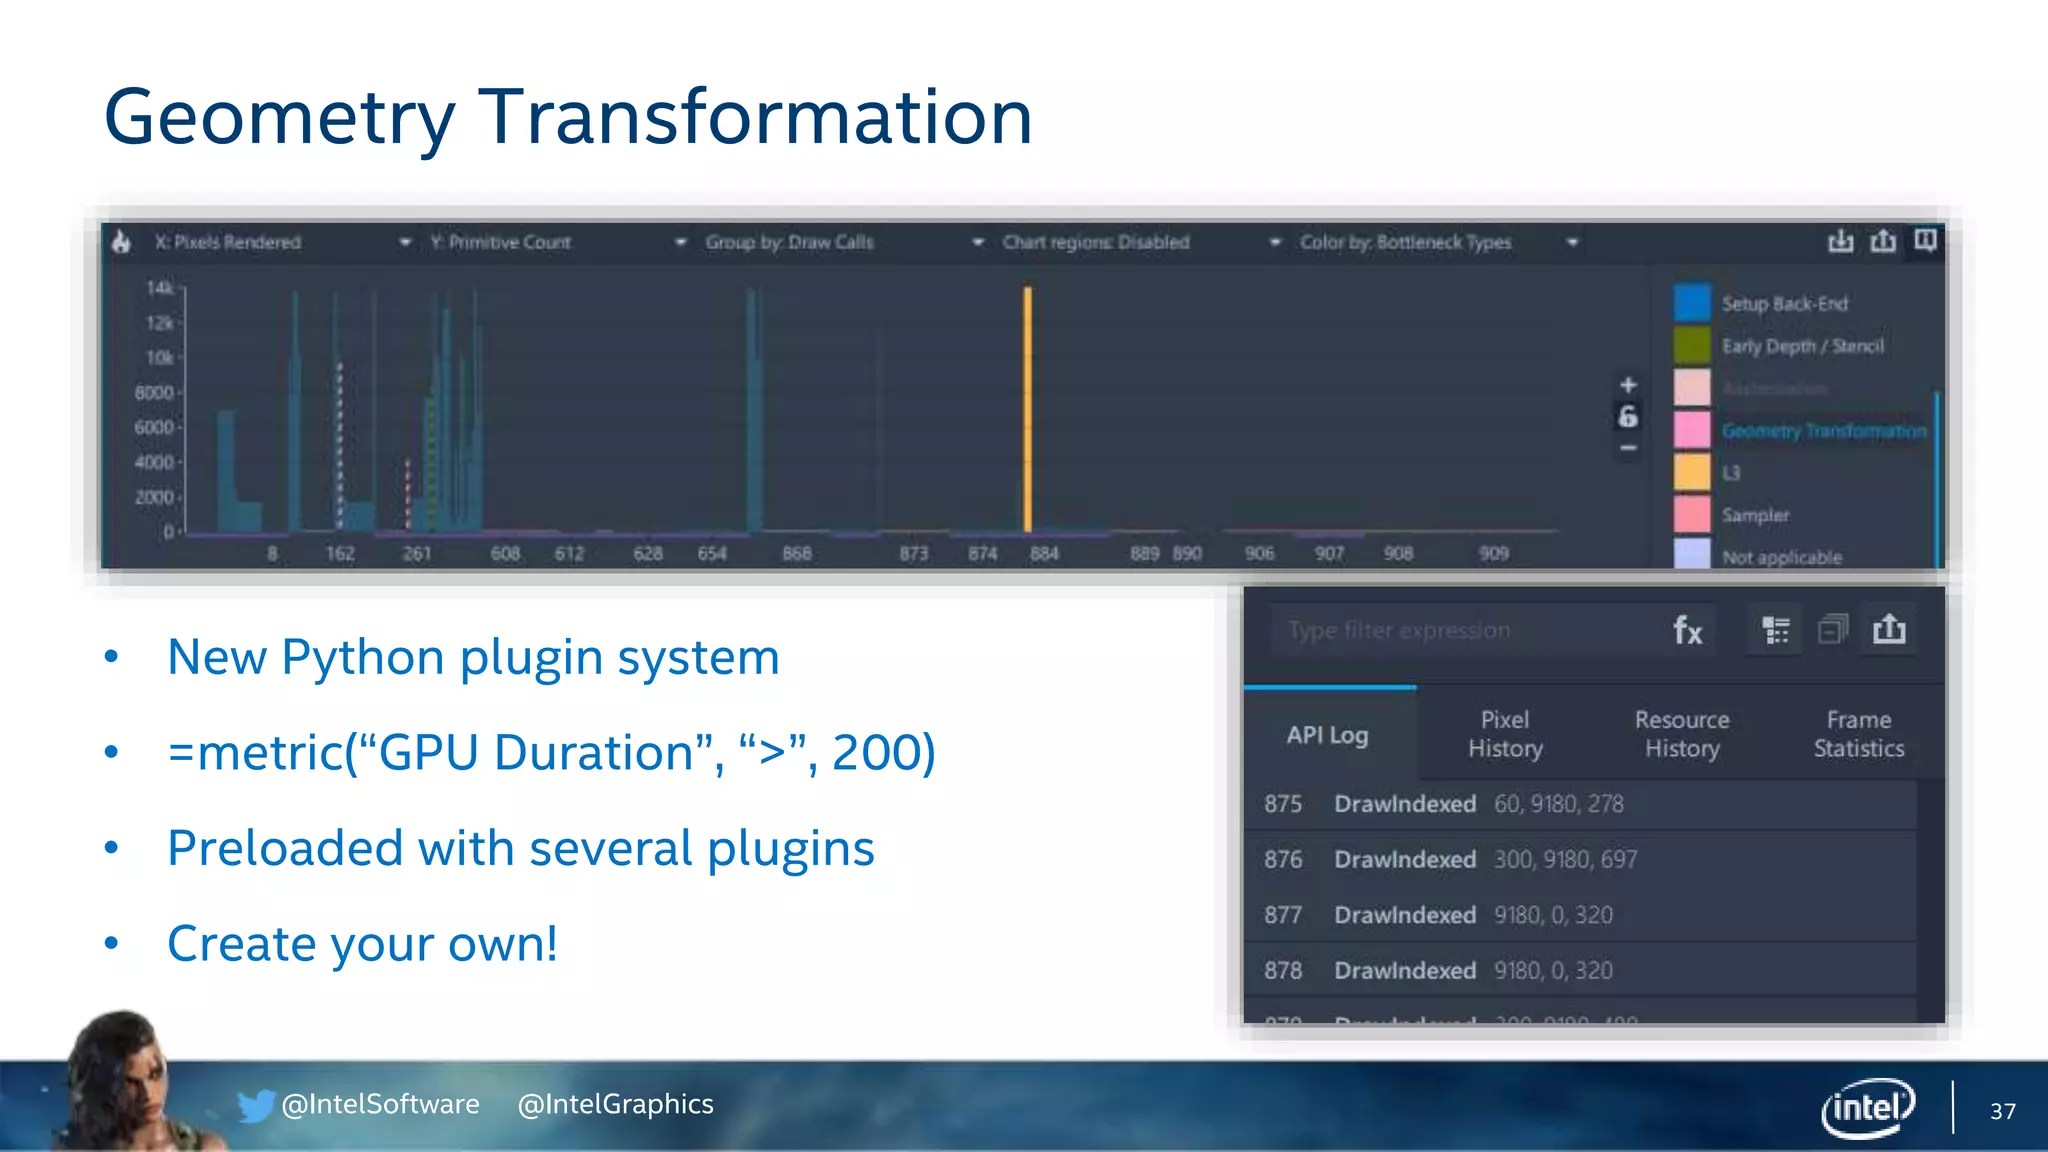
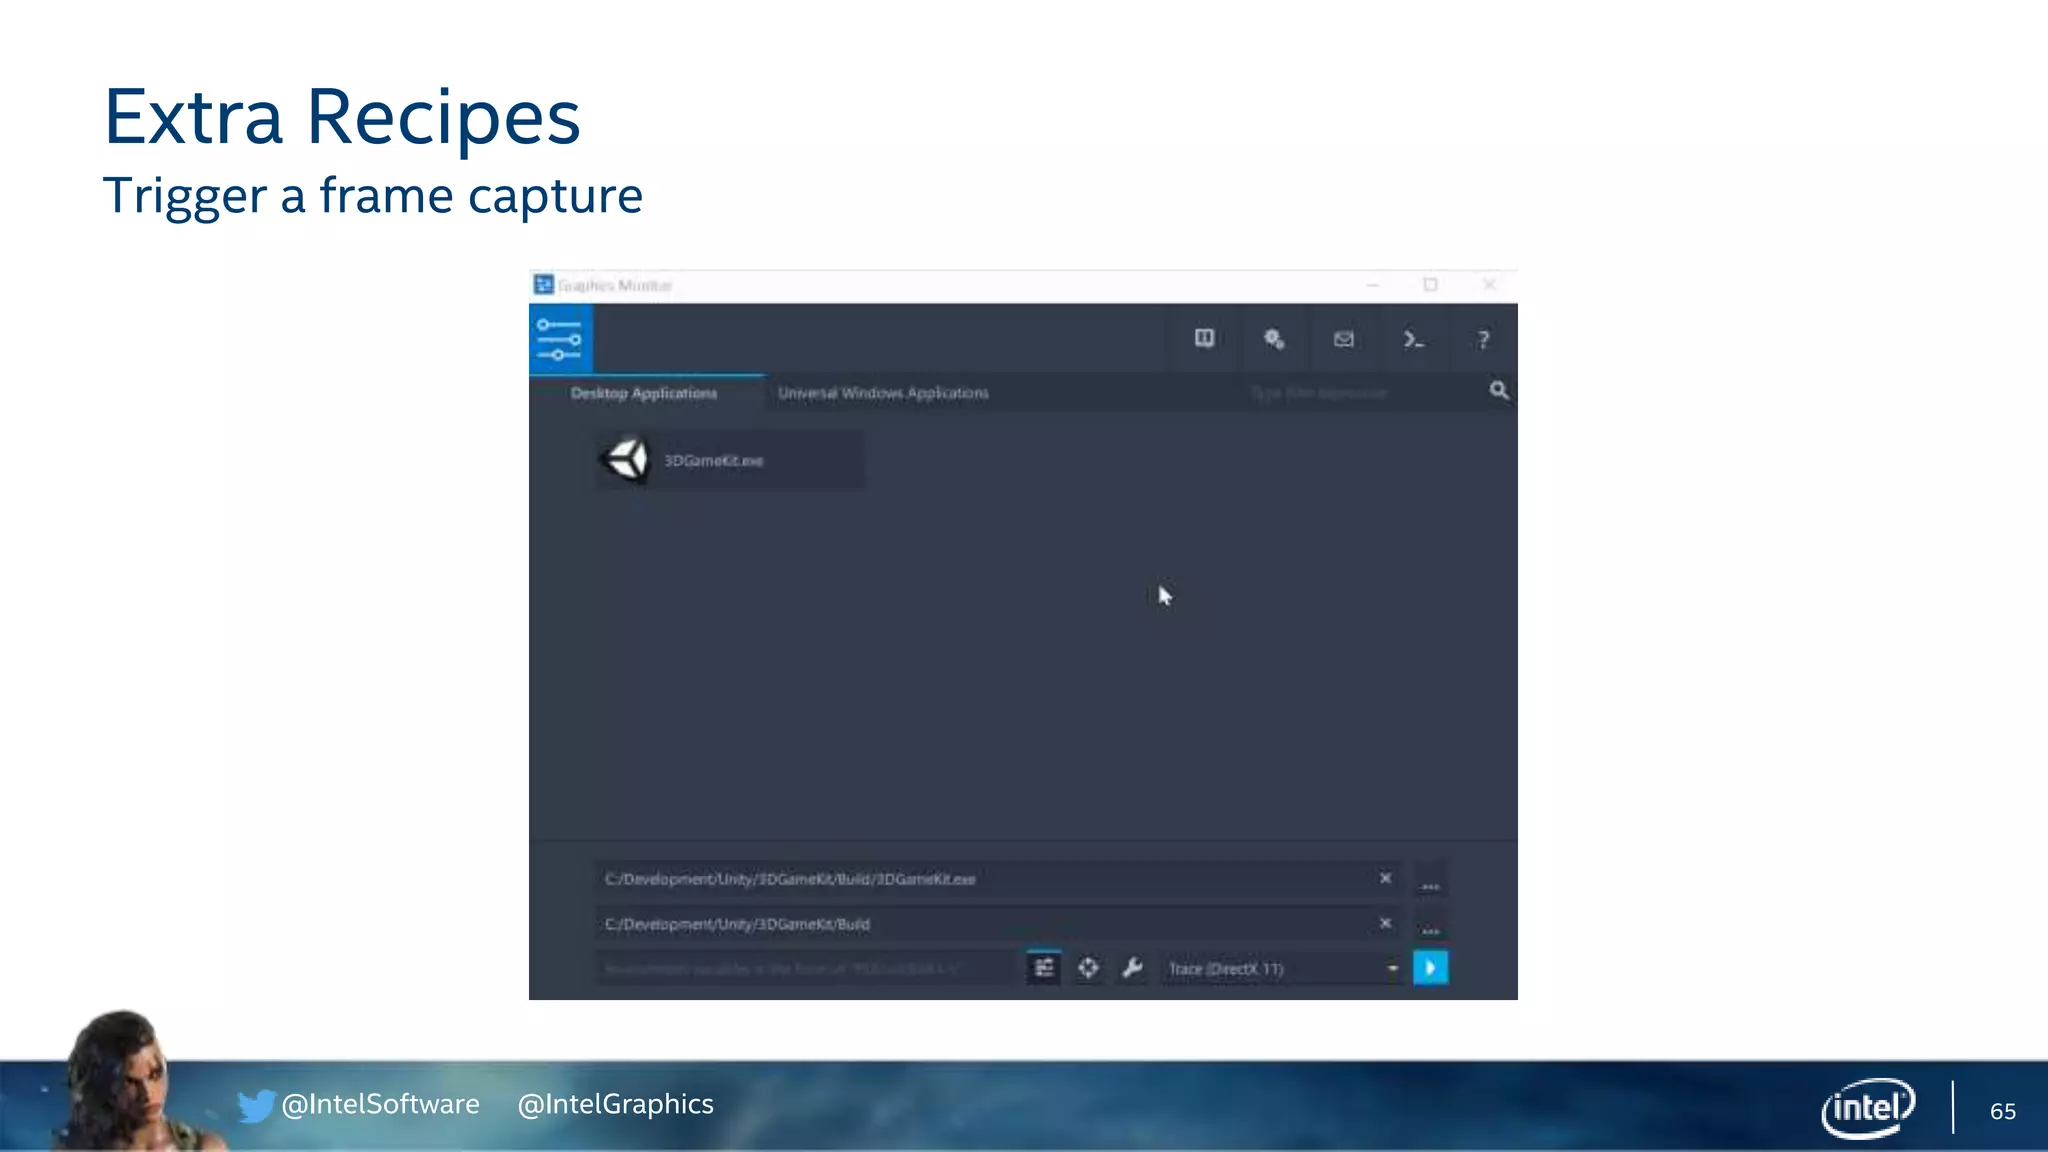
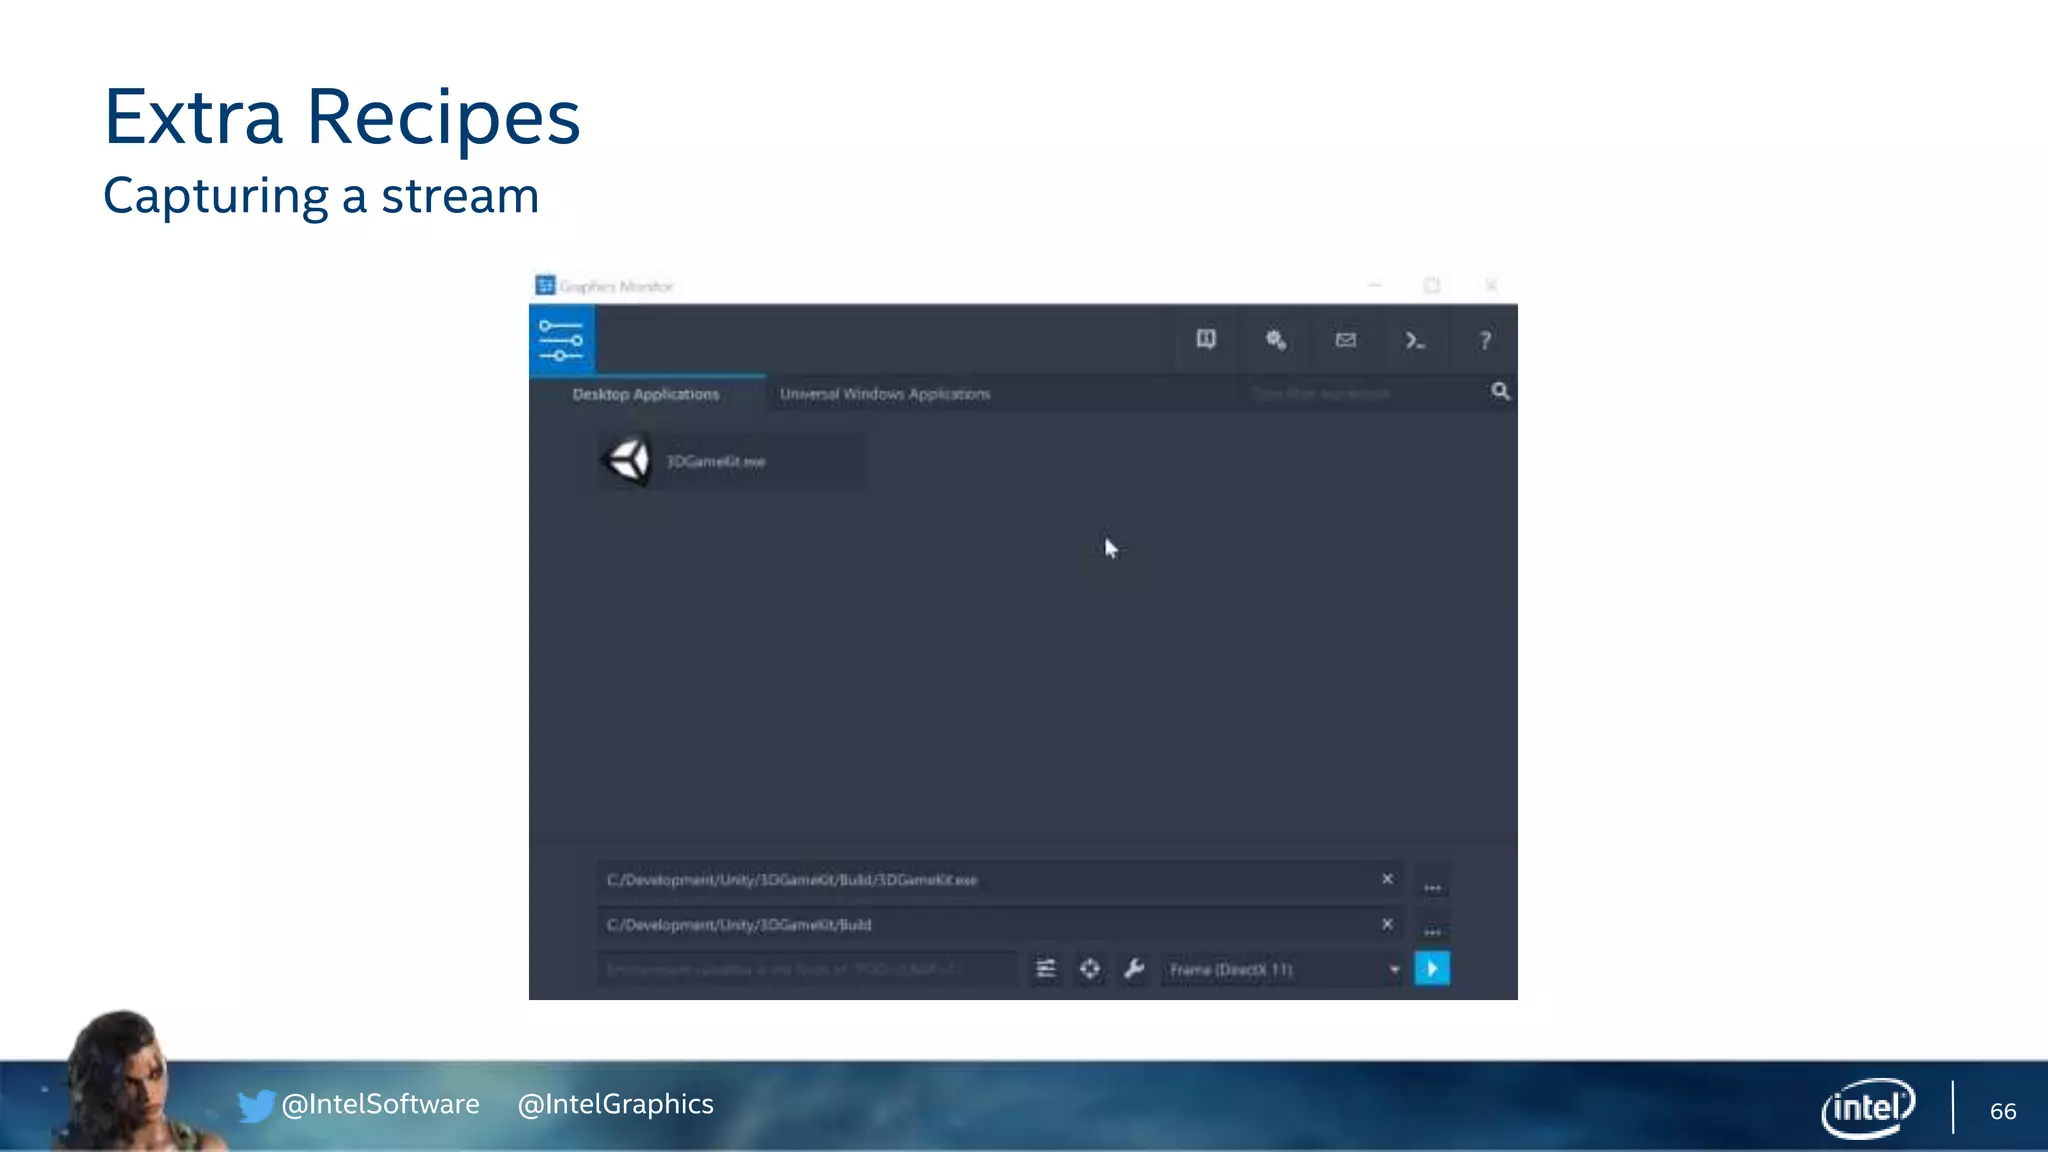
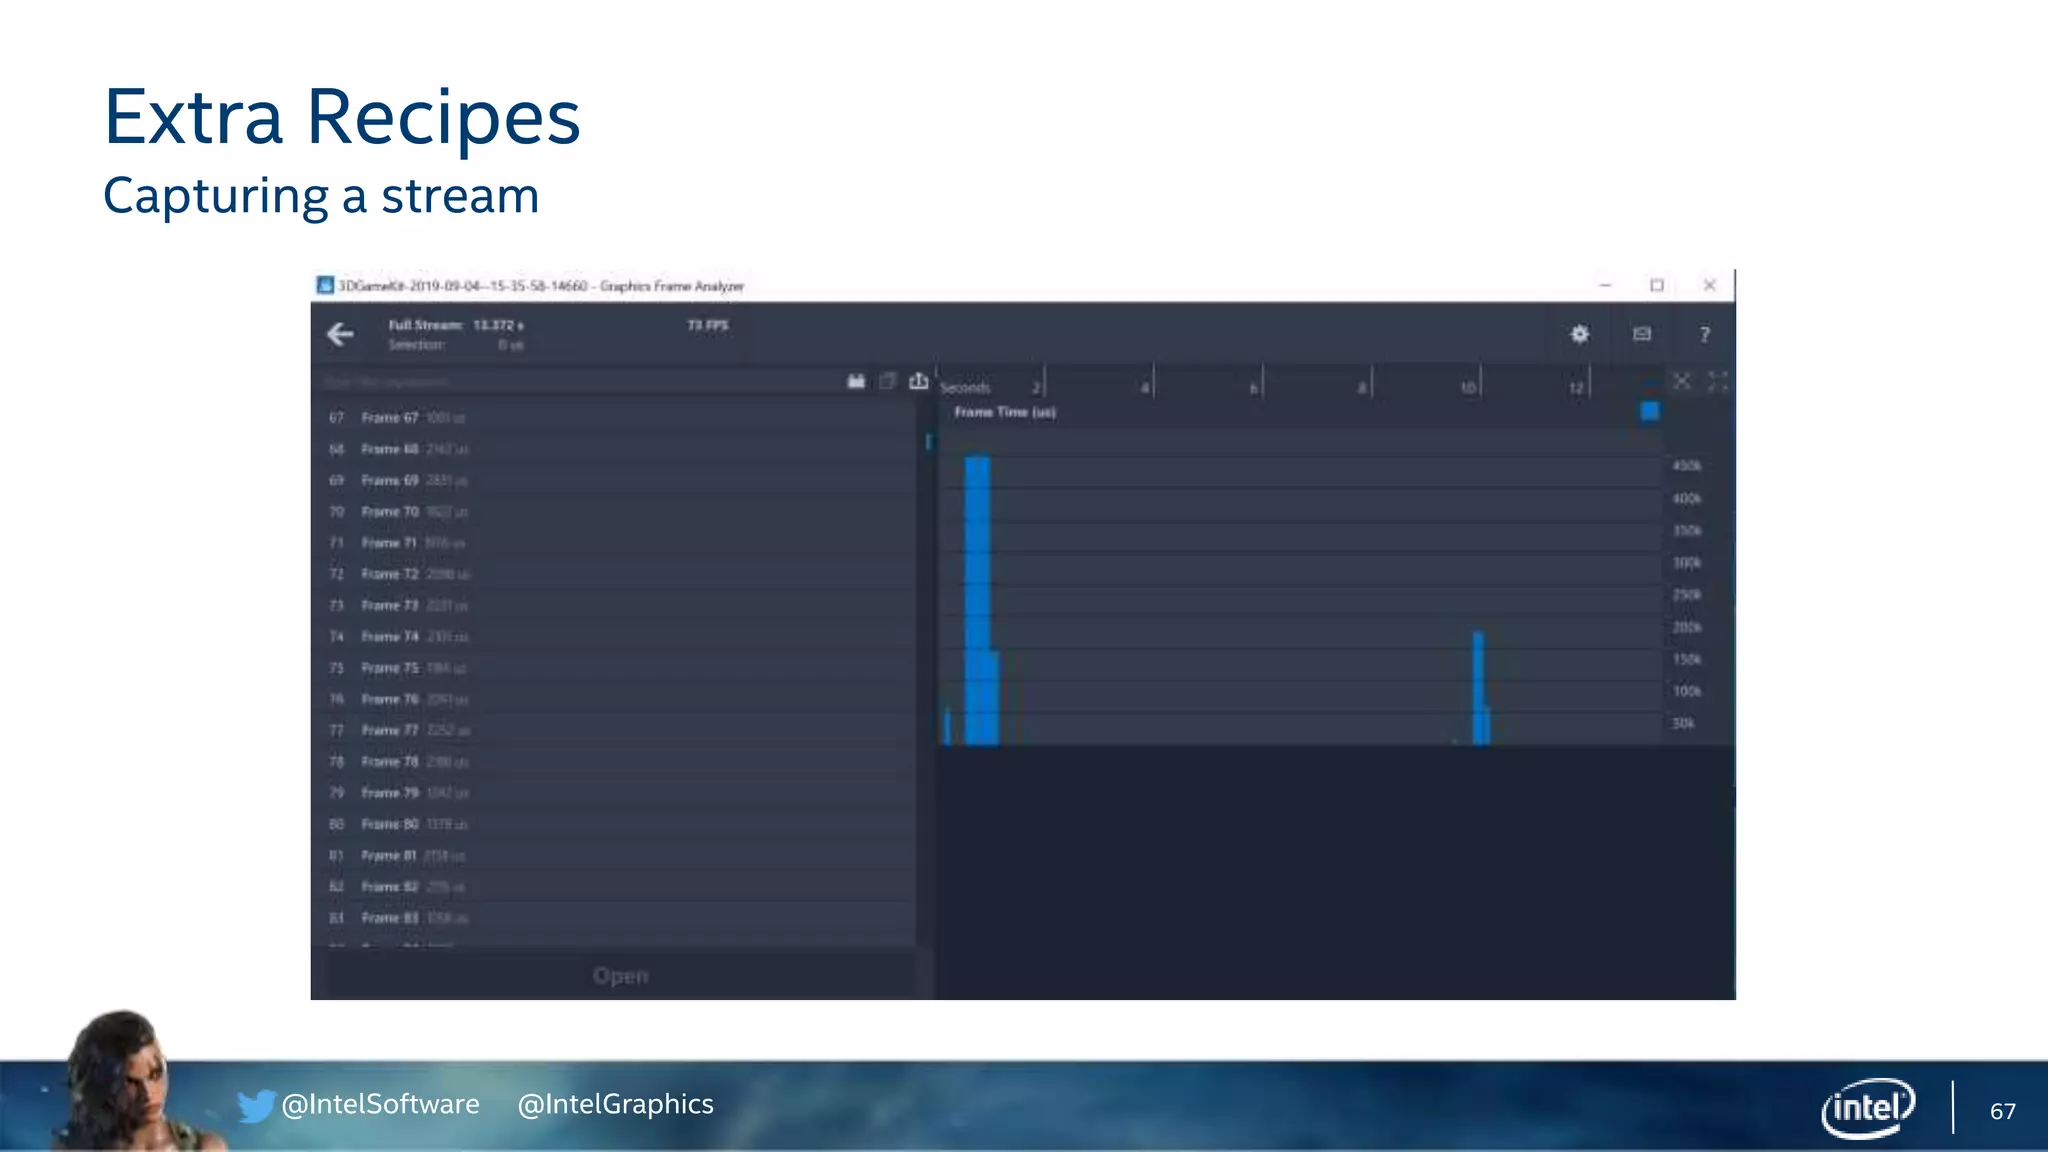
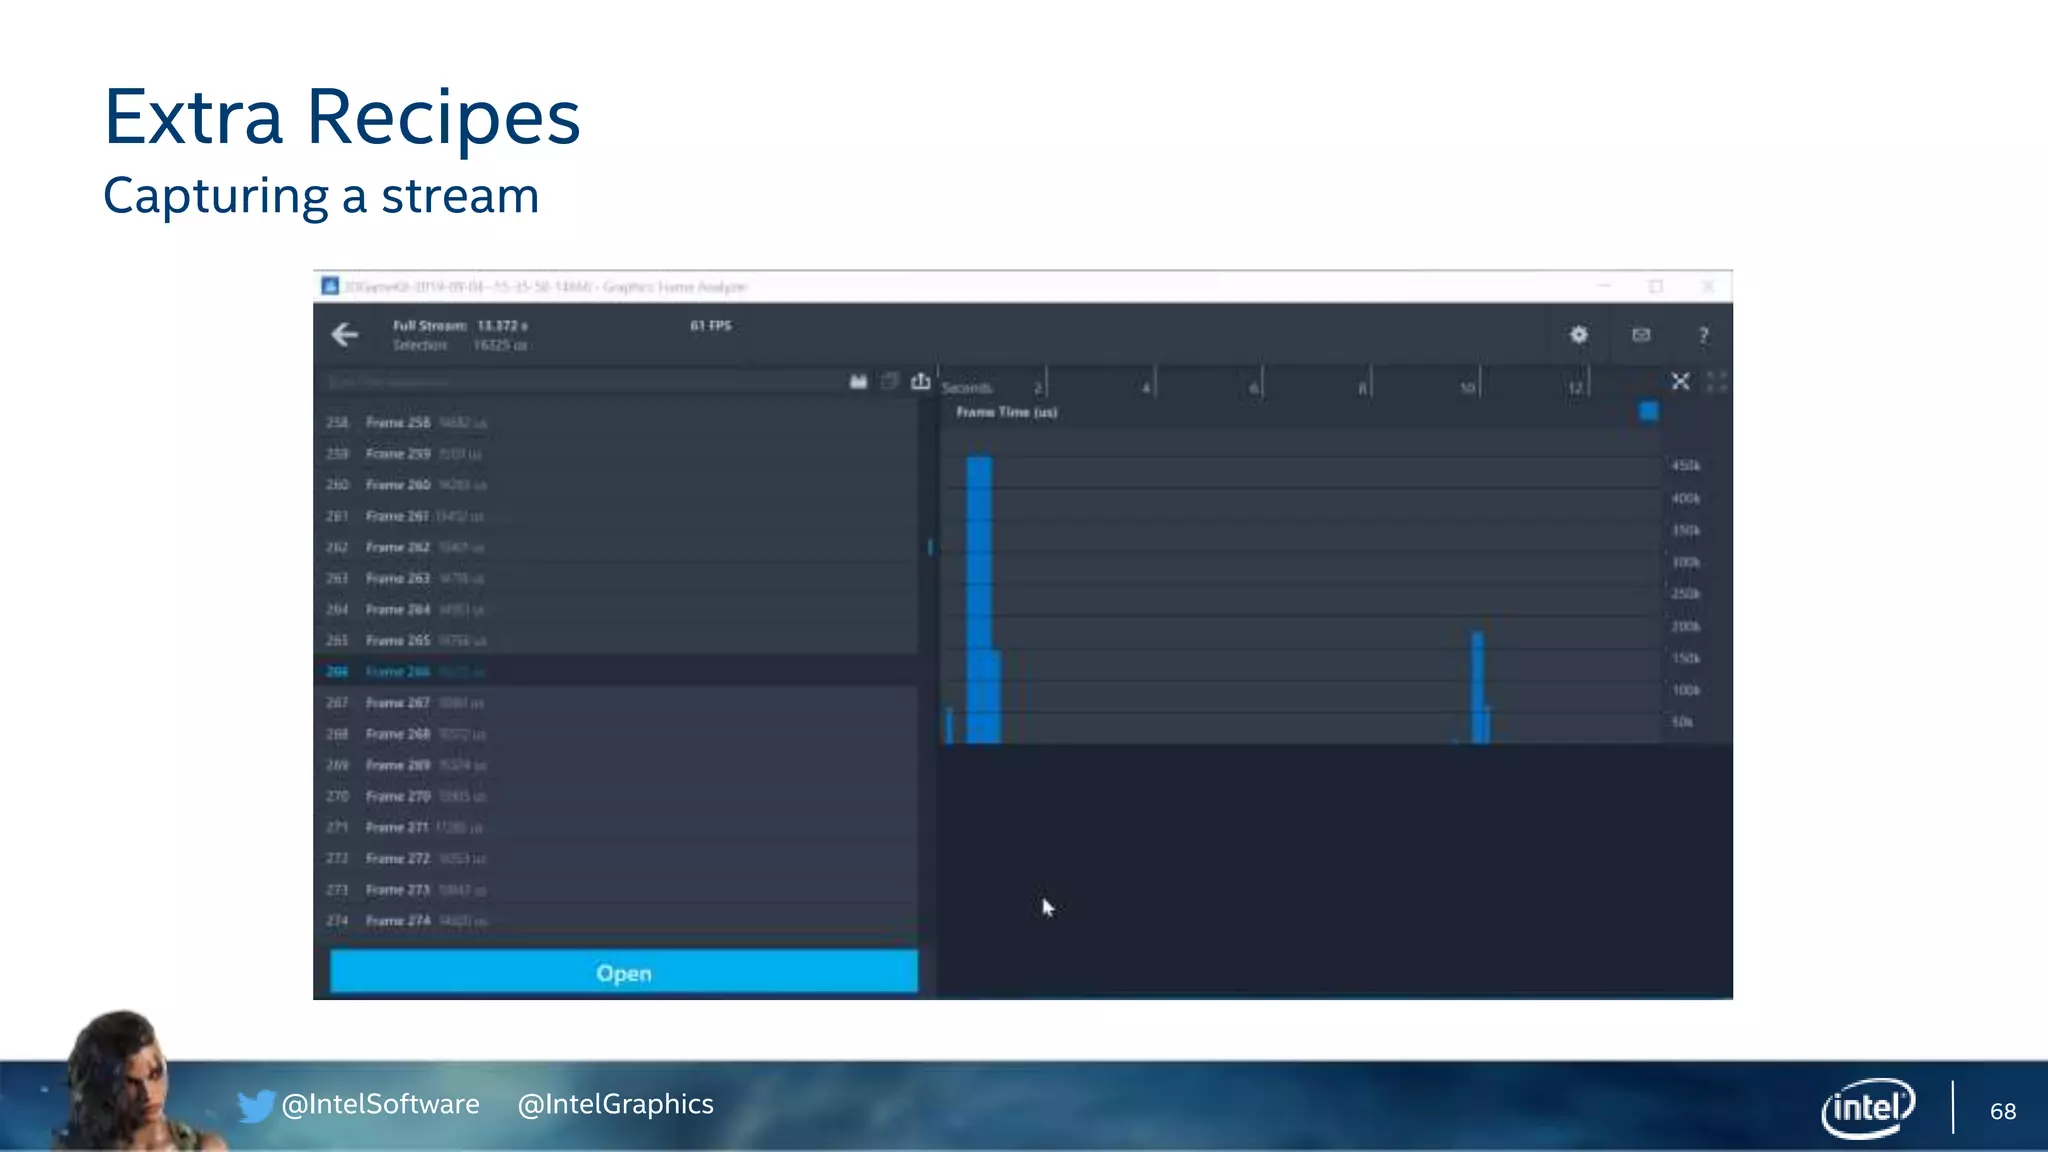
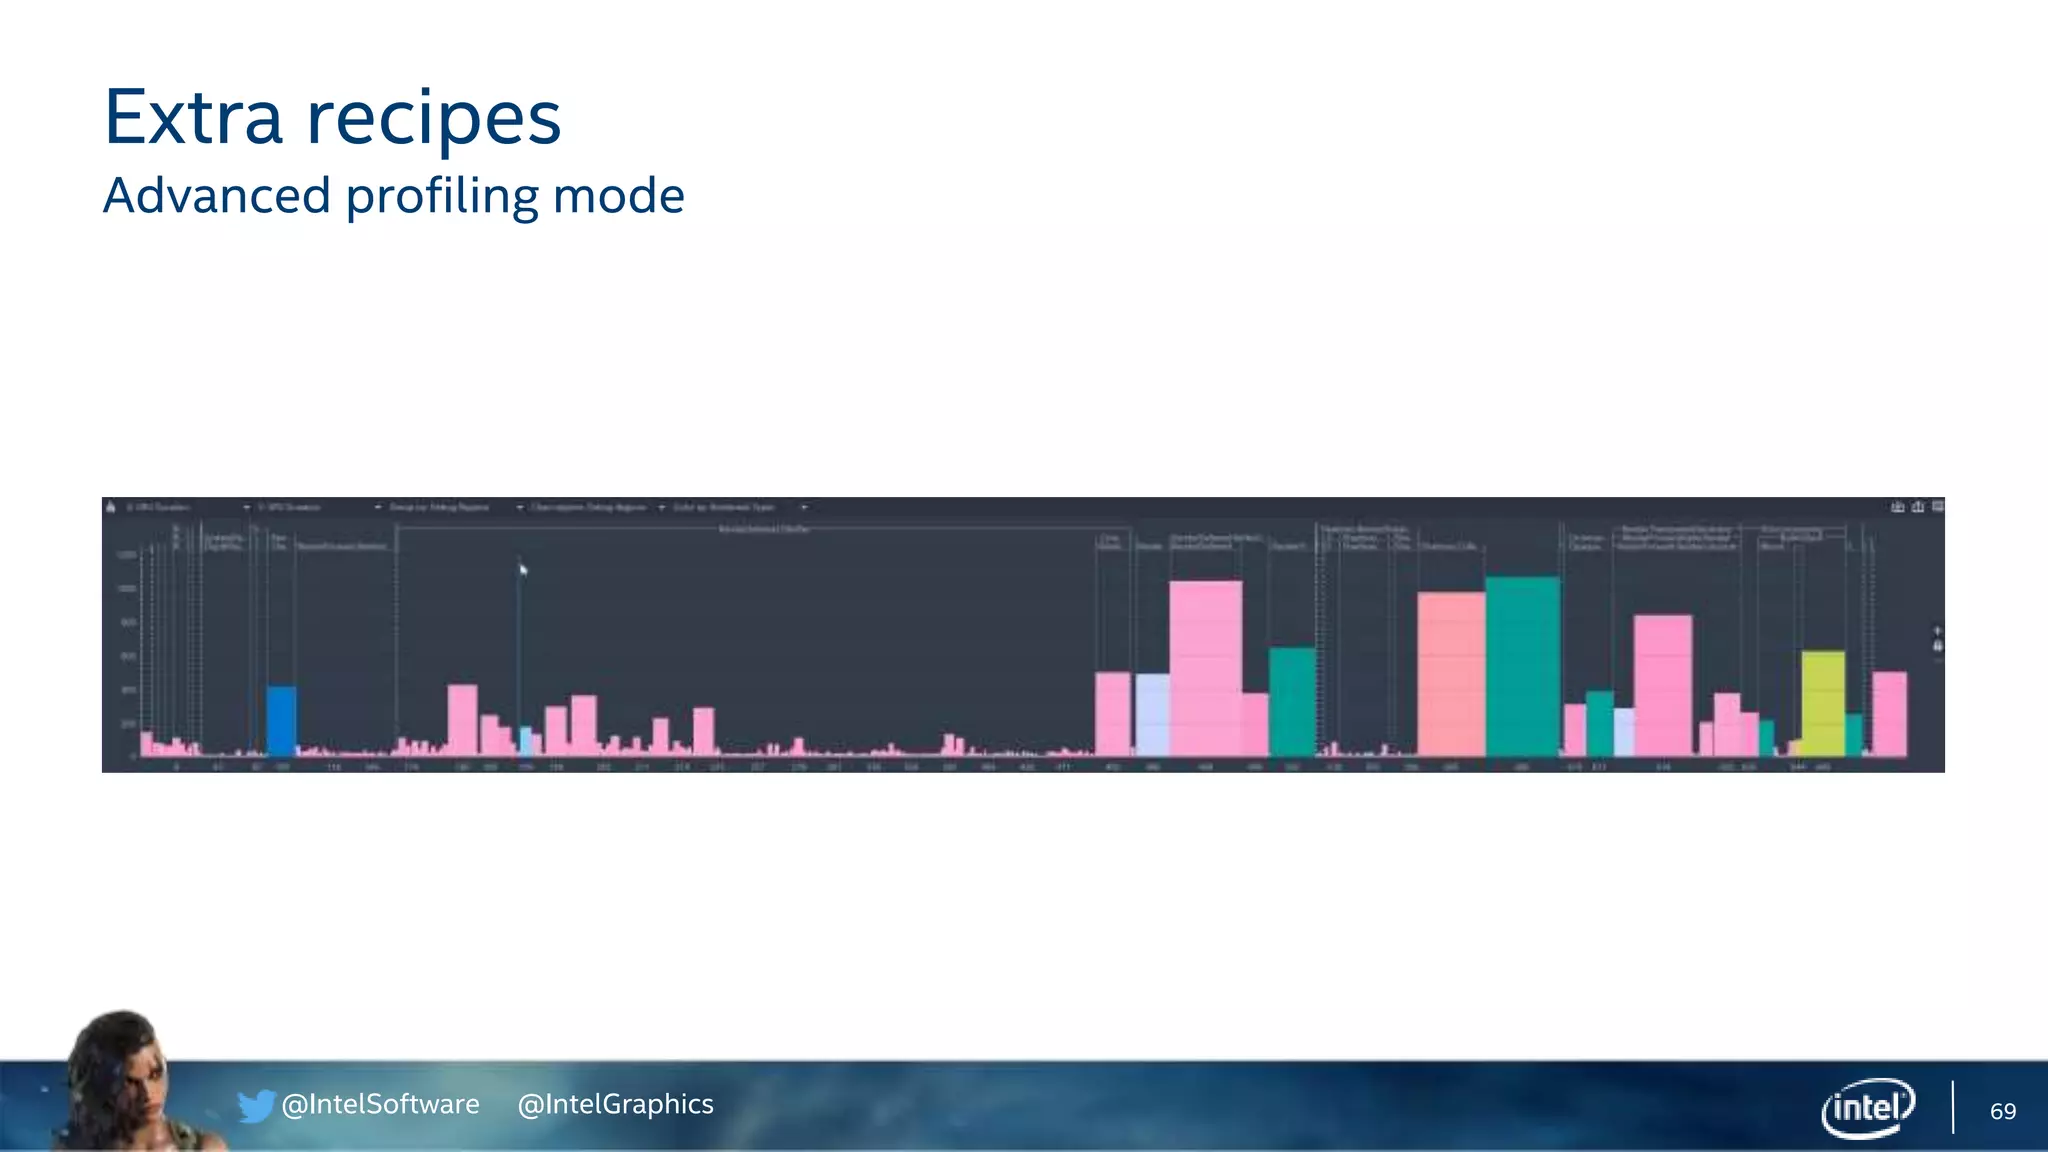
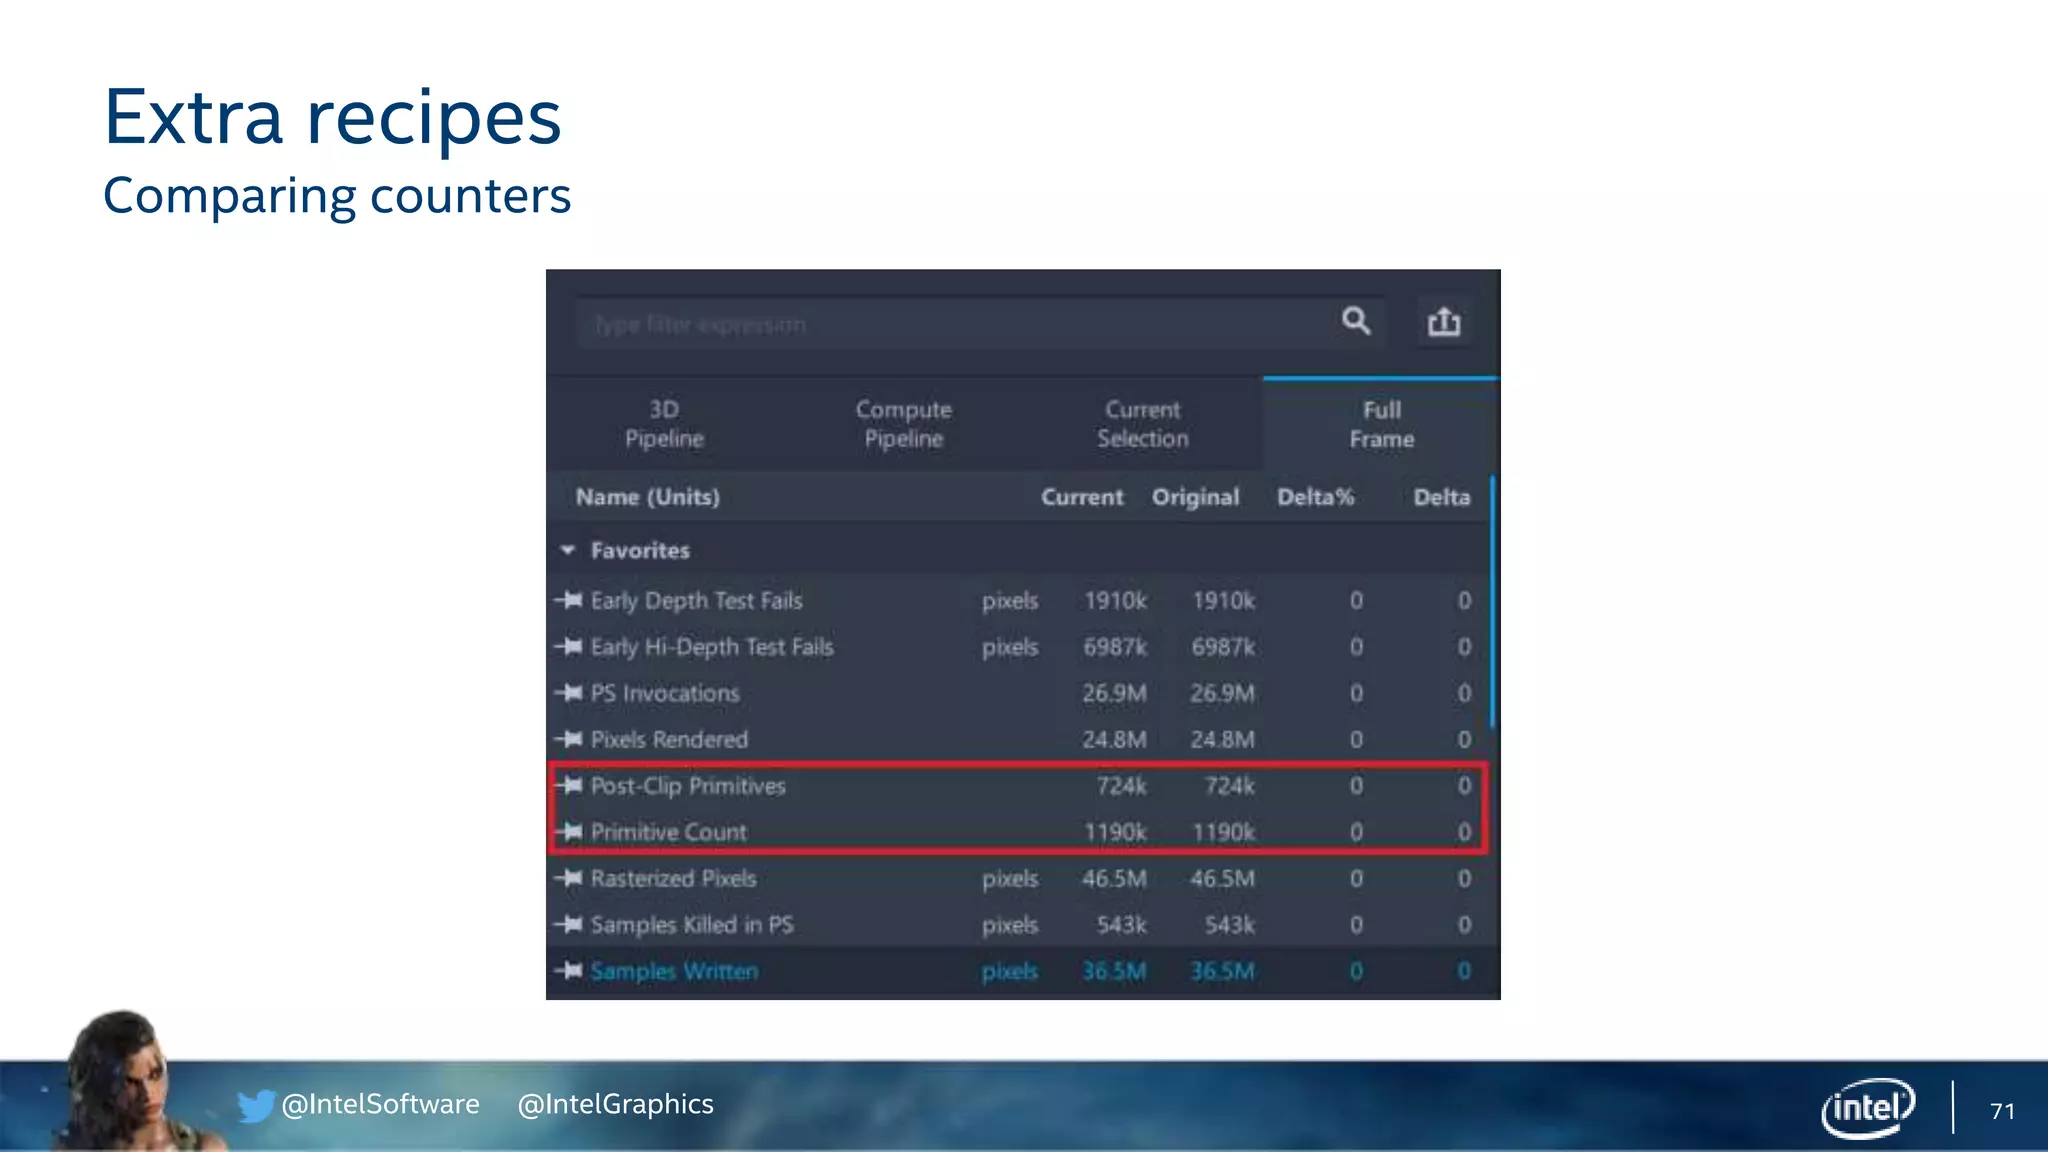
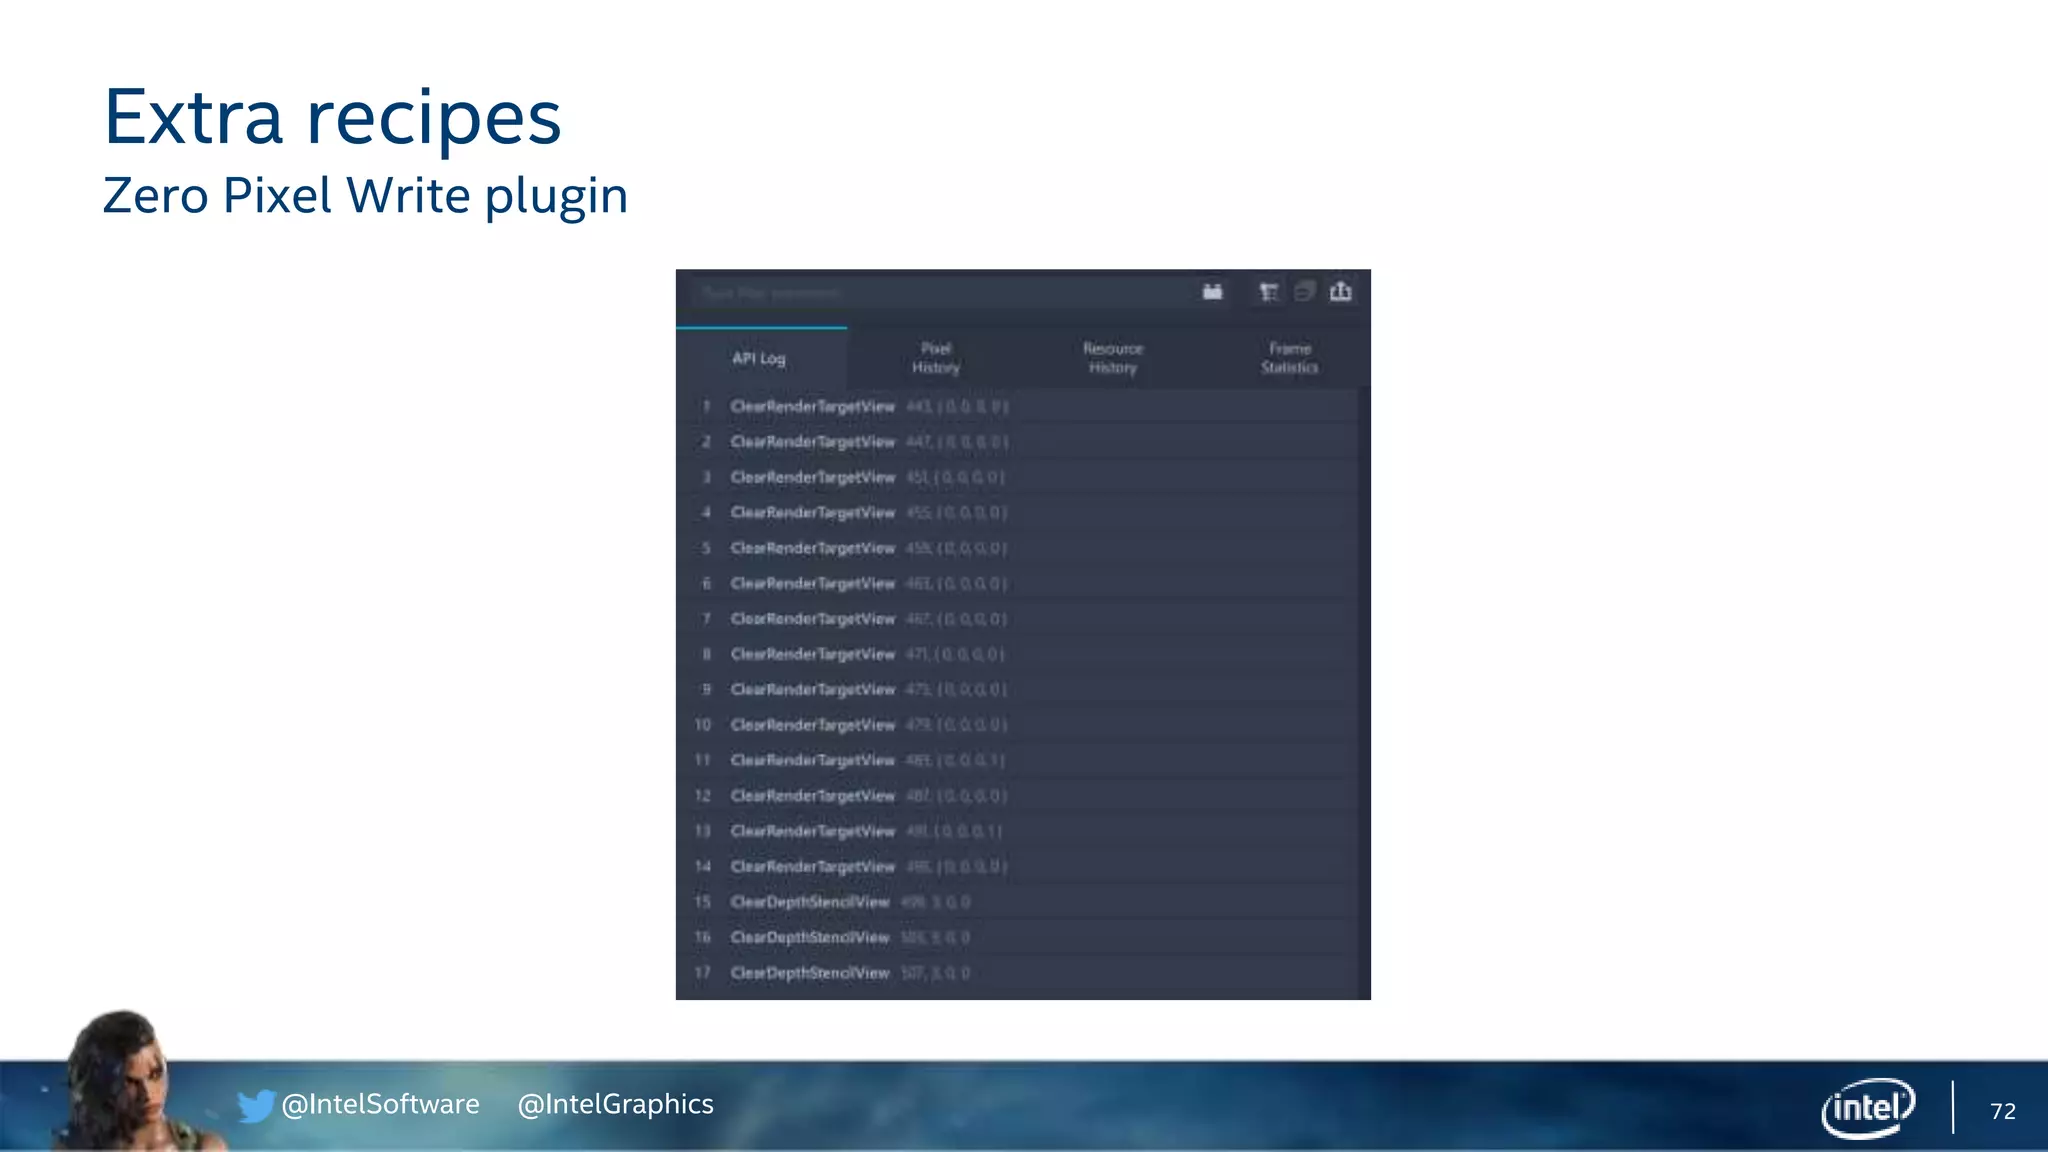
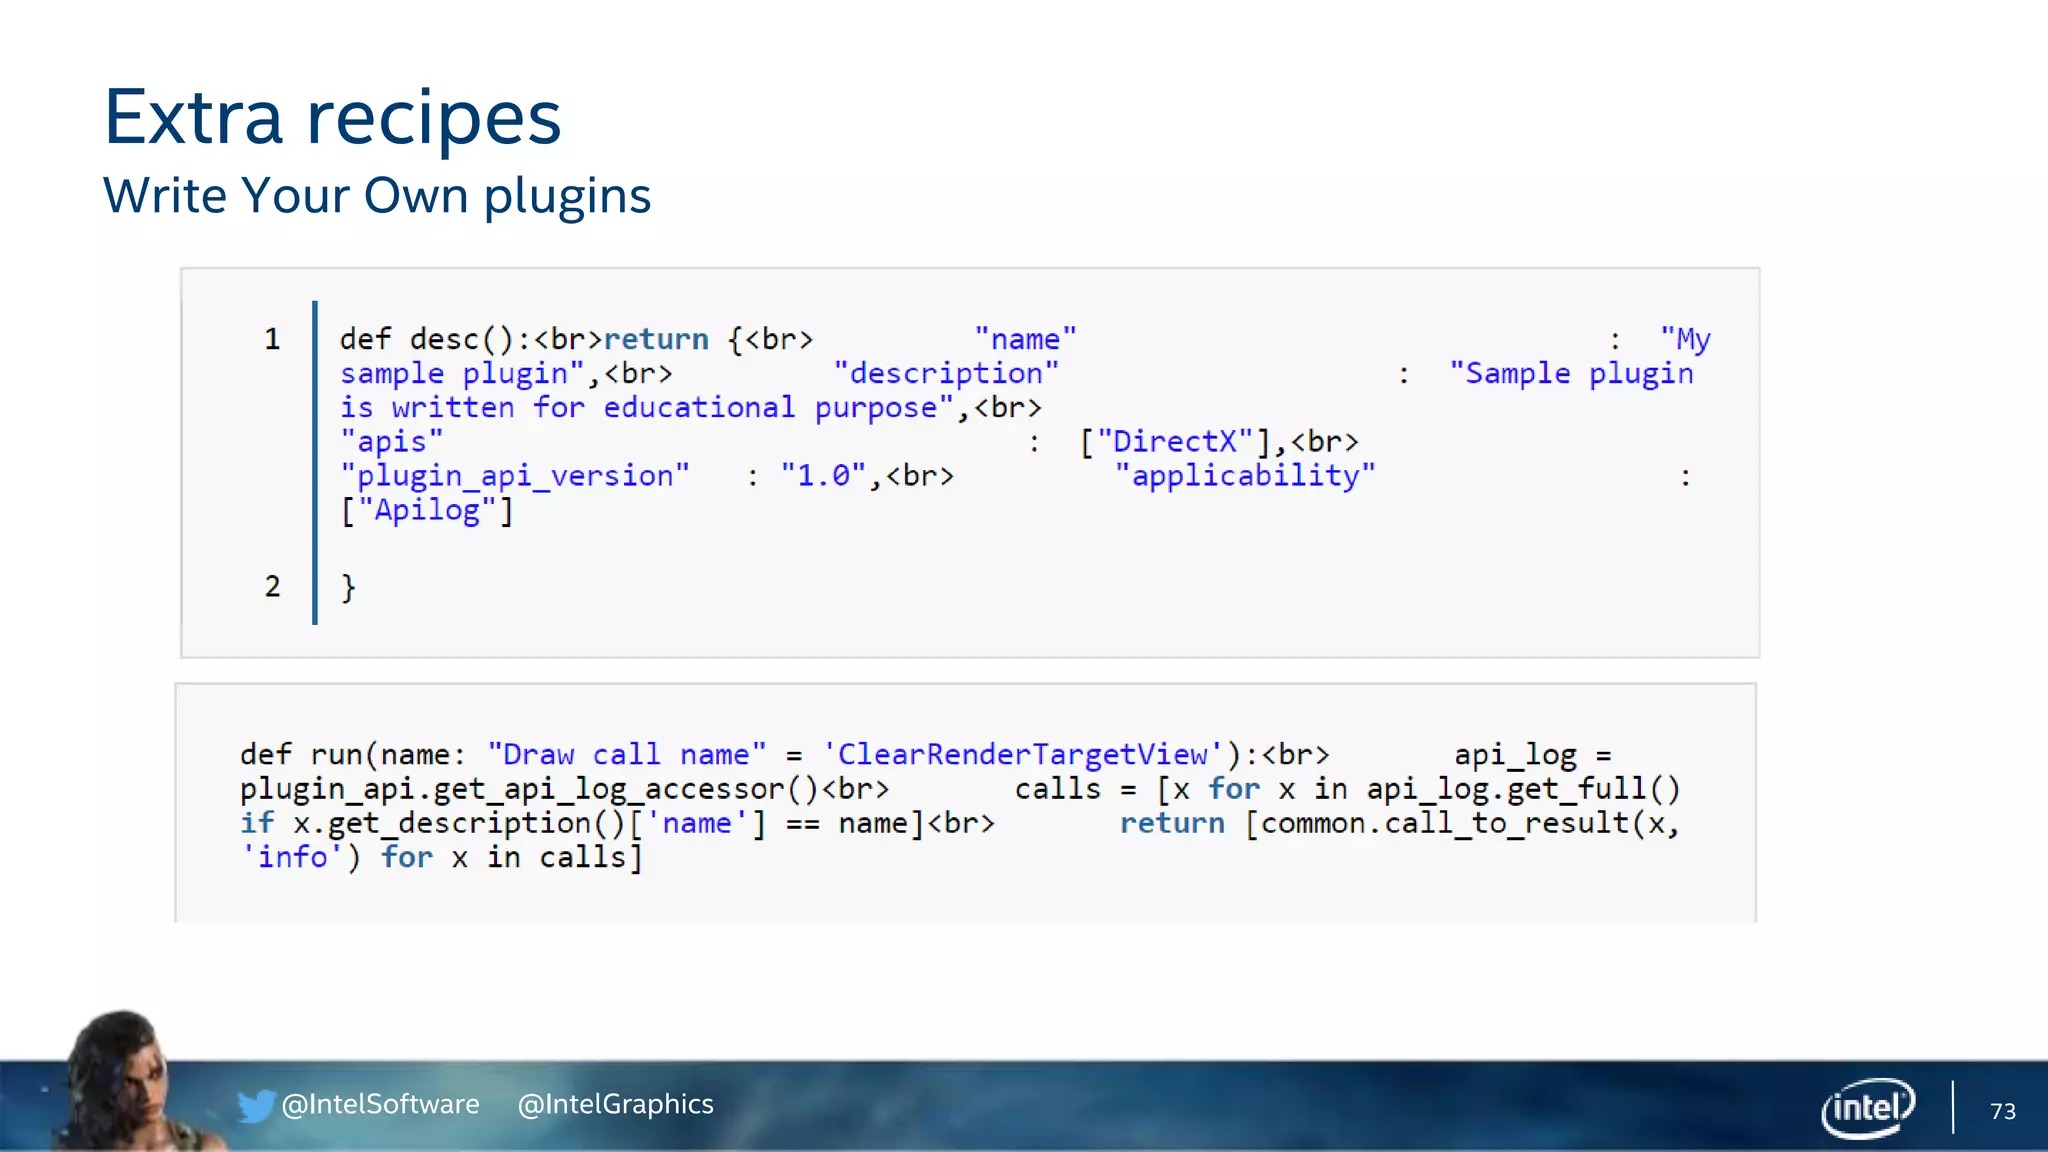
Additional techniques for performance analysis including frame capture, stream capture, and creating custom plugins.
Summarizes key points on scaling graphics performance, responsibilities, and invites questions from the audience.


![[BDD 2025 - Mobile Development] Crafting Immersive UI with E2E and AGSL Shade...](https://cdn.slidesharecdn.com/ss_thumbnails/md-craftingimmersiveuiwithe2eandagslshaderveronicaputrianggraini-251124030840-0c677f44-thumbnail.jpg?width=640&height=640&fit=bounds)


![[BDD 2025 - Full-Stack Development] The Modern Stack: Building Web & AI Appli...](https://cdn.slidesharecdn.com/ss_thumbnails/fs-themodernstackbuildingwebaiapplicationswithserverless-251124030844-388cf04f-thumbnail.jpg?width=640&height=640&fit=bounds)

![[BDD 2025 - Artificial Intelligence] AI for the Underdogs: Innovation for Sma...](https://cdn.slidesharecdn.com/ss_thumbnails/ai-aifortheunderdogsinnovationforsmallbusinesses-251124030839-72a599a4-thumbnail.jpg?width=640&height=640&fit=bounds)


![Support, Monitoring, Continuous Improvement & Scaling Agentic Automation [3/3]](https://cdn.slidesharecdn.com/ss_thumbnails/agenticcommunityseries-day3-cfd-251120170304-ddef8112-thumbnail.jpg?width=640&height=640&fit=bounds)


