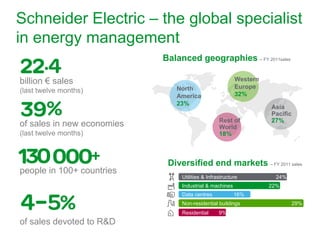
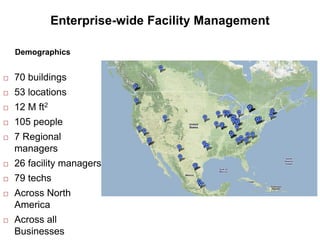
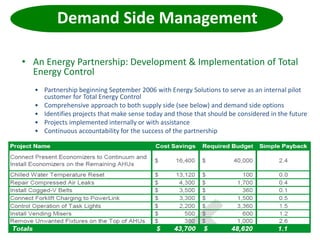
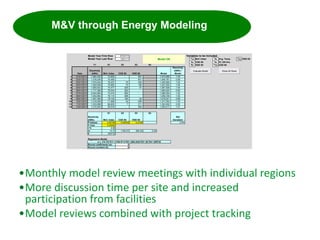
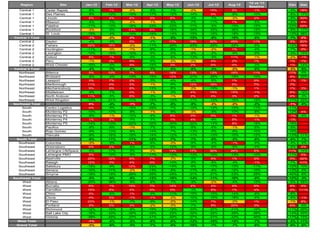
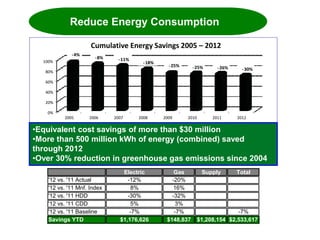
ISO 50001
Schneider
Electric
Agenda
About Schneider Electric & Dennis Edwards
Why Schneider Electric? Why ISO 50001
The pilot
Where to begin
Resource Requirements
Surprises
Is this right for you
The future for ISO50001 at Schneider Electric
Schneider Electric – the global specialist
in energy management
billion € sales
(last twelve months)
of sales in new economies
(last twelve months)
people in 100+ countries
of sales devoted to R&D
Residential 9%
Utilities & Infrastructure 24%
Industrial & machines 22%
Data centres 16%
Non-residential buildings 29%
Balanced geographies – FY 2011sales
Diversified end markets – FY 2011 sales
North
America
23%
Asia
Pacific
27%Rest of
World
18%
Western
Europe
32%
4
 70 buildings
 53 locations
 12 M ft2
 105 people
 7 Regional
managers
 26 facility managers
 79 techs
 Across North
America
 Across all
Businesses
Demographics
Enterprise-wide Facility Management
Our Key Principles
5 Year Capital
5 Year Expense
Critical Equipment List
Contingency Plans
Provide 24-7-365 Operation
Structured Approach Standardization
Process and Formats
Budget Planning
Facility Planning
Customer Focus- Meet Business Needs Survey to Measure
Results
Key Objectives
Reduce Energy Consumption
4% 2012 - 10% 2014
Execute Established Budget for 2012
+/- 2% of Forecast
Drive Internal Business
Customer Expectations
Eliminate Schneider
Electric Product Gaps
Aim to Exceed
Best Practice Manual
• A Standard Practice Manual was published
in 2009 as the guiding document for
energy management for Schneider Electric
in North America. It was adopted in 2010
as the Global guide to energy
management.
• The manual includes:
– a detailed description of the SE
Energy Program
– a listing of best practices pertaining to
several topics, such as HVAC, steam
systems, compressed air, chilled
water, and process heating
– includes preventive maintenance and
continuous commissioning items to
help sustain gains in energy efficient
building operation
• Remote monitoring tools and metering
• They allow me to move from energy data to energy information
Remote Monitoring
Energy Operation
Energy Management Information System (EMIS)
• Supply Side Partnership with Summit Energy
• Summit is a global leader in supply side energy services
• Provide competitive Energy Procurement, with anticipated savings of $1.2 M in 2012
• Utilize the Summit Resource Advisor to aggregate, check and view energy usage and progress on
supply side projects
Supply Side Management
Resource Advisor
• An Energy Partnership: Development & Implementation of Total
Energy Control
• Partnership beginning September 2006 with Energy Solutions to serve as an internal pilot
customer for Total Energy Control
• Comprehensive approach to both supply side (see below) and demand side options
• Identifies projects that make sense today and those that should be considered in the future
• Projects implemented internally or with assistance
• Continuous accountability for the success of the partnership
Demand Side Management
•Monthly model review meetings with individual regions
•More discussion time per site and increased
participation from facilities
•Model reviews combined with project tracking
EnPI Tool v3.02 SE r6, © 2011 Georgia Tech Research Corporation
01/01/11
12/01/11 Yes Mnf. Index No Avg. Temp. Yes HDD 60
No CDD 55 No PL ON Hrs. No
Y1 X1 X2 X3 X4 No HDD 55 Yes CDD 60
Date
Electricity
(kWh) Mnf. Index CDD 60 HDD 60 Model
Electricity
(kWh) /
Model
1 01/01/2011 1,565,436 73,650 - 981 1,572,990 1.00
2 02/01/2011 1,476,039 74,465 - 601 1,484,781 0.99
3 03/01/2011 1,575,044 79,427 19 455 1,540,800 1.02
4 04/01/2011 1,483,938 72,840 74 126 1,421,002 1.04
5 05/01/2011 1,655,833 74,477 205 87 1,587,929 1.04
6 06/01/2011 1,717,368 76,524 382 - 1,800,620 0.95
7 07/01/2011 2,024,995 73,410 580 - 1,985,054 1.02
8 08/01/2011 1,934,884 79,110 466 - 1,936,339 1.00
9 09/01/2011 1,557,469 79,103 184 25 1,615,021 0.96
10 10/01/2011 1,418,059 71,568 34 206 1,377,004 1.03
11 11/01/2011 1,203,898 66,825 7 311 1,303,550 0.92
12 12/01/2011 1,215,545 55,518 - 592 1,203,417 1.01
X1 X2 X3 X4
Electricity
(kWh) Mnf. Index CDD 60 HDD 60
Std
Deviation
P-Values 0.00185 0.00003 0.0169 3.9%
F-Test 0.00002
r^2 0.95
m 14.72 1162.51 264.24 0.00
b 229732
Round coefficients (m) 3
Round constant (b) 0
Variables to be Included
Regression Model
y = (14.72)*X1+ (1162.511)*X2+ (264.244)*X3+ (0)*X4+ 229732
Model Year Last Row
Model Year First Row
Model OK
Evaluate Model Show All Rows
Reduce Energy ConsumptionM&V through Energy Modeling
Region Site Jan-12 Feb-12 Mar-12 Apr-12 May-12 Jun-12 Jul-12 Aug-12
'12 vs '11
Baseline
Elec Gas
Central 1 Cedar Rapids -6% 1% -2% -5% -7% -2% 15% 2% -1% -4% 18%
Central 1 Des Plaines -6% -12% -15% -17% -12% -14% 0% -9% -10% -8% -17%
Central 1 Lincoln 9% 4% 8% 3% 6% -4% -7% -3% 2% -5% 30%
Central 1 Missouri -4% -7% -2% -1% -5% -7% -11% 1% -5% -5% 0%
Central 1 Palatine -11% -13% -16% -23% -23% -17% -5% -15% -15% -23% 22%
Central 1 Rockford -2% -5% 13% 6% -16% -34% -33% -36% -12% -9% -17%
Central 1 St. Louis -15% -4% -15% -19% -14% -15% -10% -18% -13% -13% -38%
Central 1 Total -1% -2% 3% -1% -5% -12% -9% -10% -5% -7% 4%
Central 2 Dayton -4% -4% 5% -4% 17% 19% 50% 45% 11% 3% 20%
Central 2 Fishers 22% 18% -2% -11% -20% -23% -23% -22% -5% -12% 16%
Central 2 Huntington -11% -3% -1% -6% -8% -1% -2% 1% -4% -7% 0%
Central 2 Lexington -10% -15% -10% -9% -5% -9% -5% -9% -9% -3% -15%
Central 2 Oxford 9% 1% -6% -3% -6% -13% -9% 11% -1% -2% -1%
Central 2 Peru -1% 2% 9% -5% -2% -2% 4% 2% 1% 1% 1%
Central 2 West Chester -10% -4% 9% -18% 3% 2% 0% 0% -3% 1% -14%
Central 2 Total -4% -7% -5% -7% -5% -8% -3% -2% -5% -3% -8%
Northeast Billerica 5% 10% 7% 9% 18% 13% 13% 16% 11% 17% -6%
Northeast Brossard -8% -4% -13% -15% 12% -21% -25% -19% -10% 8% -20%
Northeast Leesport 3% 7% 2% -3% -4% -4% -5% 1% 0% -1% 1%
Northeast Marlborough 11% 9% 5% -1% -6% 12% 18% 6% 7% 7%
Northeast Mechanicsburg 9% 8% 8% -13% -6% -2% -10% -1% 1% 1% 3%
Northeast Middletown -9% -7% 0% -1% -3% 4% 15% 15% -1% 8% -19%
Northeast North Andover 11% -5% 6% -3% -1% 2% 4% 3% 2% 4% -3%
Northeast West Kingston -13% -21% -11% -15% -13% -17% -13% -15% -15% -11% -25%
Northeast Total 0% -4% -1% -7% -5% -5% -3% -2% -3% -1% -8%
South Centro Logistico 0% -9% -15% -29% -7% -10% -12% -10% -11% -11%
South Monterrey P2 -10% -17% -8% -1% -9% -3% -4% -10% -8% -12% 4%
South Monterrey P3 -8% -1% -12% -8% 6% 3% 4% 1% -1% -1% -8%
South Monterrey P4 1% 2% -7% -7% 1% 4% -9% 8% -1% -1%
South Monterrey P5 -14% -13% -22% -32% -30% -22% -14% 8% -18% -18%
South Pacifico -6% -6% -1% -7% -8% -5% -6% -1% -5% -5%
South Rojo Gomez -9% -13% -8% -14% -7% -13% -5% -8% -10% -10%
South Tlaxcala -9% -16% -15% -14% -12% -11% -13% -10% -12% -13% -11%
South Total -8% -11% -11% -12% -7% -7% -6% -3% -8% -8% -7%
Southeast Columbia -3% -5% 1% -8% -3% -9% -4% -1% -4% -4% -4%
Southeast Greensboro 6% 2% -5% -6% -12% -9% -6% -5% -4% -5% 2%
Southeast LaVergne LifeSpace -5% -17% -5% -2% 14% 17% 30% 24% 5% 11% -14%
Southeast LaVergne PMO 5% -10% -8% -17% -12% -13% -10% -13% -10% -11% 5%
Southeast Nashville 20% 12% 6% 7% -2% -5% 4% 1% 5% 0% 42%
Southeast Raleigh 12% 3% 4% 0% -10% -8% -8% -4% -1% -7% 41%
Southeast Salisbury -15% -9% 12% -23% -14% -6% -17% -13% -11% -12% -10%
Southeast Seneca -10% -11% -2% -13% -8% -11% -8% -12% -10% -13% -5%
Southeast Smyrna -18% -19% -29% -25% -24% -31% -31% -23% -25% -40% -8%
Southeast Total -5% -9% -6% -12% -10% -14% -11% -10% -9% -12% -3%
West Athens -20% -36% -9% -6% -7% -3% -2% -4% -12% -5% -55%
West Burnaby 6% 1% 15% 7% 12% 4% 2% 5% 6% 8% 5%
West Carrollton 15% 8% 4% 0% 0% -3% 6% 1% 4% 2% 111%
West Chino 0% -6% 1% -9% -11% -15% -10% -14% -8% -8%
West Clovis 4% 5% -1% -1% -2% -10% -10% -18% -4% -6% -1%
West El Paso 23% -1% -7% -9% -2% -14% 7% -2% 1% -1% 8%
West Portland 3% 0% 3% -2% -3% -7% 9% 20% 3% 6% -6%
West Richmond -12% -10% -8% -10% -19% -33% -37% -41% -16% -11% -20%
West Salt Lake City -16% -33% -32% -33% -23% -32% -22% -25% -26% -14% -40%
West Victoria -39% -40% -37% -41% -40% -37% -41% -43% -40% -17% -75%
West Total -1% -4% -3% -6% -6% -12% -10% -14% -7% -5% -11%
Grand Total -3% -6% -3% -7% -6% -10% -7% -7% -6% -6% -6%
Reduce Energy Consumption
0%
20%
40%
60%
80%
100%
2005 2006 2007 2008 2009 2010 2011 2012
Cumulative Energy Savings 2005 – 2012
-4%
-8% -11%
-18%
-25% -25% -26% -30%
Reduce Energy Consumption
•Equivalent cost savings of more than $30 million
•More than 500 million kWh of energy (combined) saved
through 2012
•Over 30% reduction in greenhouse gas emissions since 2004
Electric Gas Supply Total
'12 vs. '11 Actual -12% -20%
'12 vs. '11 Mnf. Index 8% 16%
'12 vs. '11 HDD -30% -32%
'12 vs. '11 CDD 5% 3%
'12 vs. '11 Baseline -7% -7% -7%
Savings YTD $1,176,626 $148,837 $1,208,154 $2,533,617
• ISO 50001 is intended to
Improve Energy Performance
through activities like:
– Creation and achievement of
energy performance goals
– Tracking key performance
indicators
• ISO 50001 officially launched in
June of 2011 with Schneider
Electric’s World Headquarters
“The Hive” as the first certified
site, globally.
Why ISO 50001?
– Continuous Improvement
– Usage Tracking
– Energy Review
– Recommendations for
Improvement
– Action Plans for Improvement
– Periodic Maintenance
– Documentation of Operational
Procedures
– Communication Protocol
– Training Program
ISO 50001 Main Requirements
– Sets up a robust management and documentation system
that can be highly leveraged for other benefits
– Requires a detailed study of significant energy consumers
• Uncovers far more than a traditional energy audit
• Encourages process experts to reevaluate process in
detail
• Guides the energy expert (i.e. SE) and process experts
to reach optimal process parameters
– Reinforces corporate brand as one that is sustainable and
environmentally responsible
ISO 50001 Benefits
• Jump Ahead of Competitors
• Realizing Deeper Energy Savings
Benefits of ISO 50001!
• We have a world class energy management
system.
• We have a comprehensive Best Practice Manual.
• We are already down 30% on energy
consumptions.
There was some skepticism
• US DOE Pilot Program for SEP and ISO 50001
• ISO 50001 Certified EnMS
Smyrna, TN Plant
• We found more savings where we had already
looked before
• Employee engagement went up
• Increase awareness of the ‘energy action” story
Surprise!
• Paintline Results (SEU)
– IR ovens only required 25% of their current used
capacity
– Hook burn-off temperature set to 1,500 degrees
when 1,200 degrees would suffice
• Other Benefits
– Drying ovens were being left on at night
– New HVAC units were not commissioned properly
– Procurement specifications did not require high
efficient equipment
Smyrna, TN Plant
Smyrna, TN Plant
Smyrna Electricity Use
2004-2012
(improvement compared to 2004)
3,000,000
4,000,000
5,000,000
6,000,000
7,000,000
8,000,000
2004 2005 2006 2007 2008 2009 2010 2011 2012
Year
KWH
0%
10%
20%
30%
40%
50%
60%
%Improvement
Kwh % Change
PROCESS
OVERVIEW
Site selection?
Other factors:
Nature of the business at that location
Resource allocations
Current site objectives
GSC North America Top Energy Consumers
-
5,000,000
10,000,000
15,000,000
20,000,000
25,000,000
30,000,000
35,000,000
40,000,000
Lexington
Lincoln
Clovis
Seneca
Rockford
Peru
O
xford
Colum
biaCedarRapids
Leesport
North
Andover
Tlaxcala
St.Louis
SETC
W
estKingston
Sm
yrna
Facility
KWH
Equivilant KWH
We chose to select sites based on energy consumption!
• Divided into 5 phases
– Gap Analysis
– Facility Energy Review
– EnMS Construction
– Readiness Review and Internal Audit
– ISO Certification Preparation
Schneider Electric’s Process
• Identify how current practices meet the
standard
• Determine which current practices can be
adopted to meet the standard
• Develop an implementation plan
– Determine Phase 3 required effort
Phase 1 – Gap Analysis
• Conduct utilities analysis
• Identify Significant Energy Users (SEUs)
• For each SEU
– Develop Energy Conservation Measures
– Create metering plan
– Identify operating parameters
Phase 2 – Energy Review
• Phase 3 – EnMS Construction
– Build procedures for a fully functional system
– Ensure energy efficiency targets have a plan for
achievement
• Phase 4 – Readiness Review and Internal
Audit
• Phase 5 – ISO Certification Preparation
Phases 3, 4, 5
• Initial Investment
– Dedication of internal resources
to enable and maintain
– Investment for certification
• Difficult to Communicate
Value
– Not mandated
– Too new to show case studies for
savings
Challenges
• Leaders are the Facility Managers
• Cross functional teams, all internal resources
• Approximately 5 on a team, FM, MGMT Sys
expert, Environmental Manager, Production
Representative, Plant Manager
• About 800 hrs resource cost per location
• Audits were $30k
• It takes 6 to 9 months
Resources
• Is the bottom line important
• Are other management systems in place
• Is energy management important beyond cost
for instance “environmental impact”
• Is your customer base “environmentally aware”
Is this right for you?
• Include Superior Energy Performance
• Certify 9 more locations in North America by end
of 2014
Where do we go now?
Questions
Comments

Implementing iso 50001

  • 1.
  • 2.
    Agenda About Schneider Electric& Dennis Edwards Why Schneider Electric? Why ISO 50001 The pilot Where to begin Resource Requirements Surprises Is this right for you The future for ISO50001 at Schneider Electric
  • 3.
    Schneider Electric –the global specialist in energy management billion € sales (last twelve months) of sales in new economies (last twelve months) people in 100+ countries of sales devoted to R&D Residential 9% Utilities & Infrastructure 24% Industrial & machines 22% Data centres 16% Non-residential buildings 29% Balanced geographies – FY 2011sales Diversified end markets – FY 2011 sales North America 23% Asia Pacific 27%Rest of World 18% Western Europe 32%
  • 4.
    4  70 buildings 53 locations  12 M ft2  105 people  7 Regional managers  26 facility managers  79 techs  Across North America  Across all Businesses Demographics Enterprise-wide Facility Management
  • 5.
    Our Key Principles 5Year Capital 5 Year Expense Critical Equipment List Contingency Plans Provide 24-7-365 Operation Structured Approach Standardization Process and Formats Budget Planning Facility Planning Customer Focus- Meet Business Needs Survey to Measure Results
  • 6.
    Key Objectives Reduce EnergyConsumption 4% 2012 - 10% 2014 Execute Established Budget for 2012 +/- 2% of Forecast Drive Internal Business Customer Expectations Eliminate Schneider Electric Product Gaps Aim to Exceed
  • 7.
    Best Practice Manual •A Standard Practice Manual was published in 2009 as the guiding document for energy management for Schneider Electric in North America. It was adopted in 2010 as the Global guide to energy management. • The manual includes: – a detailed description of the SE Energy Program – a listing of best practices pertaining to several topics, such as HVAC, steam systems, compressed air, chilled water, and process heating – includes preventive maintenance and continuous commissioning items to help sustain gains in energy efficient building operation
  • 8.
    • Remote monitoringtools and metering • They allow me to move from energy data to energy information Remote Monitoring Energy Operation Energy Management Information System (EMIS)
  • 9.
    • Supply SidePartnership with Summit Energy • Summit is a global leader in supply side energy services • Provide competitive Energy Procurement, with anticipated savings of $1.2 M in 2012 • Utilize the Summit Resource Advisor to aggregate, check and view energy usage and progress on supply side projects Supply Side Management Resource Advisor
  • 10.
    • An EnergyPartnership: Development & Implementation of Total Energy Control • Partnership beginning September 2006 with Energy Solutions to serve as an internal pilot customer for Total Energy Control • Comprehensive approach to both supply side (see below) and demand side options • Identifies projects that make sense today and those that should be considered in the future • Projects implemented internally or with assistance • Continuous accountability for the success of the partnership Demand Side Management
  • 11.
    •Monthly model reviewmeetings with individual regions •More discussion time per site and increased participation from facilities •Model reviews combined with project tracking EnPI Tool v3.02 SE r6, © 2011 Georgia Tech Research Corporation 01/01/11 12/01/11 Yes Mnf. Index No Avg. Temp. Yes HDD 60 No CDD 55 No PL ON Hrs. No Y1 X1 X2 X3 X4 No HDD 55 Yes CDD 60 Date Electricity (kWh) Mnf. Index CDD 60 HDD 60 Model Electricity (kWh) / Model 1 01/01/2011 1,565,436 73,650 - 981 1,572,990 1.00 2 02/01/2011 1,476,039 74,465 - 601 1,484,781 0.99 3 03/01/2011 1,575,044 79,427 19 455 1,540,800 1.02 4 04/01/2011 1,483,938 72,840 74 126 1,421,002 1.04 5 05/01/2011 1,655,833 74,477 205 87 1,587,929 1.04 6 06/01/2011 1,717,368 76,524 382 - 1,800,620 0.95 7 07/01/2011 2,024,995 73,410 580 - 1,985,054 1.02 8 08/01/2011 1,934,884 79,110 466 - 1,936,339 1.00 9 09/01/2011 1,557,469 79,103 184 25 1,615,021 0.96 10 10/01/2011 1,418,059 71,568 34 206 1,377,004 1.03 11 11/01/2011 1,203,898 66,825 7 311 1,303,550 0.92 12 12/01/2011 1,215,545 55,518 - 592 1,203,417 1.01 X1 X2 X3 X4 Electricity (kWh) Mnf. Index CDD 60 HDD 60 Std Deviation P-Values 0.00185 0.00003 0.0169 3.9% F-Test 0.00002 r^2 0.95 m 14.72 1162.51 264.24 0.00 b 229732 Round coefficients (m) 3 Round constant (b) 0 Variables to be Included Regression Model y = (14.72)*X1+ (1162.511)*X2+ (264.244)*X3+ (0)*X4+ 229732 Model Year Last Row Model Year First Row Model OK Evaluate Model Show All Rows Reduce Energy ConsumptionM&V through Energy Modeling
  • 12.
    Region Site Jan-12Feb-12 Mar-12 Apr-12 May-12 Jun-12 Jul-12 Aug-12 '12 vs '11 Baseline Elec Gas Central 1 Cedar Rapids -6% 1% -2% -5% -7% -2% 15% 2% -1% -4% 18% Central 1 Des Plaines -6% -12% -15% -17% -12% -14% 0% -9% -10% -8% -17% Central 1 Lincoln 9% 4% 8% 3% 6% -4% -7% -3% 2% -5% 30% Central 1 Missouri -4% -7% -2% -1% -5% -7% -11% 1% -5% -5% 0% Central 1 Palatine -11% -13% -16% -23% -23% -17% -5% -15% -15% -23% 22% Central 1 Rockford -2% -5% 13% 6% -16% -34% -33% -36% -12% -9% -17% Central 1 St. Louis -15% -4% -15% -19% -14% -15% -10% -18% -13% -13% -38% Central 1 Total -1% -2% 3% -1% -5% -12% -9% -10% -5% -7% 4% Central 2 Dayton -4% -4% 5% -4% 17% 19% 50% 45% 11% 3% 20% Central 2 Fishers 22% 18% -2% -11% -20% -23% -23% -22% -5% -12% 16% Central 2 Huntington -11% -3% -1% -6% -8% -1% -2% 1% -4% -7% 0% Central 2 Lexington -10% -15% -10% -9% -5% -9% -5% -9% -9% -3% -15% Central 2 Oxford 9% 1% -6% -3% -6% -13% -9% 11% -1% -2% -1% Central 2 Peru -1% 2% 9% -5% -2% -2% 4% 2% 1% 1% 1% Central 2 West Chester -10% -4% 9% -18% 3% 2% 0% 0% -3% 1% -14% Central 2 Total -4% -7% -5% -7% -5% -8% -3% -2% -5% -3% -8% Northeast Billerica 5% 10% 7% 9% 18% 13% 13% 16% 11% 17% -6% Northeast Brossard -8% -4% -13% -15% 12% -21% -25% -19% -10% 8% -20% Northeast Leesport 3% 7% 2% -3% -4% -4% -5% 1% 0% -1% 1% Northeast Marlborough 11% 9% 5% -1% -6% 12% 18% 6% 7% 7% Northeast Mechanicsburg 9% 8% 8% -13% -6% -2% -10% -1% 1% 1% 3% Northeast Middletown -9% -7% 0% -1% -3% 4% 15% 15% -1% 8% -19% Northeast North Andover 11% -5% 6% -3% -1% 2% 4% 3% 2% 4% -3% Northeast West Kingston -13% -21% -11% -15% -13% -17% -13% -15% -15% -11% -25% Northeast Total 0% -4% -1% -7% -5% -5% -3% -2% -3% -1% -8% South Centro Logistico 0% -9% -15% -29% -7% -10% -12% -10% -11% -11% South Monterrey P2 -10% -17% -8% -1% -9% -3% -4% -10% -8% -12% 4% South Monterrey P3 -8% -1% -12% -8% 6% 3% 4% 1% -1% -1% -8% South Monterrey P4 1% 2% -7% -7% 1% 4% -9% 8% -1% -1% South Monterrey P5 -14% -13% -22% -32% -30% -22% -14% 8% -18% -18% South Pacifico -6% -6% -1% -7% -8% -5% -6% -1% -5% -5% South Rojo Gomez -9% -13% -8% -14% -7% -13% -5% -8% -10% -10% South Tlaxcala -9% -16% -15% -14% -12% -11% -13% -10% -12% -13% -11% South Total -8% -11% -11% -12% -7% -7% -6% -3% -8% -8% -7% Southeast Columbia -3% -5% 1% -8% -3% -9% -4% -1% -4% -4% -4% Southeast Greensboro 6% 2% -5% -6% -12% -9% -6% -5% -4% -5% 2% Southeast LaVergne LifeSpace -5% -17% -5% -2% 14% 17% 30% 24% 5% 11% -14% Southeast LaVergne PMO 5% -10% -8% -17% -12% -13% -10% -13% -10% -11% 5% Southeast Nashville 20% 12% 6% 7% -2% -5% 4% 1% 5% 0% 42% Southeast Raleigh 12% 3% 4% 0% -10% -8% -8% -4% -1% -7% 41% Southeast Salisbury -15% -9% 12% -23% -14% -6% -17% -13% -11% -12% -10% Southeast Seneca -10% -11% -2% -13% -8% -11% -8% -12% -10% -13% -5% Southeast Smyrna -18% -19% -29% -25% -24% -31% -31% -23% -25% -40% -8% Southeast Total -5% -9% -6% -12% -10% -14% -11% -10% -9% -12% -3% West Athens -20% -36% -9% -6% -7% -3% -2% -4% -12% -5% -55% West Burnaby 6% 1% 15% 7% 12% 4% 2% 5% 6% 8% 5% West Carrollton 15% 8% 4% 0% 0% -3% 6% 1% 4% 2% 111% West Chino 0% -6% 1% -9% -11% -15% -10% -14% -8% -8% West Clovis 4% 5% -1% -1% -2% -10% -10% -18% -4% -6% -1% West El Paso 23% -1% -7% -9% -2% -14% 7% -2% 1% -1% 8% West Portland 3% 0% 3% -2% -3% -7% 9% 20% 3% 6% -6% West Richmond -12% -10% -8% -10% -19% -33% -37% -41% -16% -11% -20% West Salt Lake City -16% -33% -32% -33% -23% -32% -22% -25% -26% -14% -40% West Victoria -39% -40% -37% -41% -40% -37% -41% -43% -40% -17% -75% West Total -1% -4% -3% -6% -6% -12% -10% -14% -7% -5% -11% Grand Total -3% -6% -3% -7% -6% -10% -7% -7% -6% -6% -6%
  • 13.
    Reduce Energy Consumption 0% 20% 40% 60% 80% 100% 20052006 2007 2008 2009 2010 2011 2012 Cumulative Energy Savings 2005 – 2012 -4% -8% -11% -18% -25% -25% -26% -30% Reduce Energy Consumption •Equivalent cost savings of more than $30 million •More than 500 million kWh of energy (combined) saved through 2012 •Over 30% reduction in greenhouse gas emissions since 2004 Electric Gas Supply Total '12 vs. '11 Actual -12% -20% '12 vs. '11 Mnf. Index 8% 16% '12 vs. '11 HDD -30% -32% '12 vs. '11 CDD 5% 3% '12 vs. '11 Baseline -7% -7% -7% Savings YTD $1,176,626 $148,837 $1,208,154 $2,533,617
  • 14.
    • ISO 50001is intended to Improve Energy Performance through activities like: – Creation and achievement of energy performance goals – Tracking key performance indicators • ISO 50001 officially launched in June of 2011 with Schneider Electric’s World Headquarters “The Hive” as the first certified site, globally. Why ISO 50001?
  • 15.
    – Continuous Improvement –Usage Tracking – Energy Review – Recommendations for Improvement – Action Plans for Improvement – Periodic Maintenance – Documentation of Operational Procedures – Communication Protocol – Training Program ISO 50001 Main Requirements
  • 16.
    – Sets upa robust management and documentation system that can be highly leveraged for other benefits – Requires a detailed study of significant energy consumers • Uncovers far more than a traditional energy audit • Encourages process experts to reevaluate process in detail • Guides the energy expert (i.e. SE) and process experts to reach optimal process parameters – Reinforces corporate brand as one that is sustainable and environmentally responsible ISO 50001 Benefits
  • 17.
    • Jump Aheadof Competitors • Realizing Deeper Energy Savings Benefits of ISO 50001!
  • 18.
    • We havea world class energy management system. • We have a comprehensive Best Practice Manual. • We are already down 30% on energy consumptions. There was some skepticism
  • 19.
    • US DOEPilot Program for SEP and ISO 50001 • ISO 50001 Certified EnMS Smyrna, TN Plant
  • 20.
    • We foundmore savings where we had already looked before • Employee engagement went up • Increase awareness of the ‘energy action” story Surprise!
  • 21.
    • Paintline Results(SEU) – IR ovens only required 25% of their current used capacity – Hook burn-off temperature set to 1,500 degrees when 1,200 degrees would suffice • Other Benefits – Drying ovens were being left on at night – New HVAC units were not commissioned properly – Procurement specifications did not require high efficient equipment Smyrna, TN Plant
  • 22.
    Smyrna, TN Plant SmyrnaElectricity Use 2004-2012 (improvement compared to 2004) 3,000,000 4,000,000 5,000,000 6,000,000 7,000,000 8,000,000 2004 2005 2006 2007 2008 2009 2010 2011 2012 Year KWH 0% 10% 20% 30% 40% 50% 60% %Improvement Kwh % Change
  • 23.
  • 24.
    Site selection? Other factors: Natureof the business at that location Resource allocations Current site objectives GSC North America Top Energy Consumers - 5,000,000 10,000,000 15,000,000 20,000,000 25,000,000 30,000,000 35,000,000 40,000,000 Lexington Lincoln Clovis Seneca Rockford Peru O xford Colum biaCedarRapids Leesport North Andover Tlaxcala St.Louis SETC W estKingston Sm yrna Facility KWH Equivilant KWH We chose to select sites based on energy consumption!
  • 25.
    • Divided into5 phases – Gap Analysis – Facility Energy Review – EnMS Construction – Readiness Review and Internal Audit – ISO Certification Preparation Schneider Electric’s Process
  • 26.
    • Identify howcurrent practices meet the standard • Determine which current practices can be adopted to meet the standard • Develop an implementation plan – Determine Phase 3 required effort Phase 1 – Gap Analysis
  • 27.
    • Conduct utilitiesanalysis • Identify Significant Energy Users (SEUs) • For each SEU – Develop Energy Conservation Measures – Create metering plan – Identify operating parameters Phase 2 – Energy Review
  • 28.
    • Phase 3– EnMS Construction – Build procedures for a fully functional system – Ensure energy efficiency targets have a plan for achievement • Phase 4 – Readiness Review and Internal Audit • Phase 5 – ISO Certification Preparation Phases 3, 4, 5
  • 29.
    • Initial Investment –Dedication of internal resources to enable and maintain – Investment for certification • Difficult to Communicate Value – Not mandated – Too new to show case studies for savings Challenges
  • 30.
    • Leaders arethe Facility Managers • Cross functional teams, all internal resources • Approximately 5 on a team, FM, MGMT Sys expert, Environmental Manager, Production Representative, Plant Manager • About 800 hrs resource cost per location • Audits were $30k • It takes 6 to 9 months Resources
  • 31.
    • Is thebottom line important • Are other management systems in place • Is energy management important beyond cost for instance “environmental impact” • Is your customer base “environmentally aware” Is this right for you?
  • 32.
    • Include SuperiorEnergy Performance • Certify 9 more locations in North America by end of 2014 Where do we go now?
  • 33.