
Recommended
Recommended
More Related Content
What's hot
What's hot (20)
Similar to impacto de mudanças climáticas
Similar to impacto de mudanças climáticas (20)
Recently uploaded
Recently uploaded (20)
impacto de mudanças climáticas
- 1. Global Ecology and Conservation 34 (2022) e02025 Available online 31 January 2022 2351-9894/© 2022 Published by Elsevier B.V. This is an open access article under the CC BY-NC-ND license (http://creativecommons.org/licenses/by-nc-nd/4.0/). Implications of climate change on the distribution and conservation of Cabo Verde endemic trees Danilson Varela a,b,c,d , Maria M. Romeiras a,e,* , Luís Silva b a Linking Landscape, Environment, Agriculture and Food (LEAF), Instituto Superior de Agronomia, Universidade de Lisboa, Tapada da Ajuda, 1349- 017 Lisboa, Portugal b Research Centre in Biodiversity and Genetic Resources – Azores (CIBIO-Açores), InBIO Associate Laboratory, Faculdade de Ciências e Tecnologia, Universidade dos Açores, Portugal c Nova School of Business and Economics, 2775-405 Campus de Carcavelos, Portugal d Centro de Estudos Africanos para Desenvolvimento e Inovação (CEADI), Ilha de Santiago, Assomada, Cabo Verde e Centre for Ecology, Evolution and Environmental Changes (cE3c), Faculdade de Ciências, Universidade de Lisboa, Lisboa, Portugal A R T I C L E I N F O Keywords: Tropical Islands Aridity Drought Climate Change Endemic trees Ecological modelling Protected areas Macaronesia A B S T R A C T Climate change is one of the most significant challenges to biodiversity conservation, particularly in dry tropical islands, such as the Cabo Verde archipelago where only three endemic tree taxa occur – Dracaena draco subsp. caboverdeana, Phoenix atlantica and Sideroxylon marginatum – all classified as threatened. The main goal of this study was to predict the possible shifts in the climatically suitable habitat ranges for Cabo Verdean endemic tree species under different climate change scenarios. We applied species distribution models (SDMs) to the available occurrence data, and projected the distribution of the three taxa for 2050 and 2080, according to the ex pected climate change scenarios. The best models were obtained using the Random Forest al gorithm; they showed that, by 2080, the suitable habitat for Dracaena draco subsp. caboverdeana and Sideroxylon marginatum will have decreased by 28% and 34%, respectively; conversely, the suitable habitat will have increased by 59% for Phoenix atlantica, the taxon best adapted to arid conditions. Additionally, Santo Antão is the island where endangered trees are more encompassed by protected areas. Overall, this study contributed with new integrated data to support the design and implementation of a strategic plan to promote the conservation and ecological value of Cabo Verde endemic trees in this climatically vulnerable country. 1. Introduction Air temperature and rainfall are key parameters to describe climate, which is one of the main elements used to define plant niches (Kaky and Gilbert, 2017). Significant changes in global temperature, precipitation, wind patterns, and other climate variables, increasingly affect plant species distributions (Ferrarini et al., 2019). Extreme variability in annual and seasonal temperature and precipitation patterns can disrupt a wide range of natural processes, particularly when changes occur more quickly than species adaptation (IPCC, 2018). Since the 19th century, growing emissions of carbon dioxide (CO2) and other greenhouse gases into the atmosphere originated * Correspondence to: Linking Landscape, Environment, Agriculture and Food (LEAF), Instituto Superior de Agronomia (ISA), Universidade de Lisboa, Tapada da Ajuda, 1349-017 Lisbon, Portugal. E-mail addresses: danilson.mascarenhas@novasbe.pt (D. Varela), mmromeiras@isa.ulisboa.pt (M.M. Romeiras), luis.fd.silva@uac.pt (L. Silva). Contents lists available at ScienceDirect Global Ecology and Conservation journal homepage: www.elsevier.com/locate/gecco https://doi.org/10.1016/j.gecco.2022.e02025 Received 13 October 2021; Received in revised form 17 January 2022; Accepted 18 January 2022
- 2. Global Ecology and Conservation 34 (2022) e02025 2 anthropogenic global warming, currently increasing at about 0.2 ◦ C per decade due to past and ongoing emissions (Yobom, 2020). Based on the current rate of increase, the Intergovernmental Panel on Climate Change (IPCC) estimated that global warming is likely to reach 1.5 ◦ C between 2030 and 2052 (IPCC, 2018). From 2016–2035, the average global temperature is expected to increase between 0.3 and 0.7 ◦ C (IPCC, 2018). By the end of the 21st century, a decrease in average rainfall is expected for most mid-latitude areas, and particularly for arid subtropical regions (IPCC, 2018; Yobom, 2020). Those changes can affect the hydrological cycle and water availability, increasing the risk of hydrological and agricultural drought as temperatures rise (IPCC, 2018). Concerns associated with the increase in global average temperature have stimulated research addressing the impacts of climate change on species distributions (e.g., Peterson et al., 2002; Araujo et al., 2005; Van Der Putten et al., 2010; Márquez et al., 2011; Chang et al., 2015; Kaky and Gilbert, 2017; Dutra Silva et al., 2017, 2019). For example, Chang et al. (2015) showed that changes in average annual temperature, pre cipitation, and other climate-related factors can affect plant growth rates, community stand structure and dynamics, and alter the geographic distribution of individual tree species and woodland types. The Macaronesian Region (i.e., Azores, Madeira, Selvagens, Canary Islands, and Cabo Verde) is an important transitional climatic zone in the north-eastern Atlantic Ocean, with a climatic gradient ranging from a temperate climate in the Azores to tropical dry or semi-desertic climates in the southernmost Cabo Verde Islands (Florencio et al., 2021). As a rule, across Macaronesia, temperature increases and precipitation decreases towards the equator, while precipitation increases with elevation, particularly in the north or northeast facing slopes above 400 m, due to the persistence of the prevailing trade winds (Neto et al., 2020). In the Macaronesian archipelagos, surface temperature warming from 1981 to 2010 was significant in summer (June-August), ranging from 0.40◦ to 0.46◦ C per decade (Cropper and Hanna, 2014). In terms of biogeography and ecology, Cabo Verde stands at a crossroads between sub-tropical Macaronesia and the dry Sahel region (Florencio et al., 2021). This archipelago is particularly vulnerable to climate change due to its small size, high susceptibility to natural hazards, low economic resilience, and limited human and technological capacity for mitigation and adaptation to the effects of climate change (Varela et al., 2020). All these justify the need to implement strategies to mitigate climate change effects on the fragile Cabo Verde biodiversity (Romeiras et al., 2016). At a policy level, this could involve considering the implications of climate change on various development activities, including forest management (Castilla-Beltrán et al., 2021a). However, Cabo Verde is a Low Forest Cover Country (LFCC), and only 10% of its territory is classified as arable land (World Bank, 2018). Meanwhile, climate change affects directly and indirectly the geographic distributions of species, particularly of endemic plant species, and the growth and productivity of forests through changes in temperature, precipitation, and other climate-related factors (Chang et al., 2015). The vascular flora of Cabo Verde comprises ca. 740 taxa, of which ca. 92 are endemic (Romeiras et al., 2020). Nevertheless, in a recent conservation assessment based on the IUCN Red list criteria, ca. 78% of the endemic plant species are threatened (Romeiras et al., 2016), primarily because of increasing habitat degradation, human disturbance (e.g., agriculture or other traditional uses) (Castilla-Beltrán et al., 2020, 2021b; Norder et al., 2020), and the introduction of exotic species since the early archipelago ´ s settle ments (Romeiras et al., 2011; Brilhante et al., 2021). Only three endemic tree species are recognized for Cabo Verde: the iconic dragon tree, Dracaena draco L. subsp. caboverdeana Marrero-Rodr. & Almeida-Pérez; the Cabo Verde date Palm, Phoenix atlantica A.Chev.; and Sideroxylon marginatum (Decne. ex Webb) Cout., locally named “marmulano” (Romeiras et al., 2020). Moreover, only four native non-endemic trees occur in the archipelago: Faidherbia albida (Delile) A.Chev. (syn. Acacia caboverdeana see Rivas-Martinez et al., 2017), Ficus sur Forssk., Ficus sycomorus L., and Tamarix senegalensis DC. (Neto et al., 2020). These native tree species have an Afrotropical range, which contrasts with the northern and central archipelagos of Macaronesia (i.e., Azores, Madeira, and Canary Islands), where well-known forest habitats are found, namely laurel forest, thermophilic woodlands, or pine forests (Fernández-Palacios et al., 2011; Freitas et al., 2019). There is a consensus, based on the first historical descriptions, suggesting that Cabo Verde was not covered by a dense and continuous forest cover prior to human settlement (Romeiras et al., 2014). Despite its geographical position, close to the Tropic of Cancer, in association with limited rainfall (i.e., largely restricted from August to October) that constrains forest development, the current dwindling native tree cover in Cabo Verde can be explained by land-use practices that encroached the remnant trees in the most inaccessible or un productive parts of the islands (Castilla-Beltrán et al., 2021a, 2020; Norder et al., 2020). It is widely recognized that native woody plant communities play an important role in terms of conservation of biodiversity and ecosystem services, however, there is little knowledge about the climatic niche of Cabo Verde’s endemic trees, as well as the projected impact of climate change on their future distribution and conservation. Species Distribution Models (SDMs), also known as ecological niche models, have emerged as a useful tool in spatial ecology, conservation, and land management (Casajus et al., 2016; Thuiller et al., 2011). SDMs relate species occurrences (i.e., species presence or abundance) with a set of explanatory variables (e.g., bioclimatic variables, altitude, solar radiation, land cover/use, and habitat), which can then be projected under different future climate scenarios (Araujo et al., 2005). SDMs generate geographical maps of environmental suitability for the study species, predicting the likelihood of their presence as well as their abundance. This can be used to select conservation areas, to predict the effects of climate change on species ranges, and to determine the risk of biological invasions (Araujo et al., 2005; Casajus et al., 2016; Thuiller et al., 2020). There are many modeling techniques, including Random Forest (RF) (Breiman, 2001; Prasad et al., 2006), Generalized Linear Models (GLM) (Dobson and Barnett, 2018; Wooldridge, 2008), and Gener alized Additive Models (GAM) (Rigby and Stasinopoulos, 2005). Those methods proved to be reliable to model tree species distribution in the Macaronesian islands (e.g., Azores archipelago: Dutra Silva et al., 2017, 2019, 2021; Canary Islands: Arévalo et al., 2005; Aranda and Lobo, 2011) and in other islands such as Melville Island (Rudy et al., 2016), or in Oshima Volcanic Island (Dou et al., 2019). In this paper, we analysed the climatic niche of Cabo Verdean endemic tree taxa and the potential impact of climate change on their distribution. We also used the SDMs to assess the effectiveness of protected areas, fundamental units for conservation (Thomas et al., 2012). The main goal of this study was to describe the climatic conditions characterizing the present distribution ranges of the target D. Varela et al.
- 3. Global Ecology and Conservation 34 (2022) e02025 3 taxa and, using SDMs, to project the range shifts of climatically suitable habitats for Cabo Verdean endemic trees. Finally, we discuss the possibility of using the SDMs results to support future actions aiming at the conservation and ecological use of Cabo Verde endemic trees. 2. Material and methods 2.1. Study area Cabo Verde is an archipelago located in the north-eastern Atlantic Ocean, about 500 km off Africa’s west coast and 1500 km south of the Canary Islands. It lies between latitudes 14º and 18◦ N, and longitudes 22◦ and 26◦ W (Florencio et al., 2021). With a surface area of about 4033 km2 and approximately 500,000 inhabitants, the archipelago includes ten islands spatially divided into three groups: i) the Northern Islands (i.e., Santo Antão, São Vicente, Santa Luzia and São Nicolau); the Eastern Islands (i.e., Sal, Boavista and Maio) and the Southern Islands (i.e. Santiago, Fogo and Brava). Santiago Island, the largest one both in size (991 km2 ) and population (294,135 inhabitants in 2015), is home to the capital – Cidade da Praia (Varela et al., 2020). Rainfall patterns in Cabo Verde are influenced by topographic factors, such as altitude and aspect, which becomes evident when comparing the low-altitude islands (Eastern group: Sal, Boavista, Maio), where the climate is semi-arid, with the high-altitude islands (Santo Antão, São Nicolau, Fogo, Santiago, Brava) where the climate is more humid (Romeiras et al., 2015). Moreover, on the north/northeast-facing slopes, the typical semiarid and dry conditions that characterize the southern slopes are replaced by the more humid conditions found at the northern slopes (Duarte et al., 2008; Neto et al., 2020). Scarce hydrological resources characterize Cabo Verde due to the low and irregular rainfall (average 352 mm/year from 1990 to 2016), well below the African continent average (653 mm/year for the same period) (Varela-Lopes and Molion, 2014). The dry and adverse climate of Cabo Verde was testified by the first settlers and sailors who came to the islands (Romeiras et al., 2014). 2.2. Target species Our target species are the Cabo Verde endemic trees: Dracaena draco subsp. caboverdeana; Phoenix atlantica; and Sideroxylon marginatum. The species names follow Romeiras et al., (2016, 2020) and correspond to those accepted in the Plants of The World database (POWO, 2021). 2.2.1. Dracaena draco L. subsp. caboverdeana Marrero-Rodr. & Almeida-Pérez (Asparagaceae) Synonyms: Dracaena draco subsp. draco; Dracaena draco (L.) L.; Dracaena caboverdeana (Marrero Rodr. & R.S. Almeida) Rivas Martínez., Lousã, J.C.Costa & Maria C.Duarte comb. nov. Dracaena draco subsp. caboverdeana was described by Marrero and Almeida (2012), based on morphological characters and on the respective habitat and phytogeography. More recently, Rivas-Martinez et al. (2017) considered this taxon as a new species, Dracaena caboverdeana, but this classification has not been recognized in the global databases (e.g., POWO, 2021). According to Marrero and Almeida (2012) this taxon only has natural populations on Santo Antão, São Nicolau and Fogo, but also grows sub-spontaneously on Santiago and Brava, showing a preference for humid and sub-humid areas. It grows spontaneously in sea facing cliffs, profiting from the windblown humidity. The main altitudinal distribution occurs between 500 and 900 m. It is closely related to the Macaronesian tree Dracaena draco subsp. draco, presently considered as rare in nature. The total number of individuals has been estimated at less than 500, and its conservation status is CR B1ab(ii,iv) (Romeiras et al., 2016). 2.2.2. Phoenix atlantica A.Chev. (Arecaceae) 2.2.2.1. Synonyms: Phoenix atlantidis A.Chev. This taxon is presently found in the islands of Boavista, Maio, Sal, and Santiago. The natural populations occur in arid or extremely arid zones, in sandy areas and coastal valleys. Its main altitudinal distribution extends up to 250 m a.s.l. The total number of individuals has been estimated at less than 1000, and its conservation status is EN B1ab(iii)+ 2ab (iii) (Romeiras et al., 2016). Some recent literature considers that Phoenix atlantica might not be a separate species but rather a feral population of Phoenix dactylifera that dispersed naturally to Cabo Verde from cultivated date palms in mainland Africa (Chaluvadi et al., 2019; Gros-Balthazard et al., 2017). However, Srinivasa et al. (2019) showed that Phoenix atlantica is part of a sister clade of Phoenix dactylifera. 2.2.3. Sideroxylon marginatum (Decne. ex Webb) Cout. (Sapotaceae) Synonyms: Calvaria marginata (Decne. ex Webb) Dubard; Sapota marginata Decne. ex Webb; Sideroxylon mirmulano var. marginata (Decne. ex Webb) A.Chev. This taxon is presently found in the islands of Brava, Fogo, Santiago, and Santo Antão, with no recent records for the islands of São Vicente, São Nicolau, Sal, and Boavista. It is found in steep cliffs and other inaccessible places, with a main altitudinal distribution between 500 and 1200 m a.s.l. since it was eliminated by human activities in more accessible areas. The total number of individuals has been estimated at less than 500, and its conservation status is EN B1ab(ii)+ 2ab(ii) (Romeiras et al., 2016). The phylogeny of the genus was revised by Stride et al. (2014) but, from the three species occurring in Macaronesia, Sideroxylon mirmulano R.Br., endemic from Madeira, was not sampled, while Sideroxylon canariense Leyens, Lobin & A.Santos, endemic from the Canary Islands, and Sideroxylon D. Varela et al.
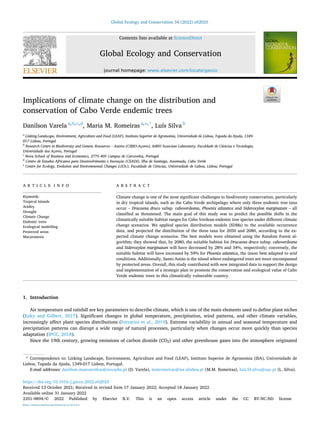
- 4. Global Ecology and Conservation 34 (2022) e02025 4 marginatum were not included in the same clade. The latter was found to be closely related to Sideroxylon inerme L., with a native range from Somalia to South Africa, Mayotte, Aldabra, and Juan de Nova Island. Therefore, this genus does not seem to be monophyletic in Macaronesia (Stride et al., 2014). 2.3. Species data The presence-only data for the three taxa (Fig. 1) were collected from the following sources: i) herbarium specimens (i.e., col lections housed in the LISC herbarium IICT/ULisboa); ii) published records (Brochmann et al., 1997; Brochmann and Rustan, 2002; Marrero and Almeida, 2012; Romeiras et al., 2016); iii) Global Biodiversity Information Facility (GBIF.org, 2021) records; and iv) recent field surveys undertaken by M.M.R. For each record, the precise geographic coordinates of its location were obtained, using a portable GPS, with an error below 10 m. Finally, the presences of the endemic trees were organized in a database. 2.4. Environmental variables The environmental variables corresponded to different predictors (Table S1): (i) Nineteen bioclimatic variables downloaded from the WorldClim v2.0 dataset (http://www.worldclim.org/bioclim) at a reso lution of 30 arc-seconds (Fick and Hijmans, 2017); (ii) Altitude data downloaded from CGIAR-CSI Consortium for Spatial Information (https://cgiarcsi.community/data/srtm-90m- digital-elevation-database-v4-1/) at a resolution of 90 m (Lin et al., 2013); (iii) Two soil variables downloaded from ISRIC - World Soil Information (http://data.isric.org) at a resolution of 500 m, corre sponding to plant-available water holding capacity of the soil fine fraction (v%), and soil pH (Leenaars et al., 2018); (iv) The Land Cover and Land Use (LCLU) data was downloaded from Permanent Inter-State Committee for Drought Control in the Sahel (CILSS, 2016). The bioclimatic variables available in WorldClim and CCAFS (http://www.ccafs-climate.org) have been extensively used in plant distribution modelling (Booth, 2018; Deblauwe et al., 2016; Perrin et al., 2020). Variance Inflation Factor (VIF) was used to explore the Fig. 1. Occurrence of the three endemic tree taxa from Cabo Verde. D. Varela et al.
- 5. Global Ecology and Conservation 34 (2022) e02025 5 correlation between variables and avoid high collinearity (Robinson and Schumacker, 2009). The predictors with the highest VIF values were discarded first, and new VIF scores were calculated among the remaining predictors; this was repeated until all VIF scores were below a value of 10. The collinearity test was conducted in R (R Development Core Team, 2020). We prepared the data layers in QGIS software 2.18.20 (Quantum GIS Development Team, 2016). All variables were rescaled to 30 s (ca. 1 km2 ) spatial resolution and projected into the same Geographic Coordinate System (WGS, 1984) selecting the method of the nearest neighbor resampling. 2.5. Future climate To explore the effect of climate change on the distribution of Cabo Verde endemic trees, the future potential distributions were projected using the predictions from the IPCC’s 5th assessment, available at the International Centre for Tropical Agriculture (see http://www.ccafs-climate.org). We chose the Fifth Assessment Report (AR5) of the IPCC, being the most detailed assessment of climate change, and considered as a reliable basis for policymaking (Symon, 2013). The scenarios of human influence underlying the AR5 projections, known as RCPs (Representative Concentration Pathways), are expressed in terms of greenhouse gas concentrations. Each RCP implies a different amount of human-driven climate change, resulting in a different amount of extra heat energy being stored in the Earth system due to greenhouse gas emissions. These scenarios were developed using assumptions concerning economic growth, technology choices, and land use (Symon, 2013). In this study, we followed two scenarios: (i) RCP 4.5 is a stabilization scenario where total radiative forcing is stabilized before 2100 by employing a range of technologies and strategies for reducing greenhouse gas emissions. The rise in global mean surface temperature in the atmosphere by the end of the 21st century would range 1.1–2.6 ◦ C; (ii) RCP 8.5 assumes a ’business-as-usual’ approach, leading to atmospheric concentrations of CO2 three to four times higher than pre-industrial levels, by 2100. The rise in global mean surface temperature in the atmosphere by the end of the 21st century would range 2.6–4.8 ◦ C. 2.6. Modelling 2.6.1. Modelling framework and algorithms Implications of climate change on the distribution of Cabo Verde endemic trees were predicted by applying a modelling approach - BIOMOD (BIOdiversity MODelling; “biomod2”) (Thuiller et al., 2020). BIOMOD is a freeware, open-source package implemented in R (R Development Core Team, 2020) aiming to maximize the predictive accuracy of current species distributions and the reliability of future potential distributions, using different types of statistical modelling methods. We used a total of three different SDM algorithms implemented in the BIOMOD2 package: Generalized Linear Models (Dobson and Barnett, 2018; Guisan et al., 2002), and Generalized Additive Models (GAM) (Guisan et al., 2002; Rigby and Stasinopoulos, 2005), and one machine learning method, Random Forest (Breiman, 2001). Random Forest (RF) has generally been available for more than 23 years and has been known to perform exceptionally well in ecological predictions to model training with small sample sizes (Mi et al., 2017; Dutra Silva et al., 2021). Random Forest is an ensemble of unpruned classification or regression trees created by using bootstrap samples of the training data and random feature selection in tree induction (Breiman, 2001). Predictions from all trees are pooled to make the final prediction: the classes’ mode for classification or the mean forecast for regression. According to Ronaghan (2018), the node probability can be calculated by the number of samples that reach the node, divided by the total number of samples. The higher the value, the more important the feature. The importance of each feature on a decision tree is then calculated as: fii = ∑ j:node j splits on feature i nij ∑ kϵall nodes nik • fii = the importance of featurei • nij = the importance of node j The sum of the feature’s importance value on each tree is calculated and divided by the total number of trees: RFfii = ∑ kϵall trees normfiij T • RFfii = the importance of feature i calculated from all trees in the Random Forest model • normfiij = the normalized feature importance for i in tree j • T = total number of trees. GLMs are mathematical extensions of linear models that do not force data into unnatural scales, and thereby allow for non-linearity and non-constant variance structures in the data (Wooldridge, 2008; Dutra Silva et al., 2021). GAMs are semi-parametric extensions of D. Varela et al.
- 6. Global Ecology and Conservation 34 (2022) e02025 6 GLMs; GAM and GLM use a link function to establish a relationship between the mean of the response variable and the explanatory variables (Guisan et al., 2002; Rigby and Stasinopoulos, 2005; Dutra Silva et al., 2021). Regression analyses have been broadly used in modelling the spatial distribution of species and communities (Guisan and Zimmermann, 2000). The following form gives the Generalized Linear model: Yi = β0 + βiXi + εi (1) where εi~ N ( 0, σ2 ) is an error model, Yi is the dependent variable; Xi represents the matrix of explanatory variables; and βi is the vector of regression coefficients to be estimated. A sum of weighted ecogeographical predictors explains the dependent variable (presence/absence). The weights are tuned in order to generate the best fit between the model and the calibration data set (Hirzel et al., 2001; Wooldridge, 2008). The distribution of Y in a GLM is different from the classical linear models, which presuppose a Gaussian (i.e., normal) distribution and an identity link. In GLMs, the distribution may be any of the exponential family distributions (e.g., Gaussian, Poisson, or binomial). The link function may be any monotonic differentiable function (like logarithm or logit). The variance of Y depends on μ = Е(Y) through the variance function V(μ), giving Var(Y) = ϕV(μ), where ϕ is a scale (also known as dispersion) parameter (Guisan et al., 2002). The broader generalization of GLMs is known as GAMs; it was a second important step forward in regression analyses (Guisan et al., 2002; Dutra Silva et al., 2021). The strength of GAMs is their ability to deal with highly non-linear and non-monotonic relationships between the response and the set of explanatory variables. GAMs are parameterized just like GLMs, except that some predictors can be modelled nonparametrically, in addition to the linear and polynomial terms for other predictors (Guisan et al., 2002; Dutra Silva et al., 2021). 2.6.2. Pseudo-absences The use of RF in SDMs has proven robust and stable because it can handle abundance information, multicategory or binary, e.g. presence and absence data (Hegel et al., 2010; Dutra Silva et al., 2021). Research of comparisons between various SDM has shown that presence-absence models tend to perform better than presence-only models (Elith et al., 2006; Dutra Silva et al., 2021). In this study the absence points were not available in our original data set, thus we generated pseudo-absences by a random selection. This method involves taking pseudo-absence points from the background data, randomly, across the whole study area. The number of pseudo-absences used for all the algorithms was equal to the number of occurrences because the predictive accuracy increased in that situation but decreased when the number of pseudo-absences was large (> 1000). To minimize projection bias, we applied the “random Points” function in R package “dismo” (Hijmans et al., 2020). 2.6.3. Model training As a validation set was not available, cross-validation was applied. We randomly split the dataset into two subsets (training data 70% and test data 30%) and we performed 10 replicate model runs per algorithm to account for model variability. The first subset was used to fit the model and the second subset to evaluate the model fit, then predictions were made and compared to the expected values. 2.6.4. Model validation In order to evaluate the models, three evaluation measures were calculated: The Boyce Index (Boyce et al., 2002; Pearce and Boyce, 2006); the area under the curve (AUC) of the receiver-operating characteristic (ROC) plot (Jiménez-Valverde, 2012); and the true skill statistic (TSS) (Allouche et al., 2006). Both TSS and AUC were calculated taking into account the proportion of the two prediction types “sensitivity” (correctly predicted presences) and “specificity” (correctly predicted absences) which involves all four elements of the error matrix (true and false presences and absences), derived from the test data (Singer et al., 2017). The Boyce index was proposed by Boyce et al. (2002) and improved by Hirzel et al. (2006). The validation criteria consist of the analysis of continuous Boyce indexes and curve shape: (i) the standard deviation around the curves should be narrow; (ii) the curves should be linear and ascending; and (iii) the O (Observed)/E (Expected) ratio should be high. Ideally, a good habitat suitability (HS) model produces a monotonically increasing curve and its goodness of fit is measured by the Spearman rank correlation coefficient (Hirzel et al., 2006; Costa et al., 2015). The accuracy was evaluated in terms of the AUC. A good model is defined by a curve that maximizes sensitivity for low values of the false positive fraction (Hernandez et al., 2006). The AUC quantifies the significance of the curve where the values range from 0.5 to 1, values close 1 indicating a good model (Wisz et al., 2008). TSS requires a specific threshold level and is a prevalence independent alternative to Cohen’s kappa (Allouche et al., 2006). It ranges from –1 to + 1, with values above 0.4 indicating a statistically reliable model performance (Allouche et al., 2006). In terms of prediction accuracy, TSS values ranging from 0.2 to 0.5 were considered poor, from 0.6 to 0.8 useful, and values above 0.8 were considered good to excellent (Dutra Silva et al., 2019). 2.6.5. Model projection The best models for the current distribution of each endemic taxa were projected for the present conditions and into the future at two different time slices (2050, and 2080) using the respective functions of BIOMOD 2 and the predicted future climates from the IPCC’s 5 assessment taken from the International Centre for Tropical Agriculture website (see http://www.ccafs-climate.org/). The probabilistic ensemble forecasts were translated into binary maps using the value that maximizes the AUC scores as the threshold for D. Varela et al.
- 7. Global Ecology and Conservation 34 (2022) e02025 7 distinguishing presence and absence predictions. The maps were then reclassified into four levels, according to the respective quartiles of habitat suitability. Suitable habitat corresponded to areas on the map that are in the third and fourth quartiles, that is, where there is a probability of more than 50% for the occurrence of the studied species. To estimate how much each species loses or gains in suitable habitat, the number of pixels gained and lost for each species was calculated. If, in the future, the probability of species occurrence decreases below 50%, there will be loss of suitable habitat. On the other hand, if a present area was in the first or second quartile and changed to third or fourth in future projections, there will be a gain of suitable habitat, under the assumption of unlimited dispersal, and such sites may potentially constitute new Protected Areas (PAs) in the future (MAAP, 2004). Maps were edited showing those areas expected to remain stable and those predicted to lose or gain suitable habitat in the future. 2.7. Protected area effectiveness To estimate to what extent the Cabo Verde Protected Areas can preserve endemic trees under climate change, we calculated the suitable habitat inside those areas under current and future projections, by counting the pixels corresponding to favourable climate. The national network of Protected Areas of Cabo Verde was downloaded from IDE-CV (2020). 3. Results 3.1. Climatic niches of the endemic trees A summary of altitude and of climatic conditions in which Cabo Verde’s endemic trees currently occur is shown in Table 1. Among the endemic trees, Dracaena draco subsp. caboverdeana occurs at higher altitudes (926 m) than Phoenix atlantica and Sideroxylon marginatum. Phoenix atlantica occurs in flat areas at low altitudes, corresponding to zones with relatively higher temperatures. In future projections, the temperature and precipitation will increase at those sites (Table S2). Under the RCP 4.5 in 2080, the average annual mean temperature will increase 0.59, 1.90 and 1.21ºC in the areas presently occupied by Dracaena draco subsp. caboverdeana, Phoenix atlantica, and Sideroxylon marginatum, respectively. The average values for all bioclimatic variables used in modelling are shown in Tables S3. Some bioclimatic variables are expected to increase, namely Bio6 (Min Temperature of Coldest Month), Bio9 (Mean Temperature of Driest Quarter), and Bio16 (Precipitation of Wettest Quarter). In contrast, the variables Bio2 (Mean Diurnal Range), Bio4 (Temperature Seasonality), Bio3 (Isothermality), Bio13 (Precipitation of Wettest Month), and Bio15 (Precipitation Seasonality) are expected to decrease. 3.2. Variable and model selection The VIF analysis was performed for each species individually (Table 2). Of the 23 variables available for modelling, 9 variables were excluded after VIF analysis, thus 14 variables were used as model predictors (see Table S1). 3.3. Model Evaluation In general, Random Forest (RF) provided better results than the other algorithms (Table 3). The models’ performance to predict the currently suitable area was good, with TSS values ranging from 0.57 (GLM) to 0.90 (RF), and AUC values ranging from 0.80 (GLM) to 0.97 (RF). 3.4. Distribution of endemic trees under climate change projections Our results show that under current climatic conditions, Phoenix atlantica is the species with the largest suitable area (Fig. 2; Table 4). The north (Ribeira Grande) and northeast (Ribeira do Paul) of Santo Antão Island are regions with high suitability for the occurrence of Dracaena draco subsp. caboverdeana. The most appropriate region for Sideroxylon marginatum is the northern region of the Santiago Island (Santa Catarina, São Salvador do Mundo, São Miguel, Santa Cruz, and São Domingos). Boavista, São Vicente, and Sal islands were shown to be less favourable to the occurrence of endemic trees. Nonetheless, the area favourable to endemic trees might increase in the future (2050: Fig. S1 and 2080: Fig. S2). The two scenarios (RCP 8.5 and RCP 4.5) originate similar predictions. However, the expected increase in the total area suitable to endemic trees is due Table 1 Summary of altitude above sea level, annual mean temperature, and annual precipitation for the current habitat conditions of the three taxa, cor responding to Cabo Verde endemic trees. Taxa Altitude (m) Annual Mean Temperature (ºC) Annual Precipitation (mm) Avg Max Min Avg Max Min Avg Max Min Dracaena draco subsp. caboverdeana 926 1301 261 18.5 22.1 16.9 329 375 205 Phoenix atlantica 73 245 5 23.7 25.0 20.9 139 271 61 Sideroxylon marginatum 502 1105 192 21.0 24.2 17.3 292 373 228 D. Varela et al.
- 8. Global Ecology and Conservation 34 (2022) e02025 8 solely to Phoenix atlantica (59% under RCP 8.5). In general, the other two taxa are expected to register a decrease in future projections (Fig. 3; Table 4). We expect a considerable increase in suitable habitat for Phoenix atlantica in Boavista (Fig. 3). Dracaena draco subsp. caboverdeana is Table 2 Variables selected for each taxon, according to the results of the VIF analyses. Taxa Variables selected Dracaena draco subsp. caboverdeana Bio2, Bio4, Bio6, Bio14 and Bio13 Phoenix atlantica altitude, pH, Bio2, Bio4, Bio9, Bio16, Bio15, Sideroxylon marginatum pH, soil-water, Bio16, Bio15, Bio14, Bio6, Bio3 Table 3 Results of model evaluation using TSS, AUC, and Boyce index (mean ± se). Taxa Algorithms TSS AUC Boyce Dracaena draco subsp. caboverdeana GLM 0.79 ± 0.071 0.88 ± 0.064 0.58 ± 0.066 GAM 0.88 ± 0.045 0.89 ± 0.092 0.66 ± 0.068 RF 0.87 ± 0.014 0.93 ± 0.013 0.73 ± 0.051 Phoenix atlantica GLM 0.57 ± 0.042 0.80 ± 0.062 0.95 ± 0.056 GAM 0.74 ± 0.023 0.82 ± 0.064 0.85 ± 0.066 RF 0.90 ± 0.003 0.96 ± 0.065 0.95 ± 0.041 Sideroxylon marginatum GLM 0.58 ± 0.062 0.82 ± 0.063 0.98 ± 0.066 GAM 0.60 ± 0.067 0.81 ± 0.068 0.88 ± 0.065 RF 0.88 ± 0.017 0.97 ± 0.064 0.96 ± 0.066 Fig. 2. Current suitable area for Cabo Verde endemic trees. Suitable areas (medium suitability and high suitability) were those corresponding to probabilities of occurrence above 50%. Table 4 Suitable habitat (probability of occurrence above 50%) in km2 and variation (Δ) in percentage. Taxa Present 2050 RCP 4.5 Δ 2050 RCP 8.5 Δ 2080 RCP 4.5 Δ 2080 RCP 8.5 Δ Dracaena draco subsp. caboverdeana 778 511 -34 484 -38 454 -42 338 -57 Phoenix atlantica 1598 2146 + 34 2164 + 35 2528 + 58 2542 + 59 Sideroxylon marginatum 1427 1030 -28 960 -33 1092 -23 947 -34 D. Varela et al.
- 9. Global Ecology and Conservation 34 (2022) e02025 9 expected to have a decrease in the extension of its suitable area in most of its present range, but an increase of its range in Fogo Island, mainly around the protected area of Chã das Caldeiras (Fig. 3). In some regions of Fogo, Brava, and Santo Antão islands, Dracaena draco subsp. caboverdeana and Sideroxylon marginatum are expected to share the same areas. However, suitable habitat areas for those taxa are expected to decrease in Santo Antão Island (Paul and Ribeira Grande), and Santiago Island (Santa Catarina de Santiago and São Lorenço dos Órgãos). For the year 2080, under scenario RCP 4.5, Dracaena draco subsp. caboverdeana is the most affected species (− 460 km2 ). The predicted reduction in suitable habitat for Dracaena draco subsp. caboverdeana, and Sideroxylon marginatum will range from − 34% to − 57% and − 28% to − 34%, respectively. Those two taxa seem to be more vulnerable to the change in air temperature than Phoenix atlantica, with a predicted increase in the suitable area ranging from 34% to 59%. The most important variables for Dracaena draco subsp. caboverdeana were Bio2 and Bio6, followed by Bio13, Bio4, and Bio14. Bio 6 (Minimum Temperature of Coldest Month) will increase 2.43 ℃ in 2050 and 2.51 ℃ in 2080, under the RCP 4.5, while Bio2 (Mean Diurnal Range) will decrease around 1.38 ℃ in 2050 and 2080, partly due to an increase in minimum temperature (Fig. S3; Table S3). The most important variables for Phoenix atlantica were Bio2 and altitude, followed by Bio4, Bio16, and Bio9 (Fig. S4). The most important variable for Sideroxylon marginatum was Bio6, followed by pH and Bio16. Bio14 and soil water had a low contribution to the model (Fig. S5). In Cabo Verde, under the RCP 8.5 scenario, the Annual Mean Temperature (Bio1) will increase from 25.96 ◦ C (sd =2.30) to 29.60 ◦ C (sd =2.8), a difference of 4 ◦ C. However, Temperature Seasonality (Bio4) will decrease from 17.19 ◦ C (sd=15.4) to 15.34 ◦ C (sd =13.9). Annual Precipitation (Bio12) will increase from 598 to 604 mm in 2080. 3.5. Protected area effectiveness and conservation The distribution model for the present conditions showed that the proportion of suitable habitat for the endemic trees located within the Protected Areas network was below 10% for Sideroxylon marginatum, slightly above that value for Phoenix atlantica, and almost 30% for Dracaena draco subsp. caboverdeana (Table 5). According to future projections (2080), the area with suitable habitat Fig. 3. Change in habitat suitability in 2080 under RCP 4.5. Loss indicates areas where habitat suitability is expected to decline. Gain shows areas where habitat suitability is expected to increase. Unsuitable indicates areas with a low probability (less than 50%) for the occurrence of endemic trees in the present and in the future. Stable corresponds to areas expected to remain suitable over time. Table 5 The efficacy of the present Protected Areas network in the conservation of Cabo Verde endemic trees. Taxa Current Suitable area inside PAs (km2 ) % Predicted suitable area inside PAs in 2080 under RCP 4.5 (km2 ) % Dracaena draco subsp. caboverdeana 217 28 190 24 Phoenix atlantica 198 12 322 20 Sideroxylon marginatum 96 7 67 5 Total 511 13 579 15 D. Varela et al.
- 10. Global Ecology and Conservation 34 (2022) e02025 10 covered by the network will slightly decrease for Sideroxylon marginatum and Dracaena draco subsp. caboverdeana and is expected to have a relevant increase for Phoenix atlantica (Table 5). The most effective protected area, specifically for Dracaena draco subsp. caboverdeana, is the Natural Park of Moroços, in the centre of Santo Antão Island, covering about 93% of the new area expected for 2080. To provide input for strategic conservation planning, we georeferenced the main areas expected to become suitable for endemic trees in 2080 (Fig. 4). Namely, the gain in suitable area for Dracaena draco subsp. caboverdeana in Fogo, and for Sideroxylon marginatum in São Nicolau and Santiago (Fig. 4). 4. Discussion 4.1. Past, present, and future distribution of Cabo Verdean endemic trees The primary vegetation of the Cabo Verde archipelago was probably dominated by open landscapes and thermophilous woodlands, which included endemic tree species such as Dracaena draco subsp. caboverdeana and Sideroxylon marginatum, mainly in mountain areas, and Phoenix atlantica in coastal areas (Castilla-Beltrán et al., 2021b, 2020; Neto et al., 2020). However, after more than 500 years of human settlement on these islands, the resulting anthropogenic pressures associated with land-use change (e.g., fire, wood extraction, introduction of herbivores, and agricultural practices) resulted in a shift toward a sparser woody plant vegetation (Romeiras et al., 2016). Also, during the mid-20th century, afforestation practices promoted plantations of fast-growing trees, well adapted to the adverse climate of Cabo Verde (e.g., Prosopis juliflora, Eucalyptus spp., and Pinus canariensis), which affected the vegetation structure and composition in these islands (Castilla-Beltrán et al., 2021a; Neto et al., 2020). Although several factors might explain the spacio-temporal variation in the distribution and abundance of woody plant vegetation in Cabo Verde, including unsuitable local environmental conditions, dispersal limitations, or human disturbance, our study provides new and essential information to forecast and manage the response of the endemic trees to future climate change. Currently, Dracaena draco subsp. caboverdeana is restricted to small patches in Santo Antão, Fogo and São Nicolau (Romeiras et al., 2016). This taxon probably occurred on the northern slopes of Serra da Malagueta, as suggested by the numerous toponyms referring to this species in that area (Marrero and Almeida, 2012). It occurs at high altitudes, above 900 m (Annual Mean Temperature, 18.5ºC; Annual Pre cipitation, 329 mm), that is, in areas with humid or sub-humid climate (Marrero and Almeida, 2012). This tree is closely related to Fig. 4. New Protected Areas in Fogo (Dracaena draco subsp. caboverdeana), Santiago and São Nicolau Islands (Sideroxylon marginatum), as suggested by the modelling results for 2080 under RCP 4.5. The numbers (1–22) represent the municipalities on each island. D. Varela et al.
- 11. Global Ecology and Conservation 34 (2022) e02025 11 Dracaena draco subsp. draco, endemic to the Canary Islands (Gran Canaria, Tenerife), occurring under similar climatic conditions (Marrero and Almeida, 2012). Projections for the future distribution of Dracaena draco subsp. caboverdeana showed that, by 2080, a global decrease of 37.60–59.11% is to be expected, according to RCP4.5 and RCP 8.5, respectively. In the northern parts of Santo Antão, Santiago, São Nicolau, and Brava islands, the suitable area will decrease (− 460 km2 ), which might be associated with the expected change in important variables, such as the Minimum Temperature of the Coldest Month (increase of 2.43 ◦ C in 2050, and of 2.51ºC in 2080, according to RCP 4.5) and the Mean Diurnal Temperature Range, expected to decrease about 1.38ºC (for both 2050 and 2080, according to RCP 4.5). With temperature increase in these regions, the optimal temperature for the occurrence of this species will probably be exceeded. Nevertheless, expansion is anticipated in some locations, such as around the protected area of Chã das Caldeiras (ca. 129 km2 ), one of the coldest regions of Cabo Verde and where the expected increase in temperature does not exceed the present-day optimum. Dracaena draco subsp. caboverdeana seems to be adapted to relatively cold and wet conditions, and increased aridity in future climate scenarios will most likely reduce its habitat suitability. Similar results were found by Attorre et al. (2007) who suggest a 45% reduction in the potential habitat of Dracaena cinnabari Balf.f. by 2080, due to a predicted increase in aridity. For southern Africa, Lawal et al. (2019) predicted that vegetation productivity will decline in Mozambique, Namibia, Botswana, Zimbabwe and Zambia, as a consequence of a warming of 1.5–2 ◦ C. Similarly to the situation of Sideroxylon canariense in the neighbour archipelago of the Canary Islands (Lobin et al., 2005; Neto et al., 2020), the past distribution of Sideroxylon marginatum might have been always relatively scattered. Currently, Sideroxylon marginatum is mainly found in cliffs and inaccessible places, due to constant cutting of trees, particularly in rural areas where about 45% of the population still uses firewood as a main source of fuel (Monteiro et al., 2020). This is also in agreement with other studies (e.g., Irl et al., 2014) claiming that the use of firewood for domestic activities has been particularly destructive of insular forest areas. Therefore, Sideroxylon marginatum mostly occurs at relatively high elevations, above 500 m (Annual Mean Temperature, 21ºC; Annual Precipi tation 292 mm). Its potentially suitable habitat is expected to decrease under both scenarios (by 2050 and 2080), probably due to an increase in aridity, as suggested for Dracaena draco subsp. caboverdeana. This is supported by the fact that, in some locations of Fogo, Brava, and Santo Antão islands, both taxa share the same potentially suitable habitat. We therefore hypothesize that human activities, increased aridity, and biotic interactions may have affected the original distribution of both taxa in the past and, most likely, will continue to do so in the future. Phoenix atlantica occurs in flat areas at low altitudes, below 100 m (Annual Mean Temperature 23.7ºC; Annual Precipitation 139 mm), corresponding to zones of hot and dry climate, confirming its adaptation to relatively high temperatures (Safronov et al., 2017). Palm groves of this endangered taxon can still be seen in the eastern and southern islands of Cabo Verde, growing on riparian streams with temporary hydromorphy, mostly near the coast (Neto et al., 2020). Natural populations occur in arid or extremely arid zones, normally in sandy areas, thus explaining its main occurrence in flat islands such as Boavista, Maio, and Sal. Phoenix atlantica showed the largest potentially suitable area under the current climatic conditions (1528 km2 ). Moreover, its suitable habitat is ex pected to increase by 34% (2050) and by 35% (2080), according to RCP4.5. This increase is expected to occur mainly on the three above mentioned Eastern Islands, with low elevation and sandy soil. Two important variables in the climatic modelling, Mean Diurnal Range and Temperature Seasonality, are expected to decrease under future climatic conditions, while Precipitation of Wettest Quarter is expected to increase. That is, temperature variation will decrease due to an increase in minimum temperatures. The latter will lead to a permanently warmer climate, with precipitation more concentrated on the wettest quarter, which benefit species already adapted to a very dry climate, such as Phoenix atlantica and Phoenix dactylifera (Du et al., 2021; Müller et al., 2017; Safronov et al., 2017). Ac cording to Srinivasa et al. (2019), Phoenix atlantica is part of a sister clade of Phoenix dactylifera, which occurs in areas with higher temperatures than those where Phoenix atlantica is presently found. Date palm is a desert tree able to survive and produce fruits under extreme drought and heat (Müller et al., 2017). Thus, the expansion of suitable habitat expected for 2050 and 2080 could be explained by an expansion of available areas with relatively higher but nonetheless favourable temperatures than today. Globally, Phoenix atlantica is expected to lose 39 km2 of habitat in the most mountainous islands (Santiago and Santo Antão) and to gain about 1246 km2 in the low-lying islands, where climate will be warmer and drier than today. The expansion of tree species in areas with dry climate has been previously found. Estrada-Contreras et al. (2016) predicted a likely expansion of Cedrela odorata to dry or semi-dry warm areas. Kaky and Gilbert (2017) forecast suitable habitat gains for Egypt’s medicinal plants along the Mediterranean coast and the Qattara Depression, the climate of the latter being very arid, with temperatures ranging between 20 and 35ºC (winter and summer, respec tively), and precipitation ranging between 0.8 and 5 mm (January and April, respectively). 4.2. Implications for conservation We found that most of the occurrence points for Cabo Verde endemic trees were not located within the existing Network of Pro tected Areas. This suggests little effectiveness of such areas to protect endemic trees, namely in Santiago Island, making their con servation even more difficult in face of climate change. Although the Network of Protected Areas is essential for conservation planning, more than 70% of the occurrences of endemic trees were located outside those areas. Moreover, the locations with some potential of occurrence in Fogo Island were also outside the network, in both scenarios. This shows that areas around the natural parks should be preserved to allow for the establishment of endemic trees in the future. The areas where threatened species like Dracaena draco subsp. caboverdeana and Sideroxylon marginatum will gain suitable habitat under both future climate change scenarios should be regarded as sites of natural interest where the expansion of construction areas and other activities that considerably degrade the soil should be avoided. Decision-makers can use the results of this study to expand the Network of Protected Areas in the best way to face climate change. Another important point is the inherent low ability of Dracaena draco subsp. caboverdeana and Sideroxylon marginatum to adapt to D. Varela et al.
- 12. Global Ecology and Conservation 34 (2022) e02025 12 landscape changes given their long generation times and small populations, making them particularly susceptible to climate change (Brochmann et al., 1997; Lobin et al., 2005; Neto et al., 2020). On the other hand, Phoenix atlantica is highly adapted to low soil water availability and high temperature variation, and able to grow in dune ecosystems. Therefore, the potential ecological role and the ecosystem services provided by this species in the regulation of the water-cycle seem to be pivotal to alleviate future water shortage in these islands (Malagnoux et al., 2007). Despite the current marginal representation of the endemic tree species in the landscape of Cabo Verde Islands, scattered trees are keystone structures having, by definition, a disproportionate high functionality in the ecosystems where they occur, for instance by ensuring water and nutrient retention in the soil, and by providing shelter and food for the fauna (Gibbons et al., 2008; Fischer et al., 2010; Prevedello et al., 2018). The remnant autochthonous tree populations in the heavily modified Cabo Verde Islands must be no exception to this. Considering the ecological value of scattered trees (Prevedello et al., 2018), future studies should compare their patterns of occurrence with those of other species, taking into account their potential as umbrella-species in the protection of the whole biological community (Mikoláš et al., 2015; Roberge and Angelstam, 2004). In Cabo Verde, the endemic trees also have a huge po tential for future reforestation or even afforestation initiatives within the context of the measures against drought, defined as one of the critical environmental issues of the archipelago (Monteiro et al., 2020; Romeiras et al., 2016). 4.3. Global model evaluation Globally, model quality was highest for the RF algorithm. The good performance of RF in predicting species distributions has been confirmed in several studies (Dutra Silva et al., 2019, 2021; Marmion et al., 2009; Ren-Yan et al., 2014). Furthermore, RF has been known to perform quite well in ecological predictions based on model training with small sample sizes (Mi et al., 2017), which was supported by our results. This was confirmed by using TSS and AUC (Pearce and Boyce, 2006) but also by the analysis of the continuous Boyce indexes and the shape of the respective curves, with a small standard deviation, and ascending, almost linear curves (Boyce et al., 2002; Costa et al., 2013, 2012). 4.4. Research limitations One of the limitations of this study was the small sample size of the occurrence data set for the studied taxa. However, this resulted from the above-mentioned past reduction of the distribution range of these taxa, driven by human activities over the last 500 years (Romeiras et al., 2014). Also, high resolution climate and topographic data for Cabo Verde are currently difficult to obtain, therefore we used a spatial resolution of 30 s (ca. 1 km2 ), the highest available. Nonetheless, we think that the application of SDM to our data yielded results comparable to those found for other islands, providing valuable insights about the possible range shifts in climatically suitable habitats, under climate change scenarios, for the three endemic taxa. 5. Conclusions Cabo Verde has a tropical dry climate with most of the rainfall concentrated on the westernmost islands (Santo Antão, São Nicolau, Santiago, Fogo, and Brava) and at the highest altitudes of the N-NE slopes. Droughts and the general shortage of water are considered critical impairing factors for the development of the country (Monteiro et al., 2020; Varela et al., 2020), a situation that is expected to worsen in the context of climate change, particularly concerning the endangered taxa Dracaena draco subsp. caboverdeana and Side roxylon marginatum. Species distribution modelling allowed to better understand the current range and the potential shifts in the distribution of the endemic trees of Cabo Verde. This should be used as baseline information to establish priorities in the conservation and management of those taxa. Conservation strategies should focus on the area that currently has a low degree of protection but with a highly suitable habitat for endemic trees. Urgent attention is needed to revert the negative trends that led to the overall impover ishment of the native terrestrial flora of Cabo Verde. We should stress that the knowledge of the geographical range of the endemic trees of Cabo Verde provides essential baseline data to achieve the goals of the Paris Agreement, included in the country’s agenda as a priority to conserve the fragile biodiversity of these islands. Therefore, the conservation of these endemic trees and their instrumental values should be a priority in the conservation agenda of Cabo Verde. We hope that this study will contribute to the development of complementary studies concerning the propagation and ecological use of these trees, including their role in the local traditions, specifically as far as the medicinal and other ethnobotanical heritage is concerned. Funding This research was funded by the Fundação para a Ciência e Tecnologia (FCT) and Aga Khan Development Network (AKDN) through the project CVAgrobiodiversity/333111699. DV was supported by FCT grant (SFRH/BD/135354/2017) and by funding attributed to research units: UID/AGR/04129/2020 (LEAF/ISA) and UID/50027/2020 (InBIO/CIBIO). Acknowledgments Special thanks to Lara Dutra Silva for all her technical support in modelling. Our special thanks also to Sílvia Catarino and João Farminhão for the data used in this study. We thank two anonymous reviewers for their positive and constructive contribution for the D. Varela et al.
- 13. Global Ecology and Conservation 34 (2022) e02025 13 revision of manuscript. The authors thank the herbarium curator (Dr. Maria Cristina Duarte, FCUL) of the LISC Herbarium (IICT/ ULisboa). Declaration of competing interest The authors declare no conflict of interest. The funders had no role in the design of the study; in the collection, analyses, or interpretation of data; in the writing of the manuscript, or in the decision to publish the results. Appendix A. Supporting information Supplementary data associated with this article can be found in the online version at doi:10.1016/j.gecco.2022.e02025. References Allouche, O., Tsoar, A., Kadmon, R., 2006. Assessing the accuracy of species distribution models: prevalence, kappa and the true skill statistic (TSS). J. Appl. Ecol. 43, 1223–1232. https://doi.org/10.1111/j.1365-2664.2006.01214.x. Aranda, S.C., Lobo, J.M., 2011. How well does presence-only-based species distribution modelling predict assemblage diversity? A case study of the Tenerife flora. Ecography 34, 31–38. https://doi.org/10.1111/j.1600-0587.2010.06134.x. Araujo, M., Pearson, R., Thuiller, W., Erhard, M., 2005. Validation of species-climate impact models under climate change. Glob. Chang. Biol. 11, 1504–1513. https:// doi.org/10.1111/j.1365-2486.2005.01000.x. Arévalo, J.R., Delgado, J.D., Otto, R., Naranjo, A., Salas, M., Fernández-Palacios, J.M., 2005. Distribution of alien vs. native plant species in roadside communities along an altitudinal gradient in Tenerife and Gran Canaria (Canary Islands). Perspect. Plant Ecol. Evol. Syst. 7, 185–202. https://doi.org/10.1016/j. ppees.2005.09.003. Attorre, F., Francesconi, F., Taleb, N., Scholte, P., Saed, A., Alfo, M., Bruno, F., 2007. Will dragonblood survive the next period of climate change? Current and future potential distribution of Dracaena cinnabari (Socotra, Yemen). Biol. Conserv. 138, 430–439. https://doi.org/10.1016/j.biocon.2007.05.009. Booth, T.H., 2018. Species distribution modelling tools and databases to assist managing forests under climate change. . Ecol. Manag. 430, 196–203. https://doi.org/ 10.1016/j.foreco.2018.08.019. Boyce, M.S., Vernier, P.R., Nielsen, S.E., Schmiegelow, F.K.A., 2002. Evaluating resource selection functions mark. Ecol. Modell. 157, 281–300. https://doi.org/ 10.1016/S0304-3800(02)00200-4. Breiman, L., 2001. Random forests. Mach. Learn 45, 5–32. https://doi.org/10.1023/A:1010933404324. Brilhante, M., Varela, E., Essoh, A., Fortes, A., Duarte, M.C., Monteiro, F., Ferreira, V., Correia, A., Duarte, M., Romeiras, M.M., 2021. Tackling food insecurity in Cabo Verde Islands: the nutritional, agricultural and environmental values of the legume species. Foods 10, 206. https://doi.org/10.3390/foods10020206. Brochmann, C., Rustan, Ø.H., 2002. Additions to the vascular flora of Cabo Verde. Garcia Orta Ser. Bot. 16, 5–31. Brochmann, C., Rustan, Ø.H., Lobin, W., 1997. The endemic vascular plants of the Cape Verde Islands. W. Afr. Sommerfeltia 24, 1–356. Casajus, N., Périé, C., Logan, T., Lambert, M.-C., de Blois, S., Berteaux, D., 2016. An objective approach to select climate scenarios when projecting species distribution under climate change. PLoS One 11, e0152495. https://doi.org/10.1371/journal.pone.0152495. Castilla-Beltrán, A., de Nascimento, L., Fernández-Palacios, J.M., Whittaker, R.J., Willis, K.J., Edwards, M., Nogué, S., 2021a. Anthropogenic transitions from forested to human-dominated landscapes in southern Macaronesia. Proc. Natl. Acad. Sci. U. S. A. 118, e2022215118 https://doi.org/10.1073/pnas.2022215118. Castilla-Beltrán, A., de Nascimento, L., Fernández-Palacios, J.M., Whittaker, R.J., Romeiras, M.M., Cundy, A.B., Edward, M., Nogué, S., 2021b. Effects of Holocene climate change, volcanism and mass migration on the ecosystem of a small, dry island (Brava, Cabo Verde). J. Biogeogr. 1–14. https://doi.org/10.1111/ jbi.14084. Castilla-Beltrán, A., Duarte, I., de Nascimento, L., Fernández-Palacios, J.M., Romeiras, M.M., Whittaker, R.J., Jambrina-Enríquez, M., Mallol, C., Cundy, A., Edwards, A., Nogué, S., 2020. Using multiple palaeoecological indicators to guide biodiversity conservation in tropical dry islands: the case of São Nicolau, Cabo Verde. Biol. Conserv. 242, 108397 https://doi.org/10.1016/j.biocon.2019.108397. Chaluvadi, S.R., Young, P., Thompson, K., Bahri, B.A., Gajera, B., Narayanan, S., Krueger, R., Bennetzen, J.L., 2019. Phoenix phylogeny, and analysis of genetic variation in a diverse collection of date palm (Phoenix dactylifera) and related species. Plant Divers. 41, 330–339. https://doi.org/10.1016/j.pld.2018.11.005. Chang, X.-Y., Chen, B.-M., Liu, G., Zhou, T., Jia, X.-R., Peng, S.-L., 2015. Effects of climate change on plant population growth rate and community composition change. PLoS One 10, e0126228. https://doi.org/10.1371/journal.pone.0126228. CILSS - Comité Permanent Inter-états de Lutte contre la Sécheresse dans le Sahel, 2016. Landscapes of West Africa - A window on a changing world. U.S. Geological Survey EROS, Garretson, United States. https://doi.org/https://doi.org/10.5066/F7N014QZ. Costa, H., Aranda, S.C., Lourenço, P., Medeiros, V., Azevedo, E.B., Silva, L., 2012. Predicting successful replacement of forest invaders by native species using species distribution models: the case of Pittosporum undulatum and Morella faya in the Azores. . Ecol. Manag. 279, 90–96. https://doi.org/10.1016/j.foreco.2012.05.022. Costa, H., Foody, G.M., Jiménez, S., Silva, L., 2015. Impacts of species misidentification on species distribution modeling with presence-only data. ISPRS Int. J. Geo- Inf. 4, 2496–2518. https://doi.org/10.3390/ijgi4042496. Costa, H., Medeiros, V., Azevedo, E.B., Silva, L., 2013. Evaluating ecological-niche factor analysis as a modelling tool for environmental weed management in island systems. Weed Res. 53, 221–230. https://doi.org/10.1111/wre.12017. Cropper, T.E., Hanna, E., 2014. An analysis of the climate of Macaronesia, 1865-2012. Int. J. Climatol. 34, 604–622. https://doi.org/10.1002/joc.3710. Deblauwe, V., Droissart, V., Bose, R., Sonké, B., Blach-Overgaard, A., Svenning, J.C., Wieringa, B.R., Ramesh, T., Couvreur, T.L.P., 2016. Remotely sensed temperature and precipitation data improve species distribution modelling in the tropics. Glob. Ecol. Biogeogr. 25, 443–454. https://doi.org/10.1111/geb.12426. Dobson, A.J., Barnett, A.G., 2018. An Introduction to Generalized Linear Models, Fourth ed. CRC press, United States. Dou, J., Yunus, A.P., Tien Bui, D., Merghadi, A., Sahana, M., Zhu, Z., Chen, C.W., Khosravi, K., Yang, Y., Pham, B.T., 2019. Assessment of advanced random forest and decision tree algorithms for modeling rainfall-induced landslide susceptibility in the Izu-Oshima Volcanic Island, Japan. Sci. Total Environ. 662, 332–346. https://doi.org/10.1016/j.scitotenv.2019.01.221. Du, B., Kruse, J., Winkler, J.B., Alfarraj, S., Albasher, G., Schnitzler, J.-P., Ache, P., Hedrich, R., Rennenberg, H., 2021. Metabolic responses of date palm (Phoenix dactylifera L.) leaves to drought differ in summer and winter climate. Tree Physiol. 41, 1685–1700. https://doi.org/10.1093/treephys/tpab027. Duarte, M.C., Rego, F., Romeiras, M.M., Moreira, I., 2008. Plant species richness in the Cape Verde Islands - eco-geographical determinants. Biodivers. Conserv. 17, 453–466. https://doi.org/10.1007/s10531-007-9226-y. Dutra Silva, L., Costa, H., de Azevedo, E.B., Medeiros, V., Alves, M., Elias, R.B., Silva, L., 2017. Modelling native and invasive woody species: a comparison of ENFA and MaxEnt applied to the Azorean forest. Springer Proc. Math. Stat. 195, 415–444. https://doi.org/10.1007/978-3-319-55236-1_20. Dutra Silva, L., de Azevedo, E.B., Reis, F.V., Elias, R.B., Silva, L., 2019. Limitations of species distribution models based on available climate change data: a case study in the Azorean forest. Forests 10, 575. https://doi.org/10.3390/f10070575. D. Varela et al.
- 14. Global Ecology and Conservation 34 (2022) e02025 14 Dutra Silva, Elias, R.B., Silva, L., 2021. Modelling invasive alien plant distribution: a literature review of concepts and bibliometric analysis. Environ. Model. Softw. 145 (5), 105203 https://doi.org/10.1016/j.envsoft.2021.105203. Elith, J., Graham, C.H., Anderson, R.P., Dudík, M., Ferrier, S., Guisan, A., Hijmans, R.J., Huettmann, F., Leathwick, J.R., Lehmann, A., Zimmermann, N., 2006. Novel methods improve prediction of species’ distributions from occurrence data. Ecography 29, 129–151. https://doi.org/10.1111/j.2006.0906-7590.04596.x. Estrada-Contreras, I., Equihua, M., Laborde, J., Martínez Meyer, E., Sánchez-Velásquez, L.R., 2016. Current and future distribution of the tropical tree Cedrela odorata L. in Mexico under Climate Change Scenarios Using MaxLike. PLoS One 11, e0164178. https://doi.org/10.1371/journal.pone.0164178. Fernández-Palacios, J.M., De Nascimento, L., Otto, R., Delgado, J.D., García-Del-Rey, E., Arévalo, J.R., Whittaker, R.J., 2011. A reconstruction of Palaeo-Macaronesia, with particular reference to the long-term biogeography of the Atlantic island laurel forests. J. Biogeogr. 38, 226–246. https://doi.org/10.1111/j.1365- 2699.2010.02427.x. Ferrarini, A., Dai, J., Bai, Y., Alatalo, J.M., 2019. Redefining the climate niche of plant species: a novel approach for realistic predictions of species distribution under climate change. Sci. Total Environ. 671, 1086–1093. https://doi.org/10.1016/j.scitotenv.2019.03.353. Fick, S.E., Hijmans, R.J., 2017. WorldClim 2: new 1km spatial resolution climate surfaces for global land areas. Int. J. Climatol. 37, 4302–4315. https://doi.org/ 10.1002/joc.5086. Fischer, J., Stott, J., Law, B.S., 2010. The disproportionate value of scattered trees. Biol. Conserv. 143, 1564–1567. https://doi.org/10.1016/J.BIOCON.2010.03.030. Florencio, M., Patiño, J., Nogué, S., Traveset, A., Borges, P.A.V., Schaefer, H., Amorim, I.R., Arnedo, M., Ávila, S.P., Cardoso, P., de Nascimento, L., Fernández- Palacios, J.M., Gabriel, S.I., Gil, A., Gonçalves, V., Haroun, R., Illera, J.C., López-Darias, M., Martínez, A., Martins, G.M., Neto, A.I., Nogales, M., Oromí, P., Rando, J.C., Raposeiro, P.M., Rigal, F., Romeiras, M.M., Silva, L., Valido, A., Vanderpoorten, A., Vasconcelos, R., Santos, A.M.C., 2021. Macaronesia as a Fruitful Arena for ecology, evolution, and conservation biology. Front. Ecol. Evol. 9, 718169 https://doi.org/10.3389/fevo.2021.718169. Freitas, R., Romeiras, M.M., Silva, L., Cordeiro, R., Madeira, P., González, J.A., Wirtz, P., Falcón, J.M., Brito, A., Floeter, S.R., Afonso, P., Porteiro, F., Viera- Rodríguez, M.A., Neto, A.I., Haroun, R., Farminhão, J.N.M., Rebelo, A.C., Baptista, L., Melo, C.S., Martínez, A., Núñez, J., Berning, B., Johnson, M.E., Ávila, S.P., 2019. Restructuring of the ‘Macaronesia’ biogeographic unit: a marine multi-taxon biogeographical approach. Sci. Rep. 9, 1–18. https://doi.org/10.1038/s41598- 019-51786-6. GBIF.org, 2021. Global Biodiversity Information Facility. Available online at: 〈https://www.gbif.org/〉 (Accessed 26 January 2021). Gibbons, P., Lindenmayer, D.B., Fischer, J., Manning, A.D., Weinberg, A., Seddon, J., Ryan, P., Barrett, G., 2008. The future of scattered trees in agricultural landscapes. Conserv. Biol. 22, 1309–1319. https://doi.org/10.1111/J.1523-1739.2008.00997.X. Gros-Balthazard, M., Galimberti, M., Kousathanas, A., Newton, C., Ivorra, S., Paradis, L., Vigouroux, Y., Carter, R., Tengberg, M., Battesti, V., Santoni, S., Falquet, L., Pintaud, J.C., Terral, J.F., Wegmann, D., 2017. The discovery of wild date palms in Oman reveals a complex domestication history involving centers in the Middle East and Africa. Curr. Biol. 27, 2211–2218. https://doi.org/10.1016/j.cub.2017.06.045. Guisan, A., Edwards Jr, T.C., Hastie, T., 2002. Generalized linear and generalized additive models in studies of species distributions: setting the scene. Ecol. Modell. 157, 89–100. https://doi.org/10.1016/S0304-3800(02)00204-1. Guisan, A., Zimmermann, N.E., 2000. Predictive habitat distribution models in ecology. Ecol. Modell. 135, 147–186. https://doi.org/10.1016/S0304-3800(00)00354- 9. Hegel, T.M., Cushman, S.A., Evans, J., Huettmann, F., 2010. Current state of the art for statistical modelling of species distributions. In: Cushman, S.A., Huettmann, F. (Eds.), Spatial Complexity, Informatics, and Wildlife Conservation. Springer Japan, Tokyo, pp. 273–311. https://doi.org/10.1007/978-4-431-87771-4_16. Hernandez, P.A., Graham, C.H., Master, L.L., Albert, D.L., 2006. The effect of sample size and species characteristics on performance of different species distribution modeling methods. Ecography 29, 773–785. https://doi.org/10.1111/j.0906-7590.2006.04700.x. Hijmans, R.J., Etten, J. van, Sumner, M., Cheng, J., Baston, D., 2020. CRAN - Package raster. Available online at: 〈https://CRAN.R-project.org/package=raster〉 to link to this page. (Accessed 26 January 2021). Hirzel, A.H., Helfer, V., Metral, F., 2001. Assessing habitat-suitability models with a virtual species. Ecol. Modell. 145, 111–121. https://doi.org/10.1016/S0304-3800 (01)00396-9. Hirzel, A.H., Randin, C., Guisan, A., 2006. Evaluating the ability of habitat suitability models to predict species presences. Ecol. Modell. 9, 142–152. https://doi.org/ 10.1016/j.ecolmodel.2006.05.017. IDE-CV - Infra-Estrutura de Dados Espaciais de Cabo Verde, 2020. Dados Espaciais de Cabo Verde. Available online at: 〈https://idecv-ingt.opendata.arcgis.com/〉 (Accessed on 20 January 2021). IPCC - Intergovernmental Panel on Climate Change, 2018. Special Report - Global warming of 1.5◦ C. Available online at: 〈https://www.ipcc.ch/sr15/〉 (Accessed on 20 January 2021). Irl, S.D.H., Steinbauer, M.J., Messinger, J., Blume-Werry, G., Palomares-Martínez, Á., Beierkuhnlein, C., Jentsch, A., 2014. Burned and devoured-Introduced herbivores, fire, and the endemic flora of the high-elevation ecosystem on La Palma, Canary Islands. Arct. Antarct. Alp. Res. 46, 859–869. https://doi.org/ 10.1657/1938-4246-46.4.859. Jiménez-Valverde, A., 2012. Insights into the area under the receiver operating characteristic curve (AUC as a discrimination measure in species distribution modelling. Glob. Ecol. Biogeogr. 21, 498–507. https://doi.org/10.1111/j.1466-8238.2011.00683.x. Kaky, E., Gilbert, F., 2017. Predicting the distributions of Egypt’s medicinal plants and their potential shifts under future climate change. PLoS One 12, 1–19. https:// doi.org/10.1371/journal.pone.0187714. Lawal, S., Lennard, C., Hewitson, B., 2019. Response of southern African vegetation to climate change at 1.5 and 2.0◦ global warming above the pre-industrial level. Clim. Serv. 16, 100134 https://doi.org/10.1016/j.cliser.2019.100134. Leenaars, J.G.B., Claessens, L., Heuvelink, G.B.M., Hengl, T., Ruiperez González, M., van Bussel, L.G.J., Guilpart, N., Yang, H., Cassman, K.G., 2018. Mapping rootable depth and root zone plant-available water holding capacity of the soil of sub-Saharan Africa. Geoderma 324, 18–36. https://doi.org/10.1016/j. geoderma.2018.02.046. Lin, S., Jing, C., Coles, N.A., Chaplot, V., Moore, N.J., Wu, J., 2013. Evaluating DEM source and resolution uncertainties in the Soil and Water Assessment Tool. Stoch. Environ. Res. Risk Assess. 27, 209–221. https://doi.org/10.1007/s00477-012-0577-x. Lobin, W., Leyens, T., Santos, A., Neves, H.C., Gomes, I., 2005. The genus Sideroxylon (Sapotaceae) on the Madeira, Canary Islands and Cape Verde archipelagoes. Vieraea 33, 119–144. MAAP - Ministério do Ambiente Agricultura e Pescas, Direcção Geral do Ambiente, 2004. Livro Branco sobre o Estado do Ambiente em Cabo Verde. Available online at: 〈http://www.portaldoconhecimento.gov.cv/bitstream/10961/3831/1/Livro%20Branco%20Sobre%20o%20Estado%20do%20Ambiente%20em%20Cabo% 20Verde.pdf〉 (Accessed on 20 January 2021). Malagnoux, M., Sené, E., Atzmon, N., 2007. Bosques, árboles y agua en las tierras áridas: un equilibrio delicado. Unasylva 58, 24–29. Marmion, M., Parviainen, M., Luoto, M., Heikkinen, R.K., Thuiller, W., 2009. Evaluation of consensus methods in predictive species distribution modelling. Divers. Distrib. 15, 59–69. https://doi.org/10.1111/j.1472-4642.2008.00491.x. Márquez, A.L., Real, R., Olivero, J., Estrada, A., 2011. Combining climate with other influential factors for modelling the impact of climate change on species distribution. Clim. Change 108, 135–157. https://doi.org/10.1007/s10584-010-0010-8. Marrero, A., Almeida, R.S., 2012. A new subspecies, Dracaena draco subsp. caboverdeana Marrero Rodr. & R.Almeida (Dracaenaceae) from Cape Verde Islands. Int. J. Geobot. Res. 2, 35–40. https://doi.org/10.5616/ijgr120004. Mi, C., Huettmann, F., Guo, Y., Han, X., Wen, L., 2017. Why choose Random Forest to predict rare species distribution with few samples in large undersampled areas? Three Asian crane species models provide supporting evidence. PeerJ 5, e2849. https://doi.org/10.7717/peerj.2849. Mikoláš, M., Svitok, M., Tejkal, M., Leitão, P.J., Morrissey, R.C., Svoboda, M., Seedre, M., Fontaine, J.B., 2015. Evaluating forest management intensity on an umbrella species: capercaillie persistence in central Europe. For. Ecol. Manag. 354, 26–34. https://doi.org/10.1016/J.FORECO.2015.07.001. Monteiro, F., Fortes, A., Ferreira, V., Essoh, A.P., Gomes, I., M. Correia, A., Romeiras, M.M., 2020. Status and trends in Cabo Verde agriculture. Agronomy 10, 74. https://doi.org/10.3390/agronomy10010074. D. Varela et al.
- 15. Global Ecology and Conservation 34 (2022) e02025 15 Müller, H.M., Schäfer, N., Bauer, H., Geiger, D., Lautner, S., Fromm, J., Riederer, M., Bueno, A., Nussbaumer, T., Mayer, K., Alquraishi, S.A., Alfarhan, A.H., Neher, E., Al-Rasheid, K.A.S., Ache, P., Hedrich, R., 2017. The desert plant Phoenix dactylifera closes stomata via nitrate-regulated SLAC1 anion channel. New Phytol. 216, 150–162. https://doi.org/10.1111/nph.14672. Neto, C., Costa, J.C., Figueiredo, A., Capelo, J., Gomes, I., Vitória, S., Semedo, J.M., Lopes, A., Dinis, H., Correia, E., Duarte, M.C., Romeiras, M.M., 2020. The role of climate and topography in shaping the diversity of plant communities in Cabo Verde Islands. Diversity 12, 80. https://doi.org/10.3390/d12020080. Norder, S.J., Lima, R.F., De Nascimento, L., Lim, J.Y., Fernández-Palacios, J.M., Romeiras, M.M., Elias, R.B., Cabezas, F.J., Catarino, L., Ceríaco, L.M.P., Castilla- Beltrán, A., Gabriel, R., Menezes de Sequeira, M., Kissling, W.D., Nogué, S., Hall, M., van Loon, E.E., Rijsdijk, K., Matos, M., Borges, P.A.V., 2020. Global change in microcosms: environmental and societal predictors of land cover change on the Atlantic Ocean Islands. Anthropocene 30, 100242. https://doi.org/10.1016/j. ancene.2020.100242. Pearce, J.L., Boyce, M.S., 2006. Modelling distribution and abundance with presence-only data. J. Appl. Ecol. 43, 405–412. https://doi.org/10.1111/j.1365- 2664.2005.01112.x. Perrin, G., Rapinel, S., Hubert-Moy, L., Bioret, F., 2020. Bioclimatic dataset of Metropolitan France under current conditions derived from the WorldClim model. Data Br. 31, 105815 https://doi.org/10.1016/j.dib.2020.105815. Peterson, T., Ortega-Huerta, M., Bartley, J., Sánchez-Cordero, V., Soberón, J., Buddemeier, R.H., Stockwell, D.R.B., 2002. Future projections for Mexican faunas under global climate change scenarios. Nature 416, 626–629. https://doi.org/10.1038/416626a. POWO, 2021. Plants of the World Online. 〈http://powo.science.kew.org〉 (Accessed 02 July 2021). Prasad, A.M., Iverson, L.R., Liaw, A., 2006. Newer classification and regression tree techniques: bagging and random forests for ecological prediction. Ecosystems 9, 181–199. https://doi.org/10.1007/s10021-005-0054-1. Prevedello, J.A., Almeida-Gomes, M., Lindenmayer, D.B., 2018. The importance of scattered trees for biodiversity conservation: a global meta-analysis. J. Appl. Ecol. 55, 205–214. https://doi.org/10.1111/1365-2664.12943. R Development Core Team, 2020. R: A Language and Environment for Statistical Computing. R Foundation for Statistical Computing, Vienna (Accessed 20 January 2021). http://www.r-project.org/index.html. Ren-Yan, D., Xiao-Quan, K., Min-Yi, H., Wei-Yi, F., Zhi-Gao, W., 2014. The predictive performance and stability of six species distribution models. PLoS One 9, e112764. https://doi.org/10.1371/journal.pone.0112764. Rigby, R.A., Stasinopoulos, D.M., 2005. Generalized additive models for location, scale and shape. J. R. Stat. Soc. 54, 507–554. https://doi.org/10.1111/j.1467- 9876.2005.00510.x. Rivas-Martinez, S., Lousã, M., Costa, J.C., Duarte, M.C., 2017. Geobotanical survey of Cabo Verde Islands (West Africa). Int. J. Geobot. Res. 7, 1–103. Roberge, J.-M., Angelstam, P., 2004. Usefulness of the umbrella species concept as a conservation tool. Conserv. Biol. 18, 76–85. https://doi.org/10.1111/J.1523- 1739.2004.00450.X. Robinson, C., Schumacker, R.E., 2009. Interaction effects: centering, variance inflation factor, and interpretation issues. Mult. Linear Regres. Viewp. 35, 6–11. Romeiras, M.M., Catarino, L., Torrão, M.M., Duarte, M.C., 2011. Diversity and origin of medicinal exotic flora in Cape Verde Islands. Plant Ecol. Evol. 144, 214–225. https://doi.org/10.5091/plecevo.2011.560. Romeiras, M.M., Duarte, M.C., Santos-Guerra, A., Carine, M., Francisco-Ortega, J., 2014. Botanical exploration of the Cape Verde Islands: from the pre-Linnaean records and collections to late 18th century floristic accounts and expeditions. Taxon 63, 625–640. https://doi.org/10.12705/633.37. Romeiras, M.M., Catarino, S., Gomes, I., Fernandes, C., Costa, J.C., Caujapé-Castells, J., Duarte, M.C., 2016. IUCN Red List assessment of the Cape Verde endemic flora: towards a global strategy for plant conservation in Macaronesia. Bot. J. Linn. Soc. 180, 413–425. https://doi.org/10.1111/boj.12370. Romeiras, M.M., Monteiro, F., Duarte, M.C., Schaefer, H., Carine, M., 2015. Patterns of genetic diversity in three plant lineages endemic to the Cape Verde Islands. AoB Plants 7, 1–11. https://doi.org/10.1093/aobpla/plv051. Romeiras, M.M., Carine, M., Duarte, M.C., Catarino, S., Dias, F.S., Borda-de-Água, L., 2020. Bayesian methods to analyze historical collections in time and space: a case study using Cabo Verde Endemic Flora. Front. Plant Sci. 11, 1–12. https://doi.org/10.3389/fpls.2020.00278. Ronaghan, S., 2018. The Mathematics of Decision Trees, Random Forest and Feature Importance in Scikit-learn and Spark. 〈https://towardsdatascience.com/the- mathematics-of-decision-trees-random-forest-and-feature-importance-in-scikit-learn-and-spark-f2861df67e3〉 (Accessed 17 June 2020). Rudy, A.C.A., Lamoureux, S.F., Treitz, P., van Ewijk, K.Y., 2016. Transferability of regional permafrost disturbance susceptibility modelling using generalized linear and generalized additive models. Geomorphology 264, 95–108. https://doi.org/10.1016/j.geomorph.2016.04.011. Safronov, O., Kreuzwieser, J., Haberer, G., Alyousif, M.S., Schulze, W., Al-Harbi, N., Arab, L., Ache, P., Stempfl, T., Kruse, J., Mayer, K.X., Hedrich, R., Rennenberg, H., Salojärvi, J., Kangasjärvi, J., 2017. Detecting early signs of heat and drought stress in Phoenix dactylifera date palm. PLoS One 12, e0177883. https://doi.org/ 10.1371/journal.pone.0177883. Singer, A., Millat, G., Staneva, J., Kröncke, I., 2017. Modelling benthic macrofauna and seagrass distribution patterns in a North Sea tidal basin in response to 2050 climatic and environmental scenarios. Estuar. Coast. Shelf Sci. 188, 99–108. https://doi.org/10.1016/j.ecss.2017.02.003. Symon, C., 2013. Climate Change: Action, Trends and Implications for Business - The IPCC’s Fifth Assessment Report, Working Group 1. 〈https://www.cisl.cam.ac.uk/ system/files/documents/Science_Report__Briefing__WEB_EN.pdf〉 (Accessed 19 June 2020). Thomas, C.D., Gillingham, P.K., Bradbury, R.B., Roy, D.B., Anderson, B.J., Baxter, J.M., Bourne, N.A.D., Crick, H.Q.P., Findon, R.A., Fox, R., Hodgson, J.A., Holt, A.R., Morecroft, M.D., O’Hanlon, N.J., Oliver, T.H., Pearce-Higgins, J.W., Procter, D.A., Thomas, J.A., Walker, K.J., Walmsley, C.A., Wilson, R.J., Hill, J.K., 2012. Protected areas facilitate species’ range expansions. Proc. Natl. Acad. Sci. U. S. A. 109, 14063–14068. https://doi.org/10.1073/pnas.1210251109. Thuiller, W., Georges, D., Engler, R., Breiner, F., 2020. Package “biomod2”. Version 3.3–7. 〈https://cran.r-project.org/web/packages/biomod2/biomod2.pdf〉 (Accessed 02 June 2020). Thuiller, W., Lavergne, S., Roquet, C., Boulangeat, I., Lafourcade, B., Araujo, M.B., 2011. Consequences of climate change on the tree of life in Europe. Nature 470, 531–534. https://doi.org/10.1038/nature09705. Van Der Putten, W.H., Macel, M., Visser, M.E., 2010. Predicting species distribution and abundance responses to climate change: why it is essential to include biotic interactions across trophic levels. Philos. Trans. R. Soc. B Biol. Sci. 365, 2025–2034. https://doi.org/10.1098/rstb.2010.0037. Varela, D., Monteiro, F., Vidigal, P., Silva, L., Romeiras, M.M., 2020. Mechanisms implemented for the sustainable development of agriculture: an overview of Cabo Verde performance. Sustainability 12, 5855. https://doi.org/10.3390/su12145855. Varela-Lopes, G.E., Molion, L.C.B., 2014. Precipitation patterns in Cape Verde Islands: Santiago Island case study. Atmos. Clim. Sci. 4, 854–865. https://doi.org/ 10.4236/acs.2014.45075. Wisz, M.S., Hijmans, R.J., Li, J., Peterson, A.T., Graham, C.H., Guisan, A., Elith, J., Dudík, M., Ferrier, S., Huettmann, F., Leathwick, J.R., Lehmann, A., Lohmann, L., Loiselle, B.A., Manion, G., Moritz, C., Nakamura, M., Nakazawa, Y., Overton, J.M.C., Phillips, S.J., Richardson, K.S., Scachetti-Pereira, R., Schapire, R.E., Soberón, J., Williams, S.E., Zimmermann, N.E., 2008. Effects of sample size on the performance of species distribution models. Divers. Distrib. 14, 763–773. https://doi.org/10.1111/j.1472-4642.2008.00482.x. Wooldridge, J.M., 2008. Introductory Econometrics: A Modern Approach, Fourth ed. Thomson Southwestern Ohio. World Bank, 2018. The World Bank in Cabo Verde. 〈http://www.worldbank.org/en/country/caboverde/overview〉 (Accessed November 2020). Yobom, O., 2020. Climate change and variability: empirical evidence for countries and agroecological zones of the Sahel. Clim. Change 159, 365–384. https://doi. org/10.1007/s10584-019-02606-3. D. Varela et al.