SlideShare a Scribd company logo
1 of 88
Climate-driven declines in arthropod abundance
restructure a rainforest food web
Bradford C. Listera,1 and Andres Garciab
aDepartment of Biological Sciences, Rensselaer Polytechnic
University, Troy, NY 12180; and bEstación de Biología
Chamela, Instituto de Biología,
Universidad Nacional Autónoma de México, 47152 Chamela,
Jalisco, Mexico
Edited by Nils Christian Stenseth, University of Oslo, Oslo,
Norway, and approved September 10, 2018 (received for review
January 8, 2018)
A number of studies indicate that tropical arthropods should be
particularly vulnerable to climate warming. If these predictions
are
realized, climate warming may have a more profound impact on
the functioning and diversity of tropical forests than currently
anticipated. Although arthropods comprise over two-thirds of
terres-
trial species, information on their abundance and extinction
rates
in tropical habitats is severely limited. Here we analyze data on
arthropod and insectivore abundances taken between 1976 and
2012 at two midelevation habitats in Puerto Rico’s Luquillo
rainforest.
During this time, mean maximum temperatures have risen by
2.0 °C.
Using the same study area and methods employed by Lister in
the
1970s, we discovered that the dry weight biomass of arthropods
captured in sweep samples had declined 4 to 8 times, and 30 to
60 times in sticky traps. Analysis of long-term data on canopy
arthro-
pods and walking sticks taken as part of the Luquillo Long-
Term
Ecological Research program revealed sustained declines in
abun-
dance over two decades, as well as negative regressions of
abun-
dance on mean maximum temperatures. We also document
parallel
decreases in Luquillo’s insectivorous lizards, frogs, and birds.
While El
Niño/Southern Oscillation influences the abundance of forest
arthro-
pods, climate warming is the major driver of reductions in
arthropod
abundance, indirectly precipitating a bottom-up trophic cascade
and
consequent collapse of the forest food web.
climate warming | rainforest | food web | arthropods | bottom-up
cascade
From pole to pole, climate warming is disrupting the
biosphereat an accelerating pace. Despite generally lower rates
of
warming in tropical habitats (1), a growing body of theory and
data
suggests that tropical ectotherms may be particularly vulnerable
to
climate change (2). As Janzen (3) pointed out, tropical species
that
evolved in comparatively aseasonal environments should have
nar-
rower thermal niches, reduced acclimation to temperature
fluctu-
ations, and exist at or near their thermal optima. Consequently,
even small increments in temperature can precipitate sharp de-
creases in fitness and abundance. These predictions have been
verified in a variety of tropical reptiles, amphibians, and
inverte-
brates (4–8).
Given their abundance, diversity, and central roles as herbi-
vores, pollinators, predators, and prey, the response of arthro-
pods to climate change is of particular concern. Deutsch et al.
(5)
predicted that, for insects living at mid-to-high latitudes, rates
of
increase should grow as climate warms, while in the tropics in-
sects should decline by as much as 20%. Reduction in
population
growth, combined with elevated metabolic rates, could poten-
tially lower abundances and raise arthropod extinction rates. If
these predictions are realized, climate warming may have an
even more profound impact on the functioning and biodiversity
of the Earth’s tropical forests than currently anticipated.
Although arthropods comprise more than two-thirds of all
terrestrial species and are centrally important to the ecological
well-being of the Earth’s ecosystems, long-term data on pop-
ulation abundance and extinction rates are severely limited (9).
Studies documenting declines in insects have focused on tem-
perate species (10–13), and have identified climate warming,
along with habitat disturbance and insecticides, as primary
causal
mechanisms (9, 10). While demonstrated impacts of climate
change
on tropical forests include reductions in plant diversity (14),
changes
in plant species composition (15), and increases in tree growth,
mortality, and biomass (16), little is known about the impact of
climate warming on rainforest arthropods (17, 18). Here we
analyze
long-term data on climate change, arthropod abundance, and in-
sectivores within the Luquillo rainforest in northeastern Puerto
Rico, with the aim of determining if increases in ambient
temper-
ature may have driven reductions in arthropod numbers and
asso-
ciated decreases in consumer abundance.
Results
Climate Trends in the Luquillo Forest. Fig. 1 compares trends in
mean maximum yearly temperature (MnMaxT) for the El Verde
Field Station and Bisley Tower meteorological stations, both
located at an altitude of 350 m. Between 1978 and 2015,
MnMaxT at El Verde rose by 2.0 °C at an average rate of
0.050 °C per year. Between 1993 and 2015, the rate of temper-
ature increase at Bisley Tower was 0.055 °C per year, not sig-
nificantly different from the rate at El Verde.
As several authors have pointed out, increased exposure to
extreme temperatures may have a greater impact on fitness than
gradual increases in average temperatures (6, 19, 20). At El
Verde the proportion of maximum daily temperatures equal to
or exceeding 29.0 °C increased significantly between 1978 and
2015 (SI Appendix, Fig. S8E). At the Bisley station, the pro-
portion of maximum daily temperatures equal to or exceeding
29.0 °C grew steadily from the 1990s until 2015, with the pro-
portion averaging 0.03 for 1993–1994 and 0.44 for 2014–2015.
Significance
Arthropods, invertebrates including insects that have external
skeletons, are declining at an alarming rate. While the tropics
harbor the majority of arthropod species, little is known about
trends in their abundance. We compared arthropod biomass in
Puerto Rico’s Luquillo rainforest with data taken during the
1970s and found that biomass had fallen 10 to 60 times. Our
analyses revealed synchronous declines in the lizards, frogs,
and birds that eat arthropods. Over the past 30 years, forest
temperatures have risen 2.0 °C, and our study indicates that
climate warming is the driving force behind the collapse of the
forest’s food web. If supported by further research, the impact
of climate change on tropical ecosystems may be much greater
than currently anticipated.
Author contributions: B.C.L. and A.G. designed research;
B.C.L. and A.G. performed re-
search; B.C.L. and A.G. analyzed data; and B.C.L. wrote the
paper.
The authors declare no conflict of interest.
This article is a PNAS Direct Submission.
This open access article is distributed under Creative Commons
Attribution-NonCommercial-
NoDerivatives License 4.0 (CC BY-NC-ND).
1To whom correspondence should be addressed. Email:
[email protected]
This article contains supporting information online at
www.pnas.org/lookup/suppl/doi:10.
1073/pnas.1722477115/-/DCSupplemental.
Published online October 15, 2018.
www.pnas.org/cgi/doi/10.1073/pnas.1722477115 PNAS | vol.
115 | no. 44 | E10397–E10406
EC
O
LO
G
Y
http://www.pnas.org/lookup/suppl/doi:10.1073/pnas.172247711
5/-/DCSupplemental
http://crossmark.crossref.org/dialog/?doi=10.1073/pnas.1722477
115&domain=pdf
https://creativecommons.org/licenses/by-nc-nd/4.0/
mailto:[email protected]
http://www.pnas.org/lookup/suppl/doi:10.1073/pnas.172247711
5/-/DCSupplemental
http://www.pnas.org/lookup/suppl/doi:10.1073/pnas.172247711
5/-/DCSupplemental
www.pnas.org/cgi/doi/10.1073/pnas.1722477115
While average temperatures increased 8–10% over the same
period, the proportion of extreme temperatures increased 14
times.
Because data from the Bisley and El Verde stations record just
one maximum and minimum temperature per 24-h period, we
could not calculate the duration of time that temperatures
remained
above the 29 °C extreme. However, there was a significant
positive
linear regression of proportion of days per year when the tem-
perature equaled or exceeded 29 °C on MnMaxT at El Verde (SI
Appendix, Fig. S8K), suggesting that our measure reflects
signifi-
cant exposure to extremes rather than ephemeral spikes in tem-
perature (6, 20).
From 1975 to 2015, rainfall at the El Verde station averaged
3,653 mm/y with no significant positive or negative trends.
However,
the number of dry days (rainfall less than 1 mm) has been de-
creasing since 1975 (SI Appendix, Fig. S8G), while the
variation in
daily rainfall has been increasing (SI Appendix, Fig. S8H).
Over the
36-y time span encompassed by the data analyzed here, there
have
been five major hurricanes and eight severe droughts with two
outlier dry years, 1994 and 2015, when total rainfall was 1,404
mm
and 2,035 mm, respectively (21). These disturbances are all
asso-
ciated with La Niña and El Niño events (SI Appendix, Fig. S9).
Arthropods. Fig. 2 compares arthropod dry weight biomass cap-
tured per 100 sweeps for July 1976 and January 1977 in the
Luquillo forest study area (22), with our samples from July
2011 and 2012, and January 2012 and 2013. Compared with the
earlier samples, arthropod biomass for July 2011–2012 and
January 2012–2013 fell four and eight times, respectively. Fig.
3
shows that the declines in biomass occurred across all 10 of the
major taxa captured in the sweep samples (Fig. 3 A and B vs.
Fig.
3 C–E and F, respectively). A two-sample Kolmogorov–Smirnov
test indicated that the distributions of biomass proportions
across taxa were not significantly different between the two
sample periods (Kolmogorov–Smirnov z = 0.671, P = 0.759),
suggesting that all taxa declined proportionately.
Sticky-trap samples for the ground (Fig. 4A) and canopy (Fig.
4B)
were indicative of a collapse in forest arthropods. The catch rate
for
the ground traps fell 36 times, from 473 mg per trap per day in
July
1976 to 13 mg per trap per day in July 2012, and approximately
60 times, from 470 mg per trap per day to 8 mg per trap per day,
between January 1977 and January 2013. In July 1976, the
canopy
trap catch rate was 37 mg per trap per day compared with 5 mg
per
trap per day in July 2012, and 21 mg per trap per day in January
1976 vs. 8 mg per trap per day in January 2013.
Analysis of Schowalter’s (23) canopy data also revealed sig-
nificant decreases in invertebrate abundance, scaled with
respect
to foliage weight sampled between 1990 and 2010 (Fig. 5A),
and
a significant, nonlinear decline with increasing temperature
(Fig.
5B). In keeping with our sweep net results, all 10 of the most-
abundant canopy taxa exhibited negative trends in abundance
between 1990 and 2010. The binomial probability of this pattern
occurring by chance alone is 0.00097. Employing Willig et al.’s
(24) census data, we also conducted quasi-Poisson regressions
of
walking stick abundance against time and against MnMaxT
during the census periods (Fig. 5 C and D). Both regressions
were
negative and significant.
During a previous study (25), we sampled arthropods within a
tropical dry forest in the Chamela-Cuixmala Biosphere Reserve
in
western Mexico using the same sticky-trap methods employed at
Luquillo. Since 1981, the Chamela-Cuixmala Biosphere Reserve
has experienced a 2.4 °C increase in average annual air
tempera-
ture, from 24.5 °C in 1981 to 26.9 °C in 2014 (SI Appendix,
Fig. S1).
We returned to the Chamela forest in August 2014 to repeat our
original samples within the same study area. Overall, we found
an
eightfold decrease in the dry-weight biomass of arthropods
captured
per day in ground traps in 2014 compared with the average for
July
1987 and July 1988 (SI Appendix, Fig. S2).
Insectivores. Given these declines in arthropod resources,
parallel
declines in insectivore abundances would be expected. The
dominant insect predators within the Luquillo rainforest are
anoline lizards, eleutherodactylid frogs, and birds (26). Here we
analyze changes in abundance through time for forest-dwelling
anoles, the most common forest frog, Eleutherodactylus coqui,
and the bird community near the El Verde Field Station.
Anoles. Within our Luquillo study area, the most common
anoles
during 1976–1977 were Anolis gundlachi, Anolis evermanni,
and
Anolis stratulus (22). In 2011 and 2012, we censused anoles
within the same 225-m2 study area using the Schnabel method
(27) employed in 1976/1977 by Lister (22). Average density of
anoles in 2011–2012 had decreased ∼2.2 times compared with
1976–1977, from an estimated 12,490–5,640 anoles per hectare.
Mean anole biomass within the study area dropped 32%, from
401 g to 277 g (Fig. 6 and SI Appendix, Table S1). The density
of
A. gundlachi, the most common species, had dropped twice, and
the density of A. evermanni declined 10 times. A. stratulus,
with a
Fig. 1. Air temperature trends within the Luquillo forest.
MnMaxT vs. year
for the (A) El Verde (1978–2015) and (B) Bisley Tower (1994–
2012) meteo-
rological stations. The stations are ∼8.2 km apart at elevations
of 350 and
352 m, respectively. The least-squares regression lines have
been drawn
through the data points. The difference between the slopes of
the two re-
gression lines is not significant (t = 0.281, P = 0.78).
Fig. 2. Mean dry-weight arthropod biomass per 100 sweeps
taken in the
same sample area in the Luquillo rainforest during July 1976,
January 1977,
July 2011, and January 2013. One SE around the mean biomass
is shown for
each bar. Total sweeps taken in each period was 800, except for
July 1976,
when 700 sweeps were taken. Data for 1976 and 1977 are from
Lister (22).
E10398 | www.pnas.org/cgi/doi/10.1073/pnas.1722477115
Lister and Garcia
http://www.pnas.org/lookup/suppl/doi:10.1073/pnas.172247711
5/-/DCSupplemental
http://www.pnas.org/lookup/suppl/doi:10.1073/pnas.172247711
5/-/DCSupplemental
http://www.pnas.org/lookup/suppl/doi:10.1073/pnas.172247711
5/-/DCSupplemental
http://www.pnas.org/lookup/suppl/doi:10.1073/pnas.172247711
5/-/DCSupplemental
http://www.pnas.org/lookup/suppl/doi:10.1073/pnas.172247711
5/-/DCSupplemental
http://www.pnas.org/lookup/suppl/doi:10.1073/pnas.172247711
5/-/DCSupplemental
http://www.pnas.org/lookup/suppl/doi:10.1073/pnas.172247711
5/-/DCSupplemental
http://www.pnas.org/lookup/suppl/doi:10.1073/pnas.172247711
5/-/DCSupplemental
www.pnas.org/cgi/doi/10.1073/pnas.1722477115
density in the 1970s of 200 individuals per hectare, had dis-
appeared from the interior forest, edge habitats, and other reg-
ularly visited habitats lying within 4 km to the east and west of
the study area.
E. coqui. We conducted quasi-Poisson regressions of E. coqui
counts vs. time for censuses conducted at El Verde (Fig. 7 A
and
B) by Stewart (28), and at El Verde (SI Appendix, Fig. S3 A
and
B) and the Bisley watershed (SI Appendix, Fig. S3 C and D) by
Woolbright (29, 30). Data from Woolbright’s El Verde study
area were previously analyzed to investigate the impact of Hur-
ricane Hugo on Luquillo frogs (29, 30). Here we present an
analysis and interpretation. To our knowledge, no analyses of
the
Bisley data have been previously published.
The quasi-Poisson regressions of E. coqui numbers vs. time
and MnMaxT for Stewart’s Activity Transect were both
negative
and significant (Fig. 7 A and B) (28). The regressions of E.
coqui
numbers vs. time and temperature for the Sonadura West study
area were also negative and significant (SI Appendix, Fig.
S3A).
For the Sonadura Old population, only the regression of num-
bers on time was significant (P = 0.013), while the regression of
abundance on temperature was marginally insignificant (P =
0.067). Because no climate data were taken at the Bisley Tower
until 1993, we were unable to conduct regression analyses of E.
coqui numbers vs. temperature for the Bisley Stream and Bisley
forest study areas. Regressions on time were both negative and
significant (SI Appendix, Fig. S3 C and D).
The temporal pattern of E. coqui abundances in Woolbright’s
(29, 30) El Verde study area (SI Appendix, Fig. S3B) departs
from the monotonic, negative trends found in the other E. coqui
populations, and required a segmented regression consisting of
three phases. In the first phase, E. coqui numbers had a signifi-
cant negative trend followed by a rapid increase during phase
2 from 6 to 57 individuals between January and October 1990,
most likely due to immigration from surrounding areas
following
Hurricane Hugo. In phase 3, the population resumed a steady
decline at about the same rate as phase 1, until the census ended
6 y later. The rapid return to the preperturbation rate of decline
suggests the ongoing influence of climate change on birth and
death rates.
Birds. To explore trends in avian abundance, we analyzed mist
netting data taken near the El Verde Field Station by Waide (31)
from 1990 to 2015, an analysis that had not been previously
published. As Fig. 7C shows, under the same yearly sampling
effort there was a significant decline in total insectivorous birds
captured per year between 1990 and 2005, with captures falling
53% from a high of 137 birds in 1990 to 64 birds in 2005.
During
this period, seven of the eight most common bird species at El
Verde experienced reductions in numbers. The quasi-Poisson
regression of insectivorous birds caught per year on MnMaxT
during the period of sampling was also negative and significant
(Fig. 7D).
If the declines in arthropod resources negatively impact avian
abundance, then species with primarily granivorous or
frugivorous
diets should suffer smaller declines than those consuming a
greater
proportion of insects. For example, the ruddy quail dove
(Geotrygon
montana), which eats grains and fruits almost exclusively,
showed no
decline in abundance between 1990 and 2015 at El Verde, while
Todus mexicanus, the Puerto Rican tody, whose diet is
composed
entirely of insects (26), experienced a 90% reduction in catch
rate.
Using data on diets of Puerto Rican birds (26) and a Theil-Sen
nonparametric regression, we found that for six common species
the relative decline in catch rate compared with G. montana in-
creased significantly with an increase in the proportion of
insects in
their diet (SI Appendix, Fig. S4).
Hierarchical Partitioning, Multiple Regression, and Cross-
Correlation
Analyses. To go beyond univariate regressions of population
abun-
dance on ambient temperature, we constructed multiple quasi-
Poisson regressions using independent variables identified by a
hier-
archical partitioning (HP) analysis (32, 33). Given a set of
predictors,
HP averages the effect of each predictor on goodness of fit
measures
over all possible 2K regression models, where “K” is the
number of
predictors (34, 35). This averaging alleviates the effects of
multi-
collinearity and allows the explanatory impact of a given
variable to
be partitioned into an effect that depends only on the predictor
itself
and a joint effect shared with one or more other predictors. For
each
predictor, independent and joint effects are expressed as a
percent of
the total deviance explained. Variables with large independent
effects
are more likely to be causal than variables with small
independent
effects (33, 34). Hence, the technique is not designed to build
an
optimal predictive model, but to complement the model building
process by revealing potential explanatory/causal relationships
be-
tween a dependent variable and a set of predictors.
Fig. 4. Comparison of the average dry-weight biomass of
arthropods
caught per 12-h day in 10 ground (A) and canopy (B) traps
within the same
sampling area in the Luquillo rainforest. Numbers above the
bars give the
mean daily catch rate in dry weight of arthropods per day for
the respective
dates. Data for 1976 and 1977 are from Lister (22).
Fig. 3. Comparison of total dry-weight biomass for the major
arthropod
taxa captured in sweep samples taken during the summer (A, C,
and E) and
winter (B, D, and F) seasons 1976–1977 and 2011–2013, within
the same
Luquillo forest study area. Arn, Areneida; Col, Coleoptera; Dip,
Diptera; For,
Formicidae; Hem, Hemiptera; Hom, Homoptera; Hym, other
Hymenoptera;
La, Lepidoptera adults; LI, Lepidoptera larvae; Ort, Orthoptera.
Lister and Garcia PNAS | vol. 115 | no. 44 | E10399
EC
O
LO
G
Y
http://www.pnas.org/lookup/suppl/doi:10.1073/pnas.172247711
5/-/DCSupplemental
http://www.pnas.org/lookup/suppl/doi:10.1073/pnas.172247711
5/-/DCSupplemental
http://www.pnas.org/lookup/suppl/doi:10.1073/pnas.172247711
5/-/DCSupplemental
http://www.pnas.org/lookup/suppl/doi:10.1073/pnas.172247711
5/-/DCSupplemental
http://www.pnas.org/lookup/suppl/doi:10.1073/pnas.172247711
5/-/DCSupplemental
http://www.pnas.org/lookup/suppl/doi:10.1073/pnas.172247711
5/-/DCSupplemental
http://www.pnas.org/lookup/suppl/doi:10.1073/pnas.172247711
5/-/DCSupplemental
Using the nine climate-related variables listed in SI Appendix,
Table S3 as independent variables, and abundance as the de-
pendent variable, we conducted HP analyses for the three E.
coqui
populations, the canopy arthropods, walking sticks, and the El
Verde birds. Results are shown in SI Appendix, Fig. S5.
MnMaxT
had considerably greater independent explanatory power than
any
of the other variables. Across all six populations, the average
in-
dependent effect of MnMaxT on abundance was 25%, while the
averages for four other temperature related variables ranged
from
11.4 to 14.3%. The independent explanatory power of average
daily
rainfall was highest in the E. coqui and walking stick
populations
(9.8–24.4%). The Southern Oscillation Index (SOI) also
emerged as
an impactful, potentially causal factor with independent effects
ranging from 10.2 to 17.3% in two of the three E. coqui
populations,
the walking stick population and the canopy arthropods.
The final multiple quasi-Poisson regressions, with supporting
statistics, are given in SI Appendix, Table S5. For the El Verde
birds,
none of the variables in SI Appendix, Table S3 were significant
once
MnMaxT was entered into the model. Notably, the multivariate
models for the three E. coqui populations and the walking stick
population all contained MnMaxT and PropGT29 (proportion of
days per year when daily temperature exceeds 29 °C) as major
predictors. Multiple regressions for the El Verde E. coqui and
walking stick populations also included the SOI as a significant
predictor of abundance (SI Appendix, Table S5).
To further analyze the effect of El Niño/Southern Oscil-
lation (ENSO) on arthropod populations, we conducted
cross-correlation analyses between the SOI and the abundances
of canopy invertebrates and walking sticks (SI Appendix, Fig.
S6).
For the canopy invertebrates, there is a significant (P < 0.05)
positive cross-correlation with the SOI at a time lag of 0. This
indicates that positive SOI values (La Niña episodes) have an
immediate positive impact on the abundance of canopy inver-
tebrates, and negative SOI values (El Niño episodes) have an
immediate negative impact. There is also a significant negative
cross-correlation at a negative 5-y time lag, indicating that
higher
abundances precede El Niño events and lower abundances pre-
cede La Niña events, as would be expected. For walking sticks,
there is also a significant positive cross-correlation between
abundance and the SOI, again indicating that higher and lower
values of the SOI lead to higher and lower abundances re-
spectively. However, for walking sticks, the ENSO events pre-
cede the impact on population abundance by approximately 2 y.
Vinod Causality. Regression and correlation analyses inevitably
leave
the issue of causality open to question (33, 34). In lieu of
intractable
experiments spanning large spatial and temporal scales, Vinod
causality offers a statistical method that can help identify causal
variables and reveal the direction of causal paths (36). Vinod’s
generalized correlation and kernel causality methods (37, 38)
im-
prove and extend earlier attempts to discern causal paths
between
two or more variables, including those of Granger (39), Pearl
(40),
and Hoyer et al. (41). With a success rate of 70–75%, Vinod’s
methods are the most accurate to date in terms of correctly iden-
tifying causality in the CauseEffectPairs benchmark database
(42).
Here we explore the evidence that temperature is the causal
agent
affecting abundance using Vinod’s generalCorr R package.
Given an xy dataset, generalCorr calculates a unanimity index
(UI) that quantifies the likelihood that either x or y is causal.
This index will always lie in the range [−100, 100]. If all three
of
Vinod’s causality criteria are met, then the UI will have an ab-
solute value of 100, signifying the strongest evidence for the
causality of a given variable. Three decision rules based on the
value of the UI determine the direction of the causal path. If
the UI lies in the interval [−100, −15], then y causes x, and if
UI
Fig. 5. Trends in the abundance of canopy arthropods and
walking sticks in
the Luquillo forest El Verde study area. (A) Linear regression
of the total
number of canopy arthropods captured per foliage weight
sampled at El
Verde against the period when the samples were taken. (B)
Cubic regression
for the total number of canopy arthropods captured per foliage
weight
sampled against the MnMaxT during the period when the
samples were
taken. (C) Quasi-Poisson regression of total number of walking
sticks vs. the
period when the population was sampled. (D) Quasi-Poisson
regression of
total number of walking sticks vs. the MnMaxT during the
period when the
population was sampled. The 95% confidence intervals are
shown around
the best-fit regression lines. For the Poisson regressions, Pr(χ)
is the result of
a likelihood-ratio χ2 test of whether the independent variable
improves the
Poisson model beyond an intercept-only model. P < 0.05
indicates a statis-
tically significant regression.
Fig. 6. Comparison of anoles censuses conducted in the same
Luquillo
rainforest study area during July 1976 and January 1977, with
censuses
conducted during July 2011 and January 2012. The total number
of anoles in
each census, estimated by the Schnabel multiple capture–
recapture method
(27), is given above each histobar. Brown represents male and
female A.
gundlachi. Green represents A. evermanni. Gray represents A.
stratulus. SI
Appendix, Table S1 gives the 95% confidence intervals around
estimated
abundances for A. gundlachi and A. evermanni.
E10400 | www.pnas.org/cgi/doi/10.1073/pnas.1722477115
Lister and Garcia
http://www.pnas.org/lookup/suppl/doi:10.1073/pnas.172247711
5/-/DCSupplemental
http://www.pnas.org/lookup/suppl/doi:10.1073/pnas.172247711
5/-/DCSupplemental
http://www.pnas.org/lookup/suppl/doi:10.1073/pnas.172247711
5/-/DCSupplemental
http://www.pnas.org/lookup/suppl/doi:10.1073/pnas.172247711
5/-/DCSupplemental
http://www.pnas.org/lookup/suppl/doi:10.1073/pnas.172247711
5/-/DCSupplemental
http://www.pnas.org/lookup/suppl/doi:10.1073/pnas.172247711
5/-/DCSupplemental
http://www.pnas.org/lookup/suppl/doi:10.1073/pnas.172247711
5/-/DCSupplemental
http://www.pnas.org/lookup/suppl/doi:10.1073/pnas.172247711
5/-/DCSupplemental
http://www.pnas.org/lookup/suppl/doi:10.1073/pnas.172247711
5/-/DCSupplemental
www.pnas.org/cgi/doi/10.1073/pnas.1722477115
is in the interval [15, 100] then x causes y. If the UI lies within
the
range [−15, 15], the causal direction is indeterminate.
SI Appendix, Table S4 summarizes the outcome of the gen-
eralCorr analyses of causation. The unanimity indices equaled
100 in five of the six groups, indicating that the causal path
Temperature → Abundance is supported by all three of Vinod’s
criteria for causality. Inclusion of mean daily rainfall as a cova-
riate improved the UI for all analyses except for walking sticks,
which had a UI of 100 without the covariate, and for the E.
coqui
at the Sonadura Old study site, which retained a low UI and
indeterminate causal path with and without the covariate.
Discussion
Climate Change and Arthropods. Based on 14 y of light-trap
data
within a Panamanian rainforest, Wolda (43) observed that the
stability of tropical insects varied considerably. He concluded
that this result reflected the absence of a “dominant environ-
mental process” affecting many species simultaneously. We
sug-
gest that climate warming has emerged as such a dominant force
affecting arthropod populations in the Luquillo forest and, most
likely, in other tropical forests experiencing significant
increases
in ambient temperature.
Several lines of evidence support this hypothesis. First, from a
single species of walking stick to a community of over 120
canopy
taxa, long-term declines have occurred in parallel with rising
temperatures. Average ambient temperature is also a significant
predictor of changes in the abundance of canopy invertebrates
and walking sticks. Second, the simultaneous declines of all
10 arthropod taxa in our sweep samples, the 10 most-abundant
taxa in Schowalter’s (23) canopy samples, and arthropods occu-
pying all strata of our forest study area, all point to an
overriding
environmental factor that has had ubiquitous, adverse effects on
forest arthropods regardless of taxonomic affiliation, stratum
occupied, or type of niche exploited. Third, declines in
arthropod
abundance have occurred despite major decreases in their preda-
tors. This “counter cascade” conflicts with decades of research
on
trophic dynamics (44), as well as studies documenting the major
impact of anoles, frogs, and birds on arthropod abundance (45,
46).
Stewart and Woolbright (47), for example, estimated the E.
coqui
population alone harvested 114,000 prey items per hectare per
night
in the Luquillo forest, and Reagan and Waide (26) calculated
that
A. stratulus, A. gundlachi, and A. evermanni collectively
consumed
∼443,300 invertebrates per hectare per day at El Verde. If
climate
warming is not driving arthropod declines, then whatever the
factors
may be, they must completely override the reduction in
mortality
from lowered predation levels. Fourth, our analyses are in
keeping
with predictions of Deutsch et al. (5) that tropical insects
should be
especially vulnerable to climate warming, adding to field and
lab-
oratory studies over the past several years that have consistently
supported the predicted sensitivity (8, 48–53). Finally, our
arthro-
pod samples from the Chamela-Cuixmala reserve in Mexico add
support to our hypothesis that climate warming is having a
serious
negative impact on invertebrate populations in tropical forests.
Other studies have also documented declines in arthropod
abundance across a broad range of geography, habitats, and taxa
(10–12, 54, 55, 56–58). Research on causal factors has focused
on
anthropogenic disturbance and pesticides (57, 58). Given its
long-
term protected status (59), significant human perturbations have
been virtually nonexistent within the Luquillo forest since the
1930s,
and thus are an unlikely source of invertebrate declines. Due to
the
ongoing reduction in agriculture and associated farmland,
pesticides
use in Puerto Rico also fell up to 80% between 1969 and 2012
(SI
Appendix, Fig. S7). Most pesticides have half-lives measured in
days,
not decades (60), making it improbable that, despite precipitous
declines in their use, remaining residues are responsible for
waning
arthropod abundance. Recently, Hallman et al. (61) published an
extensive analysis of long-term data on the biomass of flying
insects
sampled at 63 protected reserves in Germany. Overall, they
found a
75% decline in biomass between 1989 and 2016. Their
statistical
models largely eliminated land-use change as an explanatory
vari-
able but did not thoroughly analyze a number of climate-change
variables. Increases in average temperature had a positive
influence
on insect biomass, an effect predicted by Tewksbury et al. (62)
for
temperate insects. However, the reasons for the alarming losses
in
insect biomass are currently unknown and, of course, may differ
from causal agents in tropical habitats.
Anolis Population Declines. Long-term abundance data taken by
Pounds et al. (63), Whitfield et al. (4), and Stapley et al. (20)
indicate that Anolis populations in other tropical forests have
declined in parallel with anoles at Luquillo. At Monteverde,
Costa Rica, populations of Anolis tropidolepis and Anolis altae
were diminishing by 4.4% and 3.1% per year, respectively, for
11 and 13 y before both species became locally extinct. Over a
35-y
period at La Selva, Costa Rica, Anolis capito, Anolis humilis,
and
Anolis apletophallus decreased by 23%, 78%, and 71%,
respectively
(3), and in the rainforest on Barro Colorado Island, Panama, A.
apletophallus abundance declined by 71% between 1971 and
2011
(19). Proposed drivers of these trends were reduced mist
frequency
at Monteverde, diminished leaf litter due to climate change at
La
Selva, and the effects of the ENSO combined with a rise in
mini-
mum temperatures on Barro Colorado.
Estimated rates of decline for Anolis populations at Luquillo,
Monteverde, La Selva, and Barro Colorado are given in SI Ap-
pendix, Table S2. All of these species are nonbasking, thermal-
conforming forest inhabitants (6). In a macrophysiological and
focal species analysis of Puerto Rican anoles and other lizards
Fig. 7. Population trends for E. coqui and birds near the El
Verde Field
station. (A) Quasi-Poisson regression of estimated total number
of E. coqui
individuals against time from censuses conducted by Stewart
(28) in the
Activity Transect. (B) Quasi-Poisson regression of the
estimated number of E.
coqui individuals against MnMaxT during the time periods
when Stewart’s
censuses were conducted. (C) Quasi-Poisson regression for the
total number
of birds captured during equal length, 4-d sessions of mist
netting (31) near
the El Verde Field Station against the period when the mist
netting was
conducted. (D) Quasi-Poisson regression of the total number of
birds cap-
tured during Waide’s (31) 4-d sessions vs. MnMaxT during the
year of mist
netting. The 95% confidence intervals are shown around the
best-fit re-
gression lines. Pr(χ) is the result of a likelihood-ratio χ2 test of
whether the
independent variable improves the model beyond an intercept-
only model.
P < 0.05 indicates a statistically significant regression.
Lister and Garcia PNAS | vol. 115 | no. 44 | E10401
EC
O
LO
G
Y
http://www.pnas.org/lookup/suppl/doi:10.1073/pnas.172247711
5/-/DCSupplemental
http://www.pnas.org/lookup/suppl/doi:10.1073/pnas.172247711
5/-/DCSupplemental
http://www.pnas.org/lookup/suppl/doi:10.1073/pnas.172247711
5/-/DCSupplemental
http://www.pnas.org/lookup/suppl/doi:10.1073/pnas.172247711
5/-/DCSupplemental
http://www.pnas.org/lookup/suppl/doi:10.1073/pnas.172247711
5/-/DCSupplemental
from 12 neotropical locations, Huey et al. (6) proposed that
thermal-conforming lizards inhabiting shaded tropical forests
should be especially vulnerable to climate warming. This vul-
nerability results from lower critical thermal maxima than
basking species, limited acclimation via thermoregulation, and
reduced thermal safety margins. As ambient temperatures in-
crease, thermal stress can lead to extinction by lowering per-
formance, restricting activity time, and lessening food intake. In
an encompassing study spanning local extinctions of lizard pop-
ulations on five continents, Sinervo et al. (7) reached broadly
similar conclusions for baskers and thermal-conformers in tem-
perate and tropical habitats.
In the Huey et al. (6) and Sinervo et al. (7) hypotheses, rising
ambient temperatures indirectly lower food intake via changes
in
thermoregulatory behavior, while we propose that reduced con-
sumption and declines in abundance result directly from
climate-
driven declines in food abundance. Although the mechanisms
differ,
the results are the same. As climate warms, lizards should in-
creasingly become nutritionally challenged, resulting in reduced
body condition, growth rates, egg production, fat body mass,
phys-
ical performance, and immune system response. Consequently,
death rates from starvation, predation, and disease should
increase
along with concomitant decreases in reproduction.
Eleutherodactylus Declines. Decreases in Puerto Rico’s
Eleuther-
odactylus populations began in the 1970s, with three species
classified as threatened by 1985 (64). Stewart’s data (28), doc-
umenting the collapse of E. coqui, was also an early warning
sign
of negative trends in Puerto Rican frogs. Currently, 3 of the
original 16 species of Puerto Rican Eleutherodactylus are con-
sidered extinct, and 13 species are listed as critically
endangered,
endangered, vulnerable, or near threatened (65). The monolithic
pattern of rapid declines of E. coqui populations shown in Fig.
7A and SI Appendix, Fig. S3, when extrapolated, suggest their
extinctions may be imminent by 2030–2040.
The ongoing losses of anuran biodiversity on Puerto Rico and
other West Indian islands (66, 67) are part of a global
amphibian
decline that has continued largely unabated since at least the
1970s (68–72). To our knowledge, no studies have explored re-
ductions in arthropod prey as a possible causal mechanism.
Most
research has focused on the fungus Batrachochytrium den-
drobatidis, which has precipitated mass-mortality events and
catastrophic reductions in over 200 frog species world-wide (63,
73, 74). While B. dendrobatidis has been detected in E. coqui
populations at higher elevations in Puerto Rico (66, 75), the
fungus is restricted to areas above 600 m (76) and, at present,
there is no evidence that it has impacted the lower elevation E.
coqui populations analyzed in this study.
Pounds and coworkers (63, 73, 77–79) have presented a wide-
ranging body of evidence indicating that climate warming is a
central factor promoting outbreaks of Batrachochytrium and the
mass die-offs that follow. The relationship between chytrid out-
breaks and climate is complex, but in general epidemics are
often
associated with repeated warm years and drier weather. Given
ongoing climate change, the elevational range of
Batrachochytrium
will almost certainly change, as well as its impact on Puerto
Rican
frogs, especially juveniles (80). The key to understanding future
impacts lies at the intersection of a changing climate with the
spe-
cific temperature- and moisture-related physiological
limitations of
the fungus, and how these constraints in turn affect its
reproduction
(81, 82).
Based on our literature searches, no studies have explored re-
ductions in arthropod prey as a possible causal mechanism
behind
amphibian declines, nor the possibility that malnutrition could
in-
teract with rising temperature and drought, compounding the
im-
pacts of disease through depression of immunocompetence (83).
Avian Declines. Bird populations in many tropical and
temperate
ecosystems have been declining in parallel with those in Puerto
Rico. In Canada, 44% of 460 bird species have had negative
trends since 1970, and 42 species common to the United States,
Canada, and Mexico have lost 50% or more of their populations
in 40 y (84). Over a 20-y period, 54% of bird species native to
Britain have also decreased (55). In the rainforest at La Selva,
Costa Rica, 10–20% of resident birds declined between 1960
and
1999 (85), and in the Guanica dry forest in southwestern Puerto
Rico mist-net data indicate that dry season bird populations
dropped by two-thirds over two decades (86).
Common drivers of plummeting bird populations mentioned in
the literature are habitat loss, effects of temperature on
reproduction
(87–89), water stress (90), increased predation (91, 92), a
disconnect
between rates of climate change and climate tracking (93), mis-
matches between breeding period and prey abundance (94), and
atmospheric pollutants and insecticides (95). For farmland birds
in
Europe, reduction in prey due to herbicides, plowing, and loss
of
marginal habitats (96) appear to be major factors. We found
only two
articles that ascribed the collapse of avian populations to the
impact
of climate warming on prey abundance. Pearce-Higgins et al.
(97)
analyzed the demographics of the golden plover in Europe and
showed that trends in population dynamics were closely
associated
with temperature-based reductions in prey abundance. Pearce-
Higgins et al. (97) also analyzed the diets of 17 upland, insec-
tivorous bird species in the United Kingdom, calculated a
climate-
sensitivity index for their prey, and showed that the index was
correlated with recent negative population trends. In the forests
of
Victoria, Australia, Mac Nally et al. (98) documented major
declines
in the resident avifauna regardless of spatial scale, disturbance
level,
species conservation status, or foraging guild. They attributed
the
ongoing declines to the impact of increasing temperatures and
decreasing rainfall on arthropods and other food resources.
We also note that in many studies of passerine declines, such
as Mac Nally et al. (98), insectivores are often the group exhib-
iting the largest decreases in abundance, as appears to be the
case in the Luquillo forest. In Canada and the northeastern
United States, the total reduction in aerial insectivores between
1970 and 2010 was greater than 60%, the largest decline of all
passerines analyzed (84, 99). Nebel et al. (100) concluded that
these declines resulted from impoverishment of flying insect
populations, and suggested acid rain as a possible mechanism.
Between 1923 and 1998 in Singapore, insectivores experienced
the highest level of extinctions of any foraging guild (101), and
in
fragmented forests in Costa Rica and Brazil, insectivores suf-
fered greater declines and local extinctions than other avian
groups (102–104). In a lowland tropical rainforest at La Selva,
Costa Rica, Sigel et al. (85) also found that at least 50% of de-
clining bird species were insectivorous.
Given decades of research linking avian survivorship, reproduc-
tion, and abundance to food resources (105–107), the paucity of
studies on climate-related reductions in arthropod prey is
surpris-
ing. Galapagos finches provide a classic example of how
climatic
events associated with El Niño can lead to major fluctuations in
food supplies, which in turn drive reductions in abundance of up
to
40% per year in Geospiza populations (108). Anomalous rises in
seawater temperature associated with ENSO have also caused
se-
vere reductions in food supplies, leading to starvation and mass
mortality of marine birds (109–111). More recently, ocean
warming
associated with climate change has precipitated bottom-up
trophic
cascades, analogous to those proposed here for terrestrial
systems,
which have restructured both benthic and pelagic food webs and
driven declines in shearwaters and auklets (112–114).
Multiple Regression and Cross-Correlation. Our multiple
regression
results speak to the impact of both rising and falling tempera-
tures on vertebrates and invertebrates in the Luquillo forest.
While the effect of MnMaxT on abundance was negative in all
E10402 | www.pnas.org/cgi/doi/10.1073/pnas.1722477115
Lister and Garcia
http://www.pnas.org/lookup/suppl/doi:10.1073/pnas.172247711
5/-/DCSupplemental
www.pnas.org/cgi/doi/10.1073/pnas.1722477115
models, the proportion of temperatures greater than 29 °C had
both negative (El Verde E. coqui) and positive (walking sticks,
E.
coqui at Sonadura West and Sonadura Old) effects (SI
Appendix,
Table S5). This was perplexing, as we expected the frequency of
extreme temperatures to track the rise in mean temperature.
While this is true over the long term (SI Appendix, Fig. S8E), it
was not the case during the Sonadura West and Sonadura Old
censuses when the proportion of temperatures greater than 29
°C
fell from 0.1 to 0.0, or during the walking stick census when the
proportion dropped from 0.3 to 0.0. Only during Stewart’s
earlier
E. coqui census (28) did the proportion of higher temperature
rise steadily from 0.0 in 1982 to 0.1 in 1992.
The time line in SI Appendix, Fig. S9 places the dates of the
population studies analyzed here into the context of El Niño and
La Niña years as measured by the SOI. Positive SOI values (SI
Appendix, Fig. S9, blue areas) correspond to La Niña years and
negative values (SI Appendix, Fig. S9, red areas) to El Niño
years.
As SI Appendix, Fig. S9 illustrates, the canopy and walking
stick
censuses spanned three La Niña and three El Niño episodes. As
SI Appendix, Fig. S9 also shows, the eruption of Mount
Pinatubo,
which lowered global temperature by as much as 0.6 °C over the
next 2 y, occurred during the walking stick, Sonadura West, and
Sonadura Old censuses. The effects of Pinatubo most likely
lowered the frequency of extreme temperatures at El Verde
despite a simultaneous strong El Niño episode.
In a recent analysis of the growing frequency of extreme
weather, Diffenbaugh et al. (115) predicted a two- to threefold
increase in the probability of historically unprecedented maxi-
mum daily temperatures between 2018 and 2036, and a three- to
fivefold increase between 2036 and 2055. If these predictions
are
realized, the impact on food webs and ecosystems will be even
more rapid than expected from the steady, linear increases in
mean temperatures that are currently ravaging the natural world.
Numerous studies have documented the impact of the ENSO
on all of the major taxa considered here, including invertebrates
(116), frogs (63, 73, 77, 117), lizards (1, 5), and birds (118). In
keeping with our HP results, the multiple regressions for
walking
sticks and the El Verde E. coqui populations included the SOI
as
an important predictor of abundance, and the cross-correlations
between the SOI and abundances of canopy invertebrates and
walking sticks (SI Appendix, Fig. S6) underscore the
fluctuating
effects of La Niña and El Niño. The reason for the 2-y time lag
in
the effects of ENSO on walking stick abundance is not clear.
Changes in temperature often lag phase shifts in the SOI by up
to
9 mo, and this effect may be partly responsible.
From data gathered over 55 y and 16 locations in Puerto Rico,
the National Weather Service found that temperatures during La
Niña events averaged ∼2.0 °C lower during the dry season
(December to August), and 1.5 °C lower during the wet season
(May to November) compared with El Niño episodes. ENSO
also impacts rainfall across Puerto Rico, increasing dry season
precipitation by 13% during El Niño years and causing a 14%
increase in wet season precipitation during La Niña years. We
interpret the positive effect of La Niña on invertebrate abun-
dance as the result of cooler, wetter conditions conducive to
increased survivorship and population growth compared with
the
hotter and seasonally drier conditions of El Niño years. Stapley
et al. (20) reached a similar conclusion concerning the effects of
ENSO on Anolis populations in Panama.
While we have focused on population collapse driven by climate
change, shifts in altitudinal distributions of arthropods,
insectivores,
producers, and top predators may also play an important role in
the
observed declines in abundance. In montane habitats upward
mi-
grations into cooler refugia can spell the difference between
survival
and extinction as temperatures rise at lower elevations (119).
However, altitudinal shifts can also cause rapid changes in com-
munity structure, disrupting coevolved interactions, creating
“no-
analogue communities,” and contributing to community
disassem-
bly via accelerated extinctions (120, 121). The reductions in
habitat
area as species move up mountains also increase extinction rates
(87), and can erode genetic diversity, further reducing fitness
and
response to ongoing changes in climate (122, 123). At present,
the
extent to which these systemic factors may have influenced the
midelevation population declines documented here is unknown.
However, Luquillo forest birds and frogs are known to exhibit
elevational range shifts similar to those encountered on other
tropical mountains. Since 1998, 8 of 33 Luquillo forest bird
species (124) and 10 of 12 resident frog species (125) have un-
dergone elevational shifts.
An alternative to the climate-warming hypothesis for pop-
ulation declines in Luquillo and other tropical montane habitats
is a mechanism proposed by Lawton et al. (126). In theory,
clear
cutting of lowland forests raises surface temperature, which in
turn increases conductive heat flux from exposed ground to the
atmosphere. This reduces both evapotranspiration and evapo-
rative cooling (126) and lowers humidity. Pounds et al. (63)
have
presented a detailed rebuttal of the Lawton scenario with
respect
to montane forests in Costa Rica. With regard to the Luquillo
rain forest, the assumptions of the Lawton hypothesis simply do
not hold, given a major regeneration of the lowland forest since
the 1950s after a transition from an agrarian to a manufacturing
economy (127). Consequently, the degree of shade, cooling, and
humidification of the habitats surrounding the Luquillo Moun-
tains have all increased (128).
Conclusion
In general, a more integrated understanding of how climate
warming and global cycles affect population and food web dy-
namics awaits more extensive time series that encompass all
levels of tropical forest ecosystems, from producers to top
predators. The impacts of major climatic perturbations on the
forest food web, such as the hurricanes and prolonged droughts
driven by ENSO (SI Appendix, Fig. S9), also need further
study.
While the initial damage from Hurricane Hugo was devastating
(129), the Luquillo forest vegetation recovered remarkably
quickly, with 70% of trees at El Verde producing new leaves
after just 7 wk (130), and after Hurricane Georges insect pop-
ulations at all sites studied by Barberena-Arias and Aide (131)
recovered in less than 1 y. The resilience of the forest was also
manifested after Hurricane Maria when researchers found many
locations well on their way to recovery after 2 mo (132). How-
ever, as climate warming continues, the frequency and intensity
of hurricanes in Puerto Rico are expected to increase (133),
along with the severity of droughts and an additional 2.6–7 °C
temperature increase by 2099 (134), conditions that collectively
may exceed the resilience of the rainforest ecosystem.
The central question addressed by our research is why simul-
taneous, long-term declines in arthropods, lizards, frogs, and
birds have occurred over the past four decades in the relatively
undisturbed rainforests of northeastern Puerto Rico. Our anal-
yses provide strong support for the hypothesis that climate
warming has been a major factor driving reductions in arthropod
abundance, and that these declines have in turn precipitated
decreases in forest insectivores in a classic bottom-up cascade.
This hypothesis also provides a parsimonious explanation for
why similar cross-taxa, concordant decreases in reptiles,
anurans,
and birds have occurred in Costa Rican rainforests (3, 63), and
are likely occurring across a broad range of tropical ecosystems.
Overall, there is an urgent need for more widespread monitoring
of arthropods and insectivores throughout the tropics (135,
136).
As the sixth mass extinction continues to decimate the world’s
biota (137, 138), these data will be crucial to understanding the
impact of climate change on terrestrial food webs (139), eco-
system dynamics (140), and biodiversity (8), and to formulating
conservation strategies aimed at mitigating the effects of future
climate forcing.
Lister and Garcia PNAS | vol. 115 | no. 44 | E10403
EC
O
LO
G
Y
http://www.pnas.org/lookup/suppl/doi:10.1073/pnas.172247711
5/-/DCSupplemental
http://www.pnas.org/lookup/suppl/doi:10.1073/pnas.172247711
5/-/DCSupplemental
http://www.pnas.org/lookup/suppl/doi:10.1073/pnas.172247711
5/-/DCSupplemental
http://www.pnas.org/lookup/suppl/doi:10.1073/pnas.172247711
5/-/DCSupplemental
http://www.pnas.org/lookup/suppl/doi:10.1073/pnas.172247711
5/-/DCSupplemental
http://www.pnas.org/lookup/suppl/doi:10.1073/pnas.172247711
5/-/DCSupplemental
http://www.pnas.org/lookup/suppl/doi:10.1073/pnas.172247711
5/-/DCSupplemental
http://www.pnas.org/lookup/suppl/doi:10.1073/pnas.172247711
5/-/DCSupplemental
http://www.pnas.org/lookup/suppl/doi:10.1073/pnas.172247711
5/-/DCSupplemental
http://www.pnas.org/lookup/suppl/doi:10.1073/pnas.172247711
5/-/DCSupplemental
http://www.pnas.org/lookup/suppl/doi:10.1073/pnas.172247711
5/-/DCSupplemental
Materials and Methods
Study Sites. Our research was carried out in the Luquillo
Experimental Forest
(LEF), which encompasses 10,871 acres in the Luquillo
Mountains of northeastern
Puerto Rico. Elevations extend from <100 m to 1,078 m.
Rainfall and temperature
vary with altitude, ranging from 150 cm y−1 and 26 °C at lower
limits, to 450 cm y−1
and 18.9 °C on the highest peaks. We conducted our field work
in the same
study area utilized by Lister (22) in the 1970s. This location
(18°19′584″N longi-
tude, 65°228″W latitude) is situated on a northeast facing slope
at 440 m. The
vegetation is midelevation Tabonuco (Dacryodes excelsa) forest
(141), char-
acterized by an 8- to 10-m canopy, low ground light levels, and
high plant
diversity (171 tree species). We also sampled arthropods in a
tropical dry forest
in the Chamela-Cuixmala Biosphere Reserve in western Mexico
(19°22003″–
19°35011″N, 104°56013″ to 105°03025″W), to compare recent
samples with
those we obtained in the same study area in 1986 and 1987 (25).
Arthropod Samples. Lister (22) sampled arthropods within the
Luquillo forest
during July 1976 and January 1977. Following the same
procedures and using
the same study area, arthropod abundances were again estimated
during July
2011 and January 2012 using both sticky-traps and sweep
netting. Our 10 traps
were the same size (34 × 24 cm) as Lister’s (22), and also
utilized Tanglefoot as
the sticky substance. Traps were laid out on the ground in the
same-sized grid
(30 × 24 m), and also left uncovered for 12 h between dawn and
dusk before all
captured insects were removed and stored in alcohol. Hoop sizes
of our sweep
nets (30-cm diameter) matched those used by Lister (22). Body
lengths of all
captured arthropods were measured to the nearest 0.5 mm using
a dissecting
scope and ocular micrometer. Regression equations were used to
estimate in-
dividual dry weights from body lengths (142, 143).
Anolis Abundance. To compare Anolis densities with Lister’s
(22) estimates
from July 1976 and January 1977, we sampled anoles within the
same 15 ×
15-m quadrat during July 2011 and January 2012. Following
Lister (22), we
used the Schnabel multiple recapture method (27) to estimate
densities.
However, instead of marking captured lizards by toe clipping,
we used
Testor’s enamel paint to create small (∼2 mm) spots with
different color
combinations directly above the dorsal base of the tail.
Climate Data. We analyzed climate data taken at two locations
in the Luquillo
forest: the United States Forest Service El Verde Field Station
and the Bisley
Lower meteorological tower, which is part of the Luquillo
Critical Zone
Observatory. The El Verde station lies 5 km southwest of our
study area
(18.3211° N, 65.8200° W), at an elevation of 350 m. The upper
Bisley Tower is
located 3.2 km southeast of our study area (18.3164 N, 65.7453
W) at 352 m
in elevation. Temperature data for the El Verde station span 37
y, from
1978 to 2015 (Fig. 1A), and for the Bisley station 21 y from
1993 to 2014 (Fig.
1B). Given that the highest ambient temperatures for a given
area should
have the greatest impact on fitness, especially for ectotherms
(144), daily
maximum temperatures were utilized in our analyses. Climate
data for the
Estacion de Biologia Chamela were obtained from
www.ibiologia.unam.mx/
ebchamela/www/clima.html.
Luquillo Long-Term Ecological Research Data. Data sets from
the Luquillo long-
term ecological research (LTER) online Data Center were
downloaded and an-
alyzed for trends in population abundances over time. Detailed
methods
employed in the various studies can be found at the LTER Data
Center website
(https://luq.lter.network/luquillo-information-management-
system-luq-ims).
Canopy arthropods. Data were collected by Schowalter (23)
near the El Verde
field station between February 1991 and June 2009. Several
articles have ana-
lyzed these samples with respect to invertebrate diversity,
functional groups,
arthropod composition in gap and intact forest, and recovery
from disturbance
(145), but none have looked for trends in overall abundance.
Here we summed
all arthropods sampled each year across taxa, forest type, and
tree genera.
Walking sticks. We analyzed data from a census of walking
sticks (Lamponius
portoricensis) carried out by Willig et al. (24) between 1991 and
2014 in the
16-ha Luquillo Forest Dynamics Plot (LFDP) near the El Verde
Field Station.
Sampling was conducted during the wet and dry seasons and
captured in-
dividuals were classified as adults or juveniles. To analyze
walking stick
abundance through time, we summed all juveniles and adults
across seasons
and land classes.
E. coqui abundance. We analyze census data for the Puerto
Rican frog E. coqui
taken by Woolbright (29, 30) between 1987 and 1997 at study
areas near the
El Verde Field Station and in the Bisley watershed, as well as
E. coqui census
data taken by Stewart (28) in another study area at El Verde.
For Wool-
brights’s (29, 30) census data at the Sonadura Old study area,
we removed
one outlier for the 1995 census data when E. coqui numbers
increased from
29 to 236 and returned to 45 individuals in the next census.
Mist netting. We analyze mist netting data taken by Waide (31)
in the LFDP
from June 1990 until May 2005. Nets were run from dawn to
dusk for a total
of 4 consecutive days each year during late May and early June.
Only the
post-Hurricane Hugo capture rates for June 1990 have
previously been
published (31). We calculated the total number of individuals
caught per
year across all species across all 15 y of data. Given that the
ruddy quail dove
(G. montana) is an exclusive granivore (SI Appendix, Fig. S4)
and could
confound patterns in insectivore abundance, we excluded this
species from
counts of captured birds. Recaptures of the same individuals
within a given
sampling period were also eliminated from the analysis.
Statistical Analyses. All analyses were conducted with R 3.4.2
using RStudio
v1.0.153. Poisson regressions and the nonparametric Theil-Sen
regression
were carried out with the glm2 (146) and mblm (147) R
packages. Poisson
regressions were tested for overdispersion using the AER
package (148).
Because all dispersion tests rejected the null hypothesis, only
quasi-Poisson
regressions were used. Guided by Pounds et al. (63, 73),
Aguilar et al. (149),
Stapley et al. (20), and García-Robledo et al. (53), we
constructed 11 climate-
related indices from the Luquillo LTER temperature and rainfall
data for use
in HP and regression analyses. SOI data were downloaded from
the National
Center for Atmospheric Research website (www.cgd.ucar.edu).
Olea et al.
(150) have shown that for more than nine explanatory variables,
the order in
which variables are entered in an HP analysis can affect the
amount of in-
dependent variance explained by a given predictor. Hence, we
eliminated
2 of the 11 climate variables that had the highest correlations
with the other
climate variables. The final nine variables are defined in SI
Appendix, Table
S3. If a given variable did not make at least a 5% independent
contribution
to the explanation of the deviance, it was not included in the
regression
analyses. For the HP analyses we employed the hier.part R
package (151),
and for the Vinod Causality analyses the generalCorr package
(37).
We did not utilize automated regression techniques, such as
stepwise selection
and backward elimination, due to a variety of issues including
erroneous type I
error rates and inflated R2 measures (33). Climate variables are
often highly
correlated and can generate spurious results when used in
regression (34, 134).
To guard against such effects of multicollinearity, we
constructed correlation
matrices of the HP predictors and eliminated variables having
correlations of
0.7 or higher. All multivariate quasi-Poisson regressions were
then checked for
multicollinearity using the Variance Inflation Factor and
Bartlett’s Test of Sphe-
ricity. Because Akaike’s Information Criterion cannot be
calculated for quasi-
Poisson models, we selected models having the smallest
deviance residuals and
the lowest χ2 test statistic P values.
ACKNOWLEDGMENTS. We thank Ray Huey for his advice
throughout this
study; Patricia Burrowes, Luisa Otero, and Hector Alvarez for
their support in
Puerto Rico; Sarahi Torobio, Eduardo Avila, Helda Hernandez,
and Katherine
Lister for assistance in Mexico; Felipe Cano (US Department of
Agriculture
Forest Service) for facilitating research at Luquillo; Wayne
Arendt (US Depart-
ment of Agriculture Forest Service) for sharing his knowledge
of Luquillo avian
populations; Prof. H. D. Vinod for guidance on using his
generalCorr R Package;
and our reviewers for their comments, which broadened our
understanding
of climate warming effects and strengthened our analyses. We
received sup-
port from the Department of Biological Sciences at Rensselaer
Polytechnic
Institute, the graduate program in the biological sciences at the
Instituto
de Biologia, Universidad Nacional Autonoma de Mexico, and
the Estacion de
Biologıa Chamela of the Instituto de Biologia- Universidad
Nacional Autonoma
de Mexico. This research was supported by National Science
Foundation
Grant 1038013.
1. Parry ML, Canziani OF, Palutikof JP, van der Linden PJ,
Hanson CE, eds (2007) Contribution
of Working Group II to the Fourth Assessment Report of the
Intergovernmental Panel on
Climate Change (Cambridge Univ Press, Cambridge, UK).
2. Seebacher F, White CR, Franklin CE (2015) Physiological
plasticity increases resilience
of ectothermic animals to climate change. Nat Clim Change
5:61–66.
3. Janzen D (1967) Why mountain passes are higher in the
tropics. Am Nat 101:233–249.
4. Whitfield SM, et al. (2007) Amphibian and reptile declines
over 35 years at La Selva,
Costa Rica. Proc Natl Acad Sci USA 104:8352–8356.
5. Deutsch CA, et al. (2008) Impacts of climate warming on
terrestrial ectotherms across
latitude. Proc Natl Acad Sci USA 105:6668–6672.
6. Huey RB, et al. (2009) Why tropical forest lizards are
vulnerable to climate warming.
Proc Biol Sci 276:1939–1948.
7. Sinervo B, et al. (2010) Erosion of lizard diversity by climate
change and altered
thermal niches. Science 328:894–899.
8. Sunday J, Bates A, Dulvy N (2011) Global analysis of
thermal tolerance and latitude in
ectotherms. Proc Biol Sci 278:1823–1830.
E10404 | www.pnas.org/cgi/doi/10.1073/pnas.1722477115
Lister and Garcia
http://www.ibiologia.unam.mx/ebchamela/www/clima.html
https://luq.lter.network/luquillo-information-management-
system-luq-ims
http://www.pnas.org/lookup/suppl/doi:10.1073/pnas.172247711
5/-/DCSupplemental
http://www.cgd.ucar.edu/
http://www.pnas.org/lookup/suppl/doi:10.1073/pnas.172247711
5/-/DCSupplemental
http://www.pnas.org/lookup/suppl/doi:10.1073/pnas.172247711
5/-/DCSupplemental
www.pnas.org/cgi/doi/10.1073/pnas.1722477115
9. Maclean IM, Wilson RJ (2011) Recent ecological responses
to climate change support
predictions of high extinction risk. Proc Natl Acad Sci USA
108:12337–12342.
10. Conrad M, Warren B, Fox R, Parsons M, Woiwoda I (2006)
Rapid declines of common,
widespread British moths provide evidence of an insect
biodiversity crisis. Biol
Conserv 132:279–291.
11. Forister ML, et al. (2010) Compounded effects of climate
change and habitat alter-
ation shift patterns of butterfly diversity. Proc Natl Acad Sci
USA 107:2088–2092.
12. Brooks D, et al. (2012) Large carabid beetle declines in a
United Kingdom monitoring
network increases evidence for a widespread loss in insect
biodiversity. J Appl Ecol
49:1009–1019.
13. Potts SG, et al. (2010) Global pollinator declines: Trends,
impacts and drivers. Trends
Ecol Evol 25:345–353.
14. Fonty E, Sarthou C, Larpinz D, Ponge J (2009) A 10-year
decrease in plant species
richness on a neotropical inselberg: Detrimental effects of
global warming? Glob
Change Biol 15:2360–2374.
15. Feeley KJ, Davies SJ, Perez R, Hubbell SP, Foster RB
(2011) Directional changes in the
species composition of a tropical forest. Ecology 92:871–882.
16. Lewis S, Lloyd S, Sitch E, Mitchard A, Laurance W (2009)
Changing ecology of tropical
forests: Evidence and drivers. Annu Rev Ecol Evol Syst 40:529–
549.
17. Robinet C, Roques A (2010) Direct impacts of recent
climate warming on insect
populations. Integr Zool 5:132–142.
18. Guo K, Jianxing Sun O, Kang L (2011) The responses of
insects to global warming.
Recent Advances in Entomological Research, eds Liu T, Kang L
(Springer Science,
Business Media, New York).
19. Duarte C, Lenton T, Wadhams P, Wassmann P (2012)
Abrupt climate change in the
Arctic. Nat Clim Change 2:60–62.
20. Stapley J, Garcia M, Andrews RM (2015) Long-term data
reveal a population decline
of the tropical lizard Anolis apletophallus, and a negative affect
of El Niño years on
population growth rate. PLoS One 10:e0115450.
21. Ault T (2016) High Resolution Caribbean Drought Atlas.
Available at ecrl.eas.cornell.
edu/node/56. Accessed May 20, 2018.
22. Lister BC (1981) Seasonal niche relationships of rainforest
anoles. Ecology 62:
1548–1560.
23. Schowalter TD (1994) Invertebrate community structure and
herbivory in a tropical
rain forest canopy in Puerto Rico following Hurricane Hugo.
Biotropica 26:312–319.
24. Willig MR, Presley SJ, Bloch CP (2011) Long-term
dynamics of tropical walking sticks
in response to multiple large-scale and intense disturbances.
Oecologia 165:357–368.
25. Lister BC, Garcia A (1992) Seasonality, predation and the
behaviour of a tropical
mainland anole. J Anim Ecol 61:717–734.
26. Reagan D, Waide R, eds (1996) The Food Web of a Tropical
Rain Forest (Univ of
Chicago Press, Chicago).
27. Ricker W (1975) Computation and interpretation of
biological statistics of fish
populations. Bull Fish Res Board Can 191:1–382.
28. Stewart MM (1995) Climate driven population fluctuations
in rain forest frogs.
J Herpetol 29:437–446.
29. Woolbright L (1991) Impact of Hurricane Hugo on forest
frogs in Puerto Rico.
Biotropica 23:462–467.
30. Woolbright L (1996) Disturbance influences long-term
population patterns in the
Puerto Rican frog, Eleutherodactylus coqui (Anura:
Leptodactylidae). Biotropica 28:
493–501.
31. Waide R (1991) The effect of Hurricane Hugo on bird
populations in the Luquillo
Experimental Forest, Puerto Rico. Biotropica 23:475–480.
32. Mac Nally R (1996) Hierarchical partitioning as an
interpretative tool in multivariate
inference. Aust J Ecol 21:224–228.
33. Mac Nally R (2000) Regression and model-building in
conservation biology, bio-
geography and ecology: The distinction between—and
reconciliation of—‘predictive’
and ‘explanatory’ models. Biodivers Conserv 9:655–671.
34. Mac Nally R (2002) Multiple regression and inference in
ecology and conservation
biology: Further comments on identifying important predictor
variables. Biodivers
Conserv 11:1397–1401.
35. Chevan A, Sutherland M (1991) Hierarchical partitioning.
Am Stat 45:90–96.
36. Vinod HD (2017) Generalized correlation and kernel
causality with applications in
development economics. Commun Stat Simul Comput 46:4513–
4534.
37. Vinod HD (2017) Generalized correlation and kernel
causality using R package
generalCorr. Available at https://cran.r-
project.org/web/packages/generalCorr/
vignettes/generalCorr-vignette.pdf. Accessed May 1, 2018.
38. Vinod HD (2018) New exogeneity tests and causal paths:
Air pollution and monetary
policy illustrations using generalCorr package. Available at
https://cran.r-project.org/
web/packages/generalCorr/vignettes/generalCorr-vignette2.pdf.
Accessed May 1,
2018.
39. Granger CWJ (1969) Investigating causal relations by
econometric models and cross-
spectral methods. Econometrica 37:424–438.
40. Pearl J (2010) The foundations of causal inference. Sociol
Methodol 40:75–149.
41. Hoyer P, Janzig D, Mooij J, Peters J, Scholkopf B (2009)
Non-linear causal discovery
with additive noise models. Adv Neural Inf Process Syst
21:689–696.
42. Mooij J, Peters J, Janzig D, Zscheischler J, Scholkopf B
(2016) Distinguishing cause
from effect using observational data: Methods and benchmarks.
J Mach Learn Res
17:1–102.
43. Wolda H (1992) Trends in abundance of tropical forest
insects. Oecologia 89:47–52.
44. Terborgh J, Estes J (2010) Trophic Cascades: Predators,
Prey, and the Changing
Dynamics of Nature (Island Press, Washington, DC), 2nd Ed.
45. Pacala S, Roughgarden J (1984) Control of arthropod
abundance by Anolis lizards on
St. Eustatius (Neth. Antilles). Oecologia 64:160–162.
46. Marquis R, Whelan C (1994) Insectivorous birds increase
growth of white oak
through consumption of leaf-chewing insects. Ecology 75:2007–
2014.
47. Stewart M, Woolbright L (1996) Amphibians. The Food
Web of a Tropical Rain
Forest, eds Reagan DP, Waide RB (Univ of Chicago Press,
Chicago), pp 363–398.
48. Villalpando SN, Williams RS, Norby RJ (2009) Elevated air
temperature alters an old-
field insect community in a multifactor climate change
experiment. Glob Change
Biol 15:930–942.
49. Karl I, Stoks R, De Block M, Janowitz SA, Fischer K (2011)
Temperature extremes and
butterfly fitness: Conflicting evidence from life history and
immune function. Glob
Change Biol 17:676–687.
50. Zeh J, et al. (2012) Degrees of disruption: Projected
temperature increase has cata-
strophic consequences for reproduction in a tropical ectotherm.
Glob Change Biol
18:1833–1842.
51. Piyaphongkul J, Pritchard J, Bale J (2012) Can tropical
insects stand the heat? A case
study with the brown planthopper Nilaparvata lugens (Stål).
PLoS One 7:e29409.
52. Diamond SE, et al. (2012) Who likes it hot? A global
analysis of the climatic, eco-
logical, and evolutionary determinants of warming tolerance in
ants. Glob Change
Biol 18:448–456.
53. García-Robledo C, Kuprewicz EK, Staines CL, Erwin TL,
Kress WJ (2016) Limited tol-
erance by insects to high temperatures across tropical
elevational gradients and the
implications of global warming for extinction. Proc Natl Acad
Sci USA 113:680–685.
54. Kotze DJ, O’Hara RB (2003) Species decline—But why?
Explanations of carabid
beetle (Coleoptera, Carabidae) declines in Europe. Oecologia
135:138–148.
55. Thomas JA, et al. (2004) Comparative losses of British
butterflies, birds, and plants
and the global extinction crisis. Science 303:1879–1881.
56. Kerr JT, et al. (2015) Climate change. Climate change
impacts on bumblebees con-
verge across continents. Science 349:177–180.
57. Goulson D, Nicholls E, Botías C, Rotheray EL (2015) Bee
declines driven by combined
stress from parasites, pesticides, and lack of flowers. Science
347:1255957.
58. Becher MA, Osborne JL, Thorbek P, Kennedy PJ, Grimm V
(2013) Towards a systems
approach for understanding honeybee decline: A stocktaking
and synthesis of ex-
isting models. J Appl Ecol 50:868–880.
59. Harris NL, Lugo AE, Brown S, Heartsill Scalley T, eds
(2012) Luquillo Experimental
Forest: Research History and Opportunities. Experimental
Forests and Ranges EFR-1
(USDA Forest Service, Washington, DC).
60. Hanson B, Bond C, Buhl K, Stone D (2015) Pesticide half-
life fact sheet. (National
Pesticide Information Center, Oregon State University
Extension Services, Corvallis,
OR), Available at npic.orst.edu/factsheets/half-life.html.
Accessed October 10, 2017.
61. Hallmann CA, et al. (2017) More than 75 percent decline
over 27 years in total flying
insect biomass in protected areas. PLoS One 12:e0185809.
62. Tewksbury JJ, Huey RB, Deutsch CA (2008) Ecology.
Putting the heat on tropical
animals. Science 320:1296–1297.
63. Pounds J, Fogden M, Campbell J (1999) Biological response
to climate change on a
tropical mountain. Nature 398:611–615.
64. Joglar R, Burrowes P (1996) Declining amphibian
populations in Puerto Rico. Con-
tributions to West Indian Herpetology: A Tribute to Albert
Schwartz, Contributions
to Herpetology, eds Powell R, Henderson RW (The Society for
the Study of Am-
phibians and Reptiles, Ithaca, NY), Vol 12, pp 371–380.
65. IUCN (2017) IUCN Red List of Threatened Species.
Available at www.iucnredlist.org.
Accessed May 25, 2017.
66. Burrowes P, Joglar R, Green D (2004) Potential causes for
amphibian declines in
Puerto Rico. Herpetologica 60:141–154.
67. Hedges S (1993) Global amphibian declines: A perspective
from the Caribbean.
Biodivers Conserv 2:290–303.
68. Pounds JA (1990) Disappearing gold. BBC Wildlife 8:812–
817.
69. Pounds JA (1991) Amphibian watch: New clues in the case
of the disappearing
amphibians. Wildlife Conservation 94:16–18.
70. Barinaga M (1990) Where have all the froggies gone?
Science 247:1033–1034.
71. Crawford AJ, Lips KR, Bermingham E (2010) Epidemic
disease decimates amphibian
abundance, species diversity, and evolutionary history in the
highlands of central
Panama. Proc Natl Acad Sci USA 107:13777–13782.
72. Pounds JA, Fogden MPL, Savage J, Gorman G (1997) Tests
of null models for am-
phibian declines on a tropical mountain. Conserv Biol 11:1307–
1322.
73. Pounds JA, et al. (2006) Widespread amphibian extinctions
from epidemic disease
driven by global warming. Nature 439:161–167.
74. Catenazzi A (2015) State of the world’s amphibians. Annu
Rev Environ Resour 40:
91–119.
75. Burrowes P, Longo A, Joglar R (2008) Geographic
distribution of Batrachochytrium
dendrobatidis in Puerto Rico. Herpetol Rev 39:321–324.
76. Longo AV, Burrowes PA, Joglar RL (2010) Seasonality of
Batrachochytrium den-
drobatidis infection in direct-developing frogs suggests a
mechanism for persistence.
Dis Aquat Organ 92:253–260.
77. Pounds JA, Crump ML (1994) Amphibian declines and
climate disturbance: The case
of the golden toad and the harlequin frog. Conserv Biol 8:72–
85.
78. Pounds JA, Carnaval AC, Puschendorf R, Haddad CFB,
Masters KL (2006) Responding
to amphibian loss. Science 314:1541–1542.
79. Pounds JA (2001) Climate and amphibian declines. Nature
410:639–640.
80. Langhammer PF, Burrowes PA, Lips KR, Bryant SB, Collins
JP (2014) Susceptibility to
the amphibian chytrid fungus varies with ontogeny in the direct-
developing frog
Eleutherodactylus coqui. J Wildl Dis 50:438–446.
81. Stevenson LA, et al. (2013) Variation in thermal
performance of a widespread
pathogen, the amphibian chytrid fungus Batrachochytrium
dendrobatidis. PLoS One
8:e73830.
82. Holmes I, McLaren K, Wilson B (2014) Precipitation
constrains amphibian chytrid
fungus infection rates in a terrestrial frog assemblage in
Jamaica, West Indies.
Biotropica 46:219–228.
Lister and Garcia PNAS | vol. 115 | no. 44 | E10405
EC
O
LO
G
Y
http://ecrl.eas.cornell.edu/node/56
https://cran.r-
project.org/web/packages/generalCorr/vignettes/generalCorr-
vignette.pdf
https://cran.r-
project.org/web/packages/generalCorr/vignettes/generalCorr-
vignette.pdf
https://cran.r-
project.org/web/packages/generalCorr/vignettes/generalCorr-
vignette2.pdf
https://cran.r-
project.org/web/packages/generalCorr/vignettes/generalCorr-
vignette2.pdf
http://npic.orst.edu/factsheets/half-life.html
http://www.iucnredlist.org
83. Blaustein AR, et al. (2012) Ecophysiology meets
conservation: Understanding the
role of disease in amphibian population declines. Philos Trans R
Soc Lond B Biol Sci
367:1688–1707.
84. Berlanga H, et al. (2010) Saving Our Shared Birds: Partners
in Flight Tri-National
Vision for Landbird Conservation (Cornell Lab of Ornithology,
Ithaca, NY).
85. Sigel BJ, Sherry TW, Young BE (2006) Avian community
response to lowland tropical
rainforest isolation: 40 years of change at La Selva Biological
Station, Costa Rica.
Conserv Biol 20:111–121.
86. Faaborg J, et al. (2013) Long-term decline of a winter-
resident bird community in
Puerto Rico. Biodivers Conserv 22:63–75.
87. Sekercioglu C, Primack R, Wormworth J (2012) The effects
of climate change on
tropical birds. Biol Conserv 148:1–18.
88. Jiguet F, et al. (2010) Bird population trends are linearly
affected by climate change
along species thermal ranges. Proc Biol Sci 277:3601–3608.
89. McKechnie AE, Wolf BO (2010) Climate change increases
the likelihood of cata-
strophic avian mortality events during extreme heat waves. Biol
Lett 6:253–256.
90. Cruz-McDonnell KK, Wolf BO (2016) Rapid warming and
drought negatively impact
population size and reproductive dynamics of an avian predator
in the arid south-
west. Glob Change Biol 22:237–253.
91. Ydenberg R, Butler R, Lank D, Smith B, Ireland J (2004)
Western sandpipers have
altered migration tactics as peregrine falcon populations have
recovered. Proc Biol
Sci 271:1263–1269.
92. Baines D, Redpath S, Richardson M, Thirgood S (2008) The
direct and indirect effects
of predation by Hen Harriers Circus cyaneus on trends in
breeding birds on a Scottish
grouse moor. Ibis 150:27–36.
93. Devictor V, Julliard R, Couvet D, Jiguet F (2008) Birds are
tracking climate warming,
but not fast enough. Proc Biol Sci 275:2743–2748.
94. Both C, Bouwhuis S, Lessells CM, Visser ME (2006)
Climate change and population
declines in a long-distance migratory bird. Nature 441:81–83.
95. Hallmann CA, Foppen RP, van Turnhout CA, de Kroon H,
Jongejans E (2014) Declines
in insectivorous birds are associated with high neonicotinoid
concentrations. Nature
511:341–343.
96. Wilson J, Morris A, Arroyo B, Clark S, Bradbury R (1999)
A review of the abundance
and diversity of invertebrate and plant foods of granivorous
birds in northern
Europe in relation to agricultural change. Agric Ecosyst Environ
75:13–30.
97. Pearce-Higgins J, Dennis P, Whittingham M, Yalden D
(2010) Impacts of climate on
prey abundance account for fluctuations in a population of a
northern wader at the
southern edge of its range. Glob Change Biol 16:12–23.
98. Mac Nally R, et al. (2009) Collapse of an avifauna: Climate
change appears to ex-
acerbate habitat loss and degradation. Divers Distrib 15:720–
730.
99. North American Bird Conservation Initiative Canada (2012)
The State of Canada’s
Birds, 2012. Available at stateofcanadasbirds.org/. Accessed
October 1, 2016.
100. Nebel S, Mills A, McCracken J, Taylor P (2010) Declines
of aerial insectivores in North
America follow a geographic gradient. Avian Conserv Ecol 5:1.
101. Castelletta M, Sodhi NS, Subaraj R (2000) Heavy
extinctions of forest avifauna in
Singapore: Lessons for biodiversity conservation in Southeast
Asia. Conserv Biol 14:
1870–1880.
102. Stouffer P, Bierregaard R (1995) Use of Amazonian forest
fragments by understory
insectivorous birds. Ecology 76:2429–2445.
103. Stratford JA, Stouffer PC (1999) Local extinctions of
terrestrial insectivorous birds in
a fragmented landscape near Manaus, Brazil. Conserv Biol
13:1416–1423.
104. Sekercioglu CH, et al. (2002) Disappearance of
insectivorous birds from tropical
forest fragments. Proc Natl Acad Sci USA 99:263–267.
105. Newton I (1980) The role of food in limiting bird numbers.
Ardea 68:11–30.
106. Edworthy A, Drevera M, Martina K (2011) Woodpeckers
increase in abundance but
maintain fecundity in response to an outbreak of mountain pine
bark beetles. For
Ecol Manage 261:203–210.
107. Brown DR, Sherry TW (2006) Food supply controls the
body condition of a migrant
bird wintering in the tropics. Oecologia 149:22–32.
108. Grant B, Grant P (1993) Evolution of Darwin’s finches
caused by a rare climatic event.
Proc R Soc Lond 251:111–117.
109. Piatt J, Van Pelt T (1997) Mass-mortality of Guillemots
(Uria aalge) in the Gulf of
Alaska in 1993. Mar Pollut Bull 34:656–662.
110. Ayala L, Paz-Soldan L, Garate P (2013) A mass mortality
event of sooty shearwaters
(Puffinus griseus) on the central coast of Peru. Notornis
60:258–261.
111. Fuentes H, Antonietti E (1989) Efectos del Fenómeno El
Niño en las aves marinas del
litoral peruano. Boletín Estudio Regional del Fenómeno El Niño
29:19–26.
112. Veit R, McGowan J, Ainley D, Wahland T, Pyle P (1997)
Apex marine predator de-
clines ninety percent in association with changing oceanic
climate. Glob Change Biol
3:23–28.
113. Baduini C, et al. (2001) Mass mortality of short-tailed
shearwaters in the south-
eastern Bering Sea during summer 1997. Fish Oceanogr 10:117–
130.
114. Springer A, Byrd G, Iverson S (2007) Hot oceanography:
Planktivorous seabirds reveal
ecosystem responses to warming of the Bering Sea. Mar Ecol
Prog Ser 352:289–297.
115. Diffenbaugh NS, Singh D, Mankin JS (2018)
Unprecedented climate events: Historical
changes, aspirational targets, and national commitments. Sci
Adv 4:eaao3354.
116. Gutiérrez-Fonseca PE, Ramírez A, Pringle CM (2018)
Large-scale climatic phenomena
drive fluctuations in macroinvertebrate assemblages in lowland
tropical streams,
Costa Rica: The importance of ENSO events in determining
long-term (15y) patterns.
PLoS One 13:e0191781.
117. Kiesecker JM, Blaustein AR, Belden LK (2001) Complex
causes of amphibian pop-
ulation declines. Nature 410:681–684.
118. Sillett TS, Holmes RT, Sherry TW (2000) Impacts of a
global climate cycle on pop-
ulation dynamics of a migratory songbird. Science 288:2040–
2042.
119. Colwell RK, Brehm G, Cardelús CL, Gilman AC, Longino
JT (2008) Global warming,
elevational range shifts, and lowland biotic attrition in the wet
tropics. Science 322:
258–261.
120. Sheldon KS, Yang S, Tewksbury JJ (2011) Climate change
and community disas-
sembly: Impacts of warming on tropical and temperate montane
community struc-
ture. Ecol Lett 14:1191–1200.
121. Urban MC, Tewksbury JJ, Sheldon KS (2012) On a
collision course: Competition and
dispersal differences create no-analogue communities and cause
extinctions during
climate change. Proc Biol Sci 279:2072–2080.
122. Arenas M, Ray N, Currat M, Excoffier L (2012)
Consequences of range contractions
and range shifts on molecular diversity. Mol Biol Evol 29:207–
218.
123. Rubidge EM, et al. (2012) Climate-induced range
contraction drives genetic erosion
in an alpine mammal. Nat Clim Chang 2:285–288.
124. Campos-Cerqueira M, Arendt WJ, Wunderle JM, Jr, Aide
TM (2017) Have bird dis-
tributions shifted along an elevational gradient on a tropical
mountain? Ecol Evol 7:
9914–9924.
125. Campos-Cerqueira M, Aide TM (2017) Lowland
extirpation of anuran populations on
a tropical mountain. PeerJ 5:e4059.
126. Lawton RO, Nair US, Pielke RA, Sr, Welch RM (2001)
Climatic impact of tropical
lowland deforestation on nearby montane cloud forests. Science
294:584–587.
127. Helmer EH, Brandeis TJ, Lugo AE, Kennaway T (2008)
Factors influencing spatial
pattern in tropical forest clearance and stand age: Implications
for carbon storage
and species diversity. J Geophys Res 113:G02S04.
128. Otero LM, Huey RB, Gorman GC (2015) A few meters
matter: Local habitats drive
reproductive cycles in a tropical lizard. Am Nat 186:E72–E80.
129. Brokaw NVL, Grear JS (1991) Forest structure before and
after Hurricane Hugo at
three elevations in the Luquillo Mountains, Puerto Rico.
Biotropica 23:386–392.
130. Walker LR, Voltzow J, Ackerman JD, Fernandez DS,
Fetcher N (1992) Immediate
impact of Hurricane Hugo on a Puerto Rican rain forest.
Ecology 73:691–694.
131. Barberena-Arias MF, Aide TM (2002) Variation in species
and trophic composition of
insect communities in Puerto Rico. Biotropica 34:357–367.
132. Thompson J (2018) Forest dynamics. Available at
luq.lter.network/forest-dynamics-
jill-thompson. Accessed June 20, 2018.
133. Bender MA, et al. (2010) Modeled impact of anthropogenic
warming on the fre-
quency of intense Atlantic hurricanes. Science 327:454–458.
134. Knape J, de Valpine P (2011) Effects of weather and
climate on the dynamics of
animal population time series. Proc Biol Sci 278:985–992.
135. Vasconcelos H, Bruna E (2012) Arthropod responses to the
experimental isolation of
Amazonian forest fragments. Zoologia 29:515–530.
136. Lobo JM (2016) The use of occurrence data to predict the
effects of climate change
on insects. Curr Opin Insect Sci 17:62–68.
137. Ceballos G, et al. (2015) Accelerated modern human-
induced species losses: Entering
the sixth mass extinction. Sci Adv 1:e1400253.
138. Ceballos G, Ehrlich PR, Dirzo R (2017) Biological
annihilation via the ongoing sixth
mass extinction signaled by vertebrate population losses and
declines. Proc Natl
Acad Sci USA 114:E6089–E6096.
139. Traill LW, Lim MLM, Sodhi NS, Bradshaw CJA (2010)
Mechanisms driving change:
Altered species interactions and ecosystem function through
global warming.
J Anim Ecol 79:937–947.
140. Walther GR (2010) Community and ecosystem responses to
recent climate change.
Philos Trans Royal Soc A 365:2019–2024.
141. Foster DR, Fluet M, Boose ER (1999) Human or natural
disturbance: Landscape-scale
dynamics of the tropical forests of Puerto Rico. Ecol App
9:555–672.
142. Ganihar SR (1997) Biomass estimates of terrestrial
arthropods based on body length.
J Biosci 22:219–224.
143. Johnson MD, Strong AM (2000) Length-weight
relationships of Jamaican arthro-
pods. Entomol News 111:270–281.
144. Kingsolver JG, Diamond SE, Buckley LB (2013) Heat
stress and the fitness conse-
quences of climate change for terrestrial ectotherms. Funct Ecol
27:1415–1423.
145. Schowalter TD, Ganio LM (1999) Invertebrate
communities in a tropical rain forest
canopy in Puerto Rico following Hurricane Hugo. Ecol Entomol
24:191–201.
146. Marschner IC (2011) glm2: Fitting generalized linear
models with convergence
problems. R J 3:12–15.
147. Komsta L (2013) mblm: Median-Based Linear Models. R
Package Version 0.12.
Available at https://CRAN.R-project.org/package=mbl.
Accessed December 1, 2017.
148. Kleiber C, Zeileis A (2008) Applied Econometrics with R
(Springer, New York),
Available at https://cran.r-
project.org/web/packages/AER/index.html. Accessed June 1,
2016.
149. Aguilar E, et al. (2005) Changes in precipitation and
temperature extremes in Central
America and northern South America, 1961–2003. J Geophys
Res Atmos 110:D23107.
150. Olea PP, Mateo-Tomás P, de Frutos A (2010) Estimating
and modelling bias of the
hierarchical partitioning public-domain software: Implications
in environmental
management and conservation. PLoS One 5:e11698.
151. Walsh C, Mac Nally R (2013) hier.part: Hierarchical
Partitioning. R Package Version
1.0-4. Available at https://cran.r-
project.org/web/packages/hier.part/index.html. Ac-
cessed May 1, 2018.
E10406 | www.pnas.org/cgi/doi/10.1073/pnas.1722477115
Lister and Garcia
http://stateofcanadasbirds.org/
http://luq.lter.network/forest-dynamics-jill-thompson
https://CRAN.R-project.org/package=mbl
https://cran.r-project.org/web/packages/AER/index.html
https://cran.r-project.org/web/packages/hier.part/index.html
www.pnas.org/cgi/doi/10.1073/pnas.1722477115
Sheet1xy47.6108192763-122.290816002247.6878010086-
122.313427273947.5239795043-
122.359890599147.6541086069-
122.337605288247.5506196981-
122.320135414147.6080099819-
122.328738669947.5553892558-
122.384738627147.5562356536-122.385980506247.654787431-
122.336519884647.5652091275-
122.373747516847.5536456857-
122.363257325247.6957185793-
122.311943918747.6972009726-122.31348102947.6544767899-
122.336464262947.6957369531-122.31316340847.6872456761-
122.334695702447.6882655474-122.33585552447.6840722784-
122.326488432147.555381734-122.38622263147.6136155346-
122.347057814947.6953856705-
122.313074947647.6733393883-122.39512028247.6736070968-
122.393802859447.622366025-122.315918000447.5341884029-
122.281393234447.6153962664-
122.348663745947.6794116899-
122.370539626147.6174259787-
122.326756271747.6395260756-
122.328378742247.6789013609-
122.381863274647.5254361097-
122.329019336847.6880480751-
122.392309999447.6526306369-
122.342217144547.5603489768-
122.314023190647.6505515559-
122.330588662547.6924645956-
122.286883768947.6715870433-122.25994740447.5664287096-
122.38084221347.6794670377-122.356600081547.6717143403-
122.365887597947.6942077243-
122.286249166247.6928151492-
122.285336467147.5616814291-122.27212282847.6258516153-
122.320041323447.582391548-122.394477613247.6842730779-
122.32661592247.6841569098-122.325972154247.5799961341-
122.402044500147.7148851918-
122.332963649647.5525663188-
122.304349644347.6543710193-
122.357453783247.5687392259-
122.406487507547.6523091071-
122.350004524747.6692278094-
122.335173722547.6822606054-
122.343449998947.6214209585-
122.316419530747.5550843545-
122.264553261547.6189390326-
122.292123417847.5837867009-122.316769676847.612313045-
122.298252155447.6500847223-
122.319314511347.6699213774-
122.401463847947.6129415063-
122.312635956847.6276735193-
122.358610808547.5114571958-
122.256080995947.6354817084-
122.358477761647.6441308606-
122.356299165347.5454306533-
122.397837271247.5528423227-
122.277893570747.5821599678-
122.393871524847.5357006476-
122.386312408247.5960491227-
122.317850102147.6777046524-
122.359838852147.6800375715-122.283983427847.621627392-
122.316929307647.699898373-122.366141804747.5612970384-
122.281218607147.6153386452-122.34790529347.682309278-
122.378749661947.6569247665-
122.360934882347.6757467839-
122.357389082847.6138602018-
122.348787339147.6778094417-
122.358621319947.6896610846-
122.368394178547.6611973366-
122.401445522947.5496907093-
122.318679113447.6680705341-122.3620861647.5782293013-
122.411812120547.7063897406-
122.280745621747.5732655583-
122.374361170747.6432862428-
122.375818622447.6362890384-122.371025247.6705794109-
122.323632518447.5814326781-122.394109027847.67716562-
122.361692831547.6837806708-
122.342012818947.5752909722-
122.302048733947.6981811943-
122.387101329647.6157753482-
122.348718584147.6160746943-122.34667747747.6329184028-
122.37247063447.6812254063-122.379711402447.5937973205-
122.305148836247.6198828241-
122.319612564247.6575891112-
122.354376195647.6114811167-
122.329121063747.6152320255-122.347027420647.614972824-
122.348554496847.644810466-122.324285142147.6464213197-
122.324953750947.6233621581-
122.316677816247.6563340605-
122.349977532747.5958290744-
122.297884216947.6189713884-
122.324207191247.6558849377-
122.332135968947.6234428298-122.30658692547.6103771172-
122.311565836547.6136745639-
122.322028272147.5800288098-
122.390251091847.5050883437-
122.378238815747.6500516073-
122.321101330747.6130430105-
122.323214212947.6835447395-
122.330911144447.6834831487-122.357053886747.666229972-
122.360696908947.6256981038-122.32095362247.628365679-
122.326260468947.6217782547-122.323787088847.676753104-
122.293971845747.5851302744-
122.315261446647.5757694805-
122.316362088547.6581070148-
122.357388977247.6598921769-
122.330428833547.6755332684-
122.376324014147.6090700187-
122.296132610247.6992161483-
122.350716020847.6588313139-
122.347966513247.6541015659-
122.338510944247.6852808972-122.34315760247.615827761-
122.34077729947.5696575879-122.361711277547.6852324694-
122.289434643747.7135183282-
122.358735286647.6839408813-
122.373045532647.6973600413-
122.376222211847.6689948071-
122.402800638747.7179619172-
122.291140673447.6278521271-
122.298714842647.6542975861-
122.352588507447.6117183145-
122.343684974347.5605111091-122.27894830147.7029543964-
122.368611502247.6780459888-
122.360425546547.6585389006-122.32581803247.6787125823-
122.360664363847.5699913111-
122.360713734647.6364168374-
122.341243881347.5688564595-
122.361843923147.5366044051-
122.356052313747.6208177429-
122.356335311147.6493265813-
122.319245602947.6836234235-
122.288278251647.6196773839-
122.324147043747.5791652603-
122.292118994547.5795538805-
122.293685620347.6209347612-
122.298146744347.7015512911-
122.366511276147.5494561115-122.31657741647.6135485752-
122.321305398947.6877821424-
122.348596091347.5622061778-122.38597831647.6143636866-
122.331716188147.5775607823-
122.304280664247.6986129648-
122.363442379647.6965616389-
122.362750743647.5696153458-
122.293955301547.6565084085-
122.360570570647.5772706959-
122.301857092947.6636953872-122.33622518147.518552187-
122.391188202747.613483112-122.348432111447.6615375113-
122.313591080847.6516086237-
122.356066470547.6097485679-122.29010858147.6558721093-
122.356883912847.6123428474-122.329721846447.526971086-
122.272650426147.6459738129-
122.362324331247.6037507448-
122.308117076947.6242335889-
122.290418626947.7261976611-
122.301490146147.7255570168-
122.302399343647.6910934857-
122.364640020647.5684082524-
122.286214045247.5494823544-
122.317787771947.5292447862-
122.358525056947.5924299848-
122.301900251247.7227266354-
122.356684276647.6325968957-
122.398798959847.5625275097-
122.292439795147.6716905009-
122.385239065247.6524341561-
122.337853312947.6421518092-
122.369592775747.6433899897-
122.325821949447.5654363033-
122.390756506847.6389730057-
122.324887806947.6380629005-
122.277922831847.6674564047-
122.359880435147.6299568633-122.308609952647.619662372-
122.289556538747.6965313153-
122.317258767147.6190565218-
122.319734043947.5554631737-
122.272183819947.6794466877-
122.363549450347.6207252047-
122.317150245747.5737539459-
122.292719910247.6315263596-122.358426776147.566740773-
122.381084067947.6090318632-122.31548085247.5793103478-
122.292886018447.6337693483-
122.311949790147.6063162173-
122.294826208347.6067368958-122.29008773647.5514219196-
122.2808747054
Seattle
Datahost_nameneighbourhoodlatitudelongituderoom_typepricen
umber_of_reviewsMeganMadrona47.6108192763-
122.2908160022Entire home/apt29621Jess &
JoeyRoosevelt47.6878010086-122.3134272739Private
room8263MaddySouth Delridge47.5239795043-
122.3598905991Entire
home/apt48462JoyceWallingford47.6541086069-
122.3376052882Entire
home/apt90134AngielenaGeorgetown47.5506196981-
122.3201354141Private room65131SienaFirst
Hill47.6080099819-122.3287386699Private
room79406CassieFairmount Park47.5553892558-
122.3847386271Entire home/apt16536CassieFairmount
Park47.5562356536-122.3859805062Entire
home/apt12536JoyceWallingford47.654787431-
122.3365198846Entire home/apt12076LauraFairmount
Park47.5652091275-122.3737475168Entire home/apt12557Mike
& CassandraHigh Point47.5536456857-122.3632573252Private
room5036Jess & JoeyMaple Leaf47.6957185793-
122.3119439187Private room6094Jess & JoeyMaple
Leaf47.6972009726-122.313481029Private
room10920JoyceWallingford47.6544767899-
122.3364642629Entire home/apt29980Jess & JoeyMaple
Leaf47.6957369531-122.313163408Private room6073BobGreen
Lake47.6872456761-122.3346957024Private
room40126BobGreen Lake47.6882655474-
122.335855524Private room6070AngelaGreen
Lake47.6840722784-122.3264884321Private
room10017LauraFairmount Park47.555381734-
122.386222631Entire home/apt10591Seattle
OasisBelltown47.6136155346-122.3470578149Entire
home/apt14579Jess & JoeyMaple Leaf47.6953856705-
122.3130749476Entire home/apt199121Brad /
LizAdams47.6733393883-122.395120282Entire
home/apt89502Brad / LizAdams47.6736070968-
122.3938028594Private room79279IanBroadway47.622366025-
122.3159180004Entire home/apt200100TonyhaiHolly
Park47.5341884029-122.2813932344Entire
home/apt18919Seattle OasisBelltown47.6153962664-
122.3486637459Entire home/apt15779AmandaWhittier
Heights47.6794116899-122.3705396261Entire
home/apt70698JamilahBroadway47.6174259787-
122.3267562717Entire
home/apt259143KellyEastlake47.6395260756-
122.3283787422Entire home/apt16559AlLoyal
Heights47.6789013609-122.3818632746Entire
home/apt7586TonyhaiSouth Park47.5254361097-
122.3290193368Entire home/apt2855DarrellLoyal
Heights47.6880480751-122.3923099994Entire
home/apt853SethWallingford47.6526306369-
122.3422171445Entire home/apt22594PinaMid-Beacon
Hill47.5603489768-122.3140231906Entire
home/apt9528MichaelWallingford47.6505515559-
122.3305886625Private
room55234CarolWedgwood47.6924645956-
122.2868837689Private room5544Piper +
KentWindermere47.6715870433-122.259947404Entire
home/apt11039MarieGenesee47.5664287096-
122.380842213Entire home/apt24929Gus & ChelseaPhinney
Ridge47.6794670377-122.3566000815Entire
home/apt75219IrmgardWest Woodland47.6717143403-
122.3658875979Entire
home/apt76216CarolWedgwood47.6942077243-
122.2862491662Private
room5025CarolWedgwood47.6928151492-
122.2853364671Private room4025JeanSeward
Park47.5616814291-122.272122828Private
room70178GoldieBroadway47.6258516153-
122.3200413234Entire home/apt11015JaneNorth
Admiral47.582391548-122.3944776132Private
room7563TrungGreen Lake47.6842730779-
122.326615922Entire home/apt15017TrungGreen
Lake47.6841569098-122.3259721542Entire
home/apt25019AnneNorth Admiral47.5799961341-
122.4020445001Entire home/apt79118Roberta & DanHaller
Lake47.7148851918-122.3329636496Entire
home/apt120222MaryMid-Beacon Hill47.5525663188-
122.3043496443Entire
home/apt13057DanniFremont47.6543710193-
122.3574537832Entire
home/apt12539JudithAlki47.5687392259-
122.4064875075Private
room100126HalFremont47.6523091071-122.3500045247Entire
home/apt79352RalphWallingford47.6692278094-
122.3351737225Entire home/apt11092NatalieGreen
Lake47.6822606054-122.3434499989Entire
home/apt150251JoeBroadway47.6214209585-
122.3164195307Entire home/apt170154ShariSeward
Park47.5550843545-122.2645532615Private
room8556JanaHarrison/Denny-Blaine47.6189390326-
122.2921234178Private room75140JanaNorth Beacon
Hill47.5837867009-122.3167696768Private
room89348JulieMann47.612313045-122.2982521554Entire
home/apt68344TaraPortage Bay47.6500847223-
122.3193145113Entire home/apt24916MarciaSunset
Hill47.6699213774-122.4014638479Private
room60413DesmondMinor47.6129415063-
122.3126359568Private room909NadineLower Queen
Anne47.6276735193-122.3586108085Entire
home/apt750207MichelleRainier Beach47.5114571958-
122.2560809959Private room8836Ray & EileenWest Queen
Anne47.6354817084-122.3584777616Entire
home/apt85279AndrewNorth Queen Anne47.6441308606-
122.3562991653Entire
home/apt2501HarrietSeaview47.5454306533-
122.3978372712Entire home/apt78260DeniseColumbia
City47.5528423227-122.2778935707Entire
home/apt80153VidyaNorth Admiral47.5821599678-
122.3938715248Private
room5979AmyGatewood47.5357006476-122.3863124082Entire
home/apt89165AprylInternational District47.5960491227-
122.3178501021Entire home/apt15920Tim And PamPhinney
Ridge47.6777046524-122.3598388521Entire
home/apt24522KerryView Ridge47.6800375715-
122.2839834278Entire
home/apt99143DavidBroadway47.621627392-
122.3169293076Entire home/apt212131FlorCrown
Hill47.699898373-122.3661418047Private
room8067JulieColumbia City47.5612970384-
122.2812186071Entire
home/apt80340LoriBelltown47.6153386452-
122.347905293Entire home/apt200138Corinne & TomLoyal
Heights47.682309278-122.3787496619Private room90131Rose
And GlenFremont47.6569247665-122.3609348823Entire
home/apt27576JudithPhinney Ridge47.6757467839-
122.3573890828Private room7530LoriBelltown47.6138602018-
122.3487873391Entire home/apt13989JudithPhinney
Ridge47.6778094417-122.3586213199Private room9083Rose
And GlenWhittier Heights47.6896610846-
122.3683941785Entire home/apt17081CherylLawton
Park47.6611973366-122.4014455229Private
room46167AngielenaGeorgetown47.5496907093-
122.3186791134Private room55134MichaelWest
Woodland47.6680705341-122.36208616Entire
home/apt120212WayneAlki47.5782293013-
122.4118121205Entire home/apt1602PaulMatthews
Beach47.7063897406-122.2807456217Private
room54142DanielleNorth Admiral47.5732655583-
122.3743611707Private room601MaijaNorth Queen
Anne47.6432862428-122.3758186224Entire
Climate-driven declines in arthropod abundancerestructure a .docx

More Related Content

Similar to Climate-driven declines in arthropod abundancerestructure a .docx

Ecological Effects
Ecological EffectsEcological Effects
Ecological EffectsNicole Cocco
 
The 2023 state of the climate report: Entering uncharted territory
The 2023 state of the climate report: Entering uncharted territoryThe 2023 state of the climate report: Entering uncharted territory
The 2023 state of the climate report: Entering uncharted territoryEnergy for One World
 
Climate Increases Regional Tree Growth Variability In Iberian Pine Forests
Climate Increases Regional Tree Growth Variability In Iberian Pine ForestsClimate Increases Regional Tree Growth Variability In Iberian Pine Forests
Climate Increases Regional Tree Growth Variability In Iberian Pine ForestsHibrids
 
IMPACT OF CLIMATE CHANGE
IMPACT OF CLIMATE CHANGEIMPACT OF CLIMATE CHANGE
IMPACT OF CLIMATE CHANGEAnilKoirala
 
A High Grassland Bee Community in Southern Brazil: Survey and Annotated Check...
A High Grassland Bee Community in Southern Brazil: Survey and Annotated Check...A High Grassland Bee Community in Southern Brazil: Survey and Annotated Check...
A High Grassland Bee Community in Southern Brazil: Survey and Annotated Check...Label-ha
 
Forestry effects on stream invertebrate communities
Forestry effects on stream invertebrate communitiesForestry effects on stream invertebrate communities
Forestry effects on stream invertebrate communitiesRodolfo Santos
 
Water-related bird assemblages in an urban pond ‘archipelago’: Winter pattern...
Water-related bird assemblages in an urban pond ‘archipelago’: Winter pattern...Water-related bird assemblages in an urban pond ‘archipelago’: Winter pattern...
Water-related bird assemblages in an urban pond ‘archipelago’: Winter pattern...Maria Paola Di Santo
 
LONG YEARS COMPARATIVE CLIMATE CHANGE TREND ANALYSIS IN TERMS OF TEMPERATURE,...
LONG YEARS COMPARATIVE CLIMATE CHANGE TREND ANALYSIS IN TERMS OF TEMPERATURE,...LONG YEARS COMPARATIVE CLIMATE CHANGE TREND ANALYSIS IN TERMS OF TEMPERATURE,...
LONG YEARS COMPARATIVE CLIMATE CHANGE TREND ANALYSIS IN TERMS OF TEMPERATURE,...Surendra Bam
 
patterns and determinants of floristic variation across lowland forests of bo...
patterns and determinants of floristic variation across lowland forests of bo...patterns and determinants of floristic variation across lowland forests of bo...
patterns and determinants of floristic variation across lowland forests of bo...Valderes Sarnaglia
 
PROJECT OF THE TITLE PROPOSAL FINL FOR COFFE
PROJECT OF THE TITLE PROPOSAL FINL FOR COFFEPROJECT OF THE TITLE PROPOSAL FINL FOR COFFE
PROJECT OF THE TITLE PROPOSAL FINL FOR COFFEterefa1234
 
Patz et al_2005
Patz et al_2005Patz et al_2005
Patz et al_2005Luz Marina
 
WOODY PLANT RICHNESS AND NDVI RESPONSE TO DROUGHT EVENTS IN CATALONIAN (NORT...
WOODY PLANT RICHNESS AND NDVI RESPONSE TO DROUGHT EVENTS  IN CATALONIAN (NORT...WOODY PLANT RICHNESS AND NDVI RESPONSE TO DROUGHT EVENTS  IN CATALONIAN (NORT...
WOODY PLANT RICHNESS AND NDVI RESPONSE TO DROUGHT EVENTS IN CATALONIAN (NORT...Hibrids
 
Climate change: Changes in the biosphere
Climate change: Changes in the biosphereClimate change: Changes in the biosphere
Climate change: Changes in the biospherecdenef
 
Global Warming Effects On Humans
Global Warming Effects On HumansGlobal Warming Effects On Humans
Global Warming Effects On HumansOsle Vera Sarmiento
 

Similar to Climate-driven declines in arthropod abundancerestructure a .docx (20)

Ecological Effects
Ecological EffectsEcological Effects
Ecological Effects
 
The 2023 state of the climate report: Entering uncharted territory
The 2023 state of the climate report: Entering uncharted territoryThe 2023 state of the climate report: Entering uncharted territory
The 2023 state of the climate report: Entering uncharted territory
 
Climate Increases Regional Tree Growth Variability In Iberian Pine Forests
Climate Increases Regional Tree Growth Variability In Iberian Pine ForestsClimate Increases Regional Tree Growth Variability In Iberian Pine Forests
Climate Increases Regional Tree Growth Variability In Iberian Pine Forests
 
Workshop climate variability and modeling in Laos
Workshop climate variability and modeling in LaosWorkshop climate variability and modeling in Laos
Workshop climate variability and modeling in Laos
 
IMPACT OF CLIMATE CHANGE
IMPACT OF CLIMATE CHANGEIMPACT OF CLIMATE CHANGE
IMPACT OF CLIMATE CHANGE
 
A High Grassland Bee Community in Southern Brazil: Survey and Annotated Check...
A High Grassland Bee Community in Southern Brazil: Survey and Annotated Check...A High Grassland Bee Community in Southern Brazil: Survey and Annotated Check...
A High Grassland Bee Community in Southern Brazil: Survey and Annotated Check...
 
Essay Climate Change
Essay Climate ChangeEssay Climate Change
Essay Climate Change
 
Meteorology assignment
Meteorology assignmentMeteorology assignment
Meteorology assignment
 
Forestry effects on stream invertebrate communities
Forestry effects on stream invertebrate communitiesForestry effects on stream invertebrate communities
Forestry effects on stream invertebrate communities
 
Water-related bird assemblages in an urban pond ‘archipelago’: Winter pattern...
Water-related bird assemblages in an urban pond ‘archipelago’: Winter pattern...Water-related bird assemblages in an urban pond ‘archipelago’: Winter pattern...
Water-related bird assemblages in an urban pond ‘archipelago’: Winter pattern...
 
LONG YEARS COMPARATIVE CLIMATE CHANGE TREND ANALYSIS IN TERMS OF TEMPERATURE,...
LONG YEARS COMPARATIVE CLIMATE CHANGE TREND ANALYSIS IN TERMS OF TEMPERATURE,...LONG YEARS COMPARATIVE CLIMATE CHANGE TREND ANALYSIS IN TERMS OF TEMPERATURE,...
LONG YEARS COMPARATIVE CLIMATE CHANGE TREND ANALYSIS IN TERMS OF TEMPERATURE,...
 
patterns and determinants of floristic variation across lowland forests of bo...
patterns and determinants of floristic variation across lowland forests of bo...patterns and determinants of floristic variation across lowland forests of bo...
patterns and determinants of floristic variation across lowland forests of bo...
 
Farrington Final Draft
Farrington Final DraftFarrington Final Draft
Farrington Final Draft
 
PROJECT OF THE TITLE PROPOSAL FINL FOR COFFE
PROJECT OF THE TITLE PROPOSAL FINL FOR COFFEPROJECT OF THE TITLE PROPOSAL FINL FOR COFFE
PROJECT OF THE TITLE PROPOSAL FINL FOR COFFE
 
Patz et al_2005
Patz et al_2005Patz et al_2005
Patz et al_2005
 
WOODY PLANT RICHNESS AND NDVI RESPONSE TO DROUGHT EVENTS IN CATALONIAN (NORT...
WOODY PLANT RICHNESS AND NDVI RESPONSE TO DROUGHT EVENTS  IN CATALONIAN (NORT...WOODY PLANT RICHNESS AND NDVI RESPONSE TO DROUGHT EVENTS  IN CATALONIAN (NORT...
WOODY PLANT RICHNESS AND NDVI RESPONSE TO DROUGHT EVENTS IN CATALONIAN (NORT...
 
Climate change: Changes in the biosphere
Climate change: Changes in the biosphereClimate change: Changes in the biosphere
Climate change: Changes in the biosphere
 
Science physics
Science physicsScience physics
Science physics
 
Science physics
Science physicsScience physics
Science physics
 
Global Warming Effects On Humans
Global Warming Effects On HumansGlobal Warming Effects On Humans
Global Warming Effects On Humans
 

More from bartholomeocoombs

CompetencyAnalyze how human resource standards and practices.docx
CompetencyAnalyze how human resource standards and practices.docxCompetencyAnalyze how human resource standards and practices.docx
CompetencyAnalyze how human resource standards and practices.docxbartholomeocoombs
 
CompetencyAnalyze financial statements to assess performance.docx
CompetencyAnalyze financial statements to assess performance.docxCompetencyAnalyze financial statements to assess performance.docx
CompetencyAnalyze financial statements to assess performance.docxbartholomeocoombs
 
CompetencyAnalyze ethical and legal dilemmas that healthcare.docx
CompetencyAnalyze ethical and legal dilemmas that healthcare.docxCompetencyAnalyze ethical and legal dilemmas that healthcare.docx
CompetencyAnalyze ethical and legal dilemmas that healthcare.docxbartholomeocoombs
 
CompetencyAnalyze ethical and legal dilemmas that healthcare wor.docx
CompetencyAnalyze ethical and legal dilemmas that healthcare wor.docxCompetencyAnalyze ethical and legal dilemmas that healthcare wor.docx
CompetencyAnalyze ethical and legal dilemmas that healthcare wor.docxbartholomeocoombs
 
CompetencyAnalyze collaboration tools to support organizatio.docx
CompetencyAnalyze collaboration tools to support organizatio.docxCompetencyAnalyze collaboration tools to support organizatio.docx
CompetencyAnalyze collaboration tools to support organizatio.docxbartholomeocoombs
 
Competency Checklist and Professional Development Resources .docx
Competency Checklist and Professional Development Resources .docxCompetency Checklist and Professional Development Resources .docx
Competency Checklist and Professional Development Resources .docxbartholomeocoombs
 
Competency 6 Enagage with Communities and Organizations (3 hrs) (1 .docx
Competency 6 Enagage with Communities and Organizations (3 hrs) (1 .docxCompetency 6 Enagage with Communities and Organizations (3 hrs) (1 .docx
Competency 6 Enagage with Communities and Organizations (3 hrs) (1 .docxbartholomeocoombs
 
Competency 2 Examine the organizational behavior within busines.docx
Competency 2 Examine the organizational behavior within busines.docxCompetency 2 Examine the organizational behavior within busines.docx
Competency 2 Examine the organizational behavior within busines.docxbartholomeocoombs
 
CompetenciesEvaluate the challenges and benefits of employ.docx
CompetenciesEvaluate the challenges and benefits of employ.docxCompetenciesEvaluate the challenges and benefits of employ.docx
CompetenciesEvaluate the challenges and benefits of employ.docxbartholomeocoombs
 
CompetenciesDescribe the supply chain management principle.docx
CompetenciesDescribe the supply chain management principle.docxCompetenciesDescribe the supply chain management principle.docx
CompetenciesDescribe the supply chain management principle.docxbartholomeocoombs
 
CompetenciesABCDF1.1 Create oral, written, or visual .docx
CompetenciesABCDF1.1 Create oral, written, or visual .docxCompetenciesABCDF1.1 Create oral, written, or visual .docx
CompetenciesABCDF1.1 Create oral, written, or visual .docxbartholomeocoombs
 
COMPETENCIES734.3.4 Healthcare Utilization and Finance.docx
COMPETENCIES734.3.4  Healthcare Utilization and Finance.docxCOMPETENCIES734.3.4  Healthcare Utilization and Finance.docx
COMPETENCIES734.3.4 Healthcare Utilization and Finance.docxbartholomeocoombs
 
Competencies and KnowledgeWhat competencies were you able to dev.docx
Competencies and KnowledgeWhat competencies were you able to dev.docxCompetencies and KnowledgeWhat competencies were you able to dev.docx
Competencies and KnowledgeWhat competencies were you able to dev.docxbartholomeocoombs
 
Competencies and KnowledgeThis assignment has 2 parts.docx
Competencies and KnowledgeThis assignment has 2 parts.docxCompetencies and KnowledgeThis assignment has 2 parts.docx
Competencies and KnowledgeThis assignment has 2 parts.docxbartholomeocoombs
 
Competencies and KnowledgeThis assignment has 2 partsWhat.docx
Competencies and KnowledgeThis assignment has 2 partsWhat.docxCompetencies and KnowledgeThis assignment has 2 partsWhat.docx
Competencies and KnowledgeThis assignment has 2 partsWhat.docxbartholomeocoombs
 
Competences, Learning Theories and MOOCsRecent Developments.docx
Competences, Learning Theories and MOOCsRecent Developments.docxCompetences, Learning Theories and MOOCsRecent Developments.docx
Competences, Learning Theories and MOOCsRecent Developments.docxbartholomeocoombs
 
Compensation  & Benefits Class 700 words with referencesA stra.docx
Compensation  & Benefits Class 700 words with referencesA stra.docxCompensation  & Benefits Class 700 words with referencesA stra.docx
Compensation  & Benefits Class 700 words with referencesA stra.docxbartholomeocoombs
 
Compensation, Benefits, Reward & Recognition Plan for V..docx
Compensation, Benefits, Reward & Recognition Plan for V..docxCompensation, Benefits, Reward & Recognition Plan for V..docx
Compensation, Benefits, Reward & Recognition Plan for V..docxbartholomeocoombs
 
Compete the following tablesTheoryKey figuresKey concepts o.docx
Compete the following tablesTheoryKey figuresKey concepts o.docxCompete the following tablesTheoryKey figuresKey concepts o.docx
Compete the following tablesTheoryKey figuresKey concepts o.docxbartholomeocoombs
 
Compensation Strategy for Knowledge WorkersTo prepare for this a.docx
Compensation Strategy for Knowledge WorkersTo prepare for this a.docxCompensation Strategy for Knowledge WorkersTo prepare for this a.docx
Compensation Strategy for Knowledge WorkersTo prepare for this a.docxbartholomeocoombs
 

More from bartholomeocoombs (20)

CompetencyAnalyze how human resource standards and practices.docx
CompetencyAnalyze how human resource standards and practices.docxCompetencyAnalyze how human resource standards and practices.docx
CompetencyAnalyze how human resource standards and practices.docx
 
CompetencyAnalyze financial statements to assess performance.docx
CompetencyAnalyze financial statements to assess performance.docxCompetencyAnalyze financial statements to assess performance.docx
CompetencyAnalyze financial statements to assess performance.docx
 
CompetencyAnalyze ethical and legal dilemmas that healthcare.docx
CompetencyAnalyze ethical and legal dilemmas that healthcare.docxCompetencyAnalyze ethical and legal dilemmas that healthcare.docx
CompetencyAnalyze ethical and legal dilemmas that healthcare.docx
 
CompetencyAnalyze ethical and legal dilemmas that healthcare wor.docx
CompetencyAnalyze ethical and legal dilemmas that healthcare wor.docxCompetencyAnalyze ethical and legal dilemmas that healthcare wor.docx
CompetencyAnalyze ethical and legal dilemmas that healthcare wor.docx
 
CompetencyAnalyze collaboration tools to support organizatio.docx
CompetencyAnalyze collaboration tools to support organizatio.docxCompetencyAnalyze collaboration tools to support organizatio.docx
CompetencyAnalyze collaboration tools to support organizatio.docx
 
Competency Checklist and Professional Development Resources .docx
Competency Checklist and Professional Development Resources .docxCompetency Checklist and Professional Development Resources .docx
Competency Checklist and Professional Development Resources .docx
 
Competency 6 Enagage with Communities and Organizations (3 hrs) (1 .docx
Competency 6 Enagage with Communities and Organizations (3 hrs) (1 .docxCompetency 6 Enagage with Communities and Organizations (3 hrs) (1 .docx
Competency 6 Enagage with Communities and Organizations (3 hrs) (1 .docx
 
Competency 2 Examine the organizational behavior within busines.docx
Competency 2 Examine the organizational behavior within busines.docxCompetency 2 Examine the organizational behavior within busines.docx
Competency 2 Examine the organizational behavior within busines.docx
 
CompetenciesEvaluate the challenges and benefits of employ.docx
CompetenciesEvaluate the challenges and benefits of employ.docxCompetenciesEvaluate the challenges and benefits of employ.docx
CompetenciesEvaluate the challenges and benefits of employ.docx
 
CompetenciesDescribe the supply chain management principle.docx
CompetenciesDescribe the supply chain management principle.docxCompetenciesDescribe the supply chain management principle.docx
CompetenciesDescribe the supply chain management principle.docx
 
CompetenciesABCDF1.1 Create oral, written, or visual .docx
CompetenciesABCDF1.1 Create oral, written, or visual .docxCompetenciesABCDF1.1 Create oral, written, or visual .docx
CompetenciesABCDF1.1 Create oral, written, or visual .docx
 
COMPETENCIES734.3.4 Healthcare Utilization and Finance.docx
COMPETENCIES734.3.4  Healthcare Utilization and Finance.docxCOMPETENCIES734.3.4  Healthcare Utilization and Finance.docx
COMPETENCIES734.3.4 Healthcare Utilization and Finance.docx
 
Competencies and KnowledgeWhat competencies were you able to dev.docx
Competencies and KnowledgeWhat competencies were you able to dev.docxCompetencies and KnowledgeWhat competencies were you able to dev.docx
Competencies and KnowledgeWhat competencies were you able to dev.docx
 
Competencies and KnowledgeThis assignment has 2 parts.docx
Competencies and KnowledgeThis assignment has 2 parts.docxCompetencies and KnowledgeThis assignment has 2 parts.docx
Competencies and KnowledgeThis assignment has 2 parts.docx
 
Competencies and KnowledgeThis assignment has 2 partsWhat.docx
Competencies and KnowledgeThis assignment has 2 partsWhat.docxCompetencies and KnowledgeThis assignment has 2 partsWhat.docx
Competencies and KnowledgeThis assignment has 2 partsWhat.docx
 
Competences, Learning Theories and MOOCsRecent Developments.docx
Competences, Learning Theories and MOOCsRecent Developments.docxCompetences, Learning Theories and MOOCsRecent Developments.docx
Competences, Learning Theories and MOOCsRecent Developments.docx
 
Compensation  & Benefits Class 700 words with referencesA stra.docx
Compensation  & Benefits Class 700 words with referencesA stra.docxCompensation  & Benefits Class 700 words with referencesA stra.docx
Compensation  & Benefits Class 700 words with referencesA stra.docx
 
Compensation, Benefits, Reward & Recognition Plan for V..docx
Compensation, Benefits, Reward & Recognition Plan for V..docxCompensation, Benefits, Reward & Recognition Plan for V..docx
Compensation, Benefits, Reward & Recognition Plan for V..docx
 
Compete the following tablesTheoryKey figuresKey concepts o.docx
Compete the following tablesTheoryKey figuresKey concepts o.docxCompete the following tablesTheoryKey figuresKey concepts o.docx
Compete the following tablesTheoryKey figuresKey concepts o.docx
 
Compensation Strategy for Knowledge WorkersTo prepare for this a.docx
Compensation Strategy for Knowledge WorkersTo prepare for this a.docxCompensation Strategy for Knowledge WorkersTo prepare for this a.docx
Compensation Strategy for Knowledge WorkersTo prepare for this a.docx
 

Recently uploaded

Class 11 Legal Studies Ch-1 Concept of State .pdf
Class 11 Legal Studies Ch-1 Concept of State .pdfClass 11 Legal Studies Ch-1 Concept of State .pdf
Class 11 Legal Studies Ch-1 Concept of State .pdfakmcokerachita
 
How to Configure Email Server in Odoo 17
How to Configure Email Server in Odoo 17How to Configure Email Server in Odoo 17
How to Configure Email Server in Odoo 17Celine George
 
Proudly South Africa powerpoint Thorisha.pptx
Proudly South Africa powerpoint Thorisha.pptxProudly South Africa powerpoint Thorisha.pptx
Proudly South Africa powerpoint Thorisha.pptxthorishapillay1
 
Final demo Grade 9 for demo Plan dessert.pptx
Final demo Grade 9 for demo Plan dessert.pptxFinal demo Grade 9 for demo Plan dessert.pptx
Final demo Grade 9 for demo Plan dessert.pptxAvyJaneVismanos
 
Mastering the Unannounced Regulatory Inspection
Mastering the Unannounced Regulatory InspectionMastering the Unannounced Regulatory Inspection
Mastering the Unannounced Regulatory InspectionSafetyChain Software
 
Crayon Activity Handout For the Crayon A
Crayon Activity Handout For the Crayon ACrayon Activity Handout For the Crayon A
Crayon Activity Handout For the Crayon AUnboundStockton
 
call girls in Kamla Market (DELHI) 🔝 >༒9953330565🔝 genuine Escort Service 🔝✔️✔️
call girls in Kamla Market (DELHI) 🔝 >༒9953330565🔝 genuine Escort Service 🔝✔️✔️call girls in Kamla Market (DELHI) 🔝 >༒9953330565🔝 genuine Escort Service 🔝✔️✔️
call girls in Kamla Market (DELHI) 🔝 >༒9953330565🔝 genuine Escort Service 🔝✔️✔️9953056974 Low Rate Call Girls In Saket, Delhi NCR
 
Painted Grey Ware.pptx, PGW Culture of India
Painted Grey Ware.pptx, PGW Culture of IndiaPainted Grey Ware.pptx, PGW Culture of India
Painted Grey Ware.pptx, PGW Culture of IndiaVirag Sontakke
 
Call Girls in Dwarka Mor Delhi Contact Us 9654467111
Call Girls in Dwarka Mor Delhi Contact Us 9654467111Call Girls in Dwarka Mor Delhi Contact Us 9654467111
Call Girls in Dwarka Mor Delhi Contact Us 9654467111Sapana Sha
 
BASLIQ CURRENT LOOKBOOK LOOKBOOK(1) (1).pdf
BASLIQ CURRENT LOOKBOOK  LOOKBOOK(1) (1).pdfBASLIQ CURRENT LOOKBOOK  LOOKBOOK(1) (1).pdf
BASLIQ CURRENT LOOKBOOK LOOKBOOK(1) (1).pdfSoniaTolstoy
 
Kisan Call Centre - To harness potential of ICT in Agriculture by answer farm...
Kisan Call Centre - To harness potential of ICT in Agriculture by answer farm...Kisan Call Centre - To harness potential of ICT in Agriculture by answer farm...
Kisan Call Centre - To harness potential of ICT in Agriculture by answer farm...Krashi Coaching
 
Software Engineering Methodologies (overview)
Software Engineering Methodologies (overview)Software Engineering Methodologies (overview)
Software Engineering Methodologies (overview)eniolaolutunde
 
Presiding Officer Training module 2024 lok sabha elections
Presiding Officer Training module 2024 lok sabha electionsPresiding Officer Training module 2024 lok sabha elections
Presiding Officer Training module 2024 lok sabha electionsanshu789521
 
ECONOMIC CONTEXT - LONG FORM TV DRAMA - PPT
ECONOMIC CONTEXT - LONG FORM TV DRAMA - PPTECONOMIC CONTEXT - LONG FORM TV DRAMA - PPT
ECONOMIC CONTEXT - LONG FORM TV DRAMA - PPTiammrhaywood
 
Incoming and Outgoing Shipments in 1 STEP Using Odoo 17
Incoming and Outgoing Shipments in 1 STEP Using Odoo 17Incoming and Outgoing Shipments in 1 STEP Using Odoo 17
Incoming and Outgoing Shipments in 1 STEP Using Odoo 17Celine George
 
A Critique of the Proposed National Education Policy Reform
A Critique of the Proposed National Education Policy ReformA Critique of the Proposed National Education Policy Reform
A Critique of the Proposed National Education Policy ReformChameera Dedduwage
 
Hybridoma Technology ( Production , Purification , and Application )
Hybridoma Technology  ( Production , Purification , and Application  ) Hybridoma Technology  ( Production , Purification , and Application  )
Hybridoma Technology ( Production , Purification , and Application ) Sakshi Ghasle
 
internship ppt on smartinternz platform as salesforce developer
internship ppt on smartinternz platform as salesforce developerinternship ppt on smartinternz platform as salesforce developer
internship ppt on smartinternz platform as salesforce developerunnathinaik
 
18-04-UA_REPORT_MEDIALITERAСY_INDEX-DM_23-1-final-eng.pdf
18-04-UA_REPORT_MEDIALITERAСY_INDEX-DM_23-1-final-eng.pdf18-04-UA_REPORT_MEDIALITERAСY_INDEX-DM_23-1-final-eng.pdf
18-04-UA_REPORT_MEDIALITERAСY_INDEX-DM_23-1-final-eng.pdfssuser54595a
 
Introduction to ArtificiaI Intelligence in Higher Education
Introduction to ArtificiaI Intelligence in Higher EducationIntroduction to ArtificiaI Intelligence in Higher Education
Introduction to ArtificiaI Intelligence in Higher Educationpboyjonauth
 

Recently uploaded (20)

Class 11 Legal Studies Ch-1 Concept of State .pdf
Class 11 Legal Studies Ch-1 Concept of State .pdfClass 11 Legal Studies Ch-1 Concept of State .pdf
Class 11 Legal Studies Ch-1 Concept of State .pdf
 
How to Configure Email Server in Odoo 17
How to Configure Email Server in Odoo 17How to Configure Email Server in Odoo 17
How to Configure Email Server in Odoo 17
 
Proudly South Africa powerpoint Thorisha.pptx
Proudly South Africa powerpoint Thorisha.pptxProudly South Africa powerpoint Thorisha.pptx
Proudly South Africa powerpoint Thorisha.pptx
 
Final demo Grade 9 for demo Plan dessert.pptx
Final demo Grade 9 for demo Plan dessert.pptxFinal demo Grade 9 for demo Plan dessert.pptx
Final demo Grade 9 for demo Plan dessert.pptx
 
Mastering the Unannounced Regulatory Inspection
Mastering the Unannounced Regulatory InspectionMastering the Unannounced Regulatory Inspection
Mastering the Unannounced Regulatory Inspection
 
Crayon Activity Handout For the Crayon A
Crayon Activity Handout For the Crayon ACrayon Activity Handout For the Crayon A
Crayon Activity Handout For the Crayon A
 
call girls in Kamla Market (DELHI) 🔝 >༒9953330565🔝 genuine Escort Service 🔝✔️✔️
call girls in Kamla Market (DELHI) 🔝 >༒9953330565🔝 genuine Escort Service 🔝✔️✔️call girls in Kamla Market (DELHI) 🔝 >༒9953330565🔝 genuine Escort Service 🔝✔️✔️
call girls in Kamla Market (DELHI) 🔝 >༒9953330565🔝 genuine Escort Service 🔝✔️✔️
 
Painted Grey Ware.pptx, PGW Culture of India
Painted Grey Ware.pptx, PGW Culture of IndiaPainted Grey Ware.pptx, PGW Culture of India
Painted Grey Ware.pptx, PGW Culture of India
 
Call Girls in Dwarka Mor Delhi Contact Us 9654467111
Call Girls in Dwarka Mor Delhi Contact Us 9654467111Call Girls in Dwarka Mor Delhi Contact Us 9654467111
Call Girls in Dwarka Mor Delhi Contact Us 9654467111
 
BASLIQ CURRENT LOOKBOOK LOOKBOOK(1) (1).pdf
BASLIQ CURRENT LOOKBOOK  LOOKBOOK(1) (1).pdfBASLIQ CURRENT LOOKBOOK  LOOKBOOK(1) (1).pdf
BASLIQ CURRENT LOOKBOOK LOOKBOOK(1) (1).pdf
 
Kisan Call Centre - To harness potential of ICT in Agriculture by answer farm...
Kisan Call Centre - To harness potential of ICT in Agriculture by answer farm...Kisan Call Centre - To harness potential of ICT in Agriculture by answer farm...
Kisan Call Centre - To harness potential of ICT in Agriculture by answer farm...
 
Software Engineering Methodologies (overview)
Software Engineering Methodologies (overview)Software Engineering Methodologies (overview)
Software Engineering Methodologies (overview)
 
Presiding Officer Training module 2024 lok sabha elections
Presiding Officer Training module 2024 lok sabha electionsPresiding Officer Training module 2024 lok sabha elections
Presiding Officer Training module 2024 lok sabha elections
 
ECONOMIC CONTEXT - LONG FORM TV DRAMA - PPT
ECONOMIC CONTEXT - LONG FORM TV DRAMA - PPTECONOMIC CONTEXT - LONG FORM TV DRAMA - PPT
ECONOMIC CONTEXT - LONG FORM TV DRAMA - PPT
 
Incoming and Outgoing Shipments in 1 STEP Using Odoo 17
Incoming and Outgoing Shipments in 1 STEP Using Odoo 17Incoming and Outgoing Shipments in 1 STEP Using Odoo 17
Incoming and Outgoing Shipments in 1 STEP Using Odoo 17
 
A Critique of the Proposed National Education Policy Reform
A Critique of the Proposed National Education Policy ReformA Critique of the Proposed National Education Policy Reform
A Critique of the Proposed National Education Policy Reform
 
Hybridoma Technology ( Production , Purification , and Application )
Hybridoma Technology  ( Production , Purification , and Application  ) Hybridoma Technology  ( Production , Purification , and Application  )
Hybridoma Technology ( Production , Purification , and Application )
 
internship ppt on smartinternz platform as salesforce developer
internship ppt on smartinternz platform as salesforce developerinternship ppt on smartinternz platform as salesforce developer
internship ppt on smartinternz platform as salesforce developer
 
18-04-UA_REPORT_MEDIALITERAСY_INDEX-DM_23-1-final-eng.pdf
18-04-UA_REPORT_MEDIALITERAСY_INDEX-DM_23-1-final-eng.pdf18-04-UA_REPORT_MEDIALITERAСY_INDEX-DM_23-1-final-eng.pdf
18-04-UA_REPORT_MEDIALITERAСY_INDEX-DM_23-1-final-eng.pdf
 
Introduction to ArtificiaI Intelligence in Higher Education
Introduction to ArtificiaI Intelligence in Higher EducationIntroduction to ArtificiaI Intelligence in Higher Education
Introduction to ArtificiaI Intelligence in Higher Education
 

Climate-driven declines in arthropod abundancerestructure a .docx

  • 1. Climate-driven declines in arthropod abundance restructure a rainforest food web Bradford C. Listera,1 and Andres Garciab aDepartment of Biological Sciences, Rensselaer Polytechnic University, Troy, NY 12180; and bEstación de Biología Chamela, Instituto de Biología, Universidad Nacional Autónoma de México, 47152 Chamela, Jalisco, Mexico Edited by Nils Christian Stenseth, University of Oslo, Oslo, Norway, and approved September 10, 2018 (received for review January 8, 2018) A number of studies indicate that tropical arthropods should be particularly vulnerable to climate warming. If these predictions are realized, climate warming may have a more profound impact on the functioning and diversity of tropical forests than currently anticipated. Although arthropods comprise over two-thirds of terres- trial species, information on their abundance and extinction rates in tropical habitats is severely limited. Here we analyze data on arthropod and insectivore abundances taken between 1976 and 2012 at two midelevation habitats in Puerto Rico’s Luquillo rainforest. During this time, mean maximum temperatures have risen by 2.0 °C. Using the same study area and methods employed by Lister in the 1970s, we discovered that the dry weight biomass of arthropods
  • 2. captured in sweep samples had declined 4 to 8 times, and 30 to 60 times in sticky traps. Analysis of long-term data on canopy arthro- pods and walking sticks taken as part of the Luquillo Long- Term Ecological Research program revealed sustained declines in abun- dance over two decades, as well as negative regressions of abun- dance on mean maximum temperatures. We also document parallel decreases in Luquillo’s insectivorous lizards, frogs, and birds. While El Niño/Southern Oscillation influences the abundance of forest arthro- pods, climate warming is the major driver of reductions in arthropod abundance, indirectly precipitating a bottom-up trophic cascade and consequent collapse of the forest food web. climate warming | rainforest | food web | arthropods | bottom-up cascade From pole to pole, climate warming is disrupting the biosphereat an accelerating pace. Despite generally lower rates of warming in tropical habitats (1), a growing body of theory and data suggests that tropical ectotherms may be particularly vulnerable to climate change (2). As Janzen (3) pointed out, tropical species that evolved in comparatively aseasonal environments should have nar- rower thermal niches, reduced acclimation to temperature
  • 3. fluctu- ations, and exist at or near their thermal optima. Consequently, even small increments in temperature can precipitate sharp de- creases in fitness and abundance. These predictions have been verified in a variety of tropical reptiles, amphibians, and inverte- brates (4–8). Given their abundance, diversity, and central roles as herbi- vores, pollinators, predators, and prey, the response of arthro- pods to climate change is of particular concern. Deutsch et al. (5) predicted that, for insects living at mid-to-high latitudes, rates of increase should grow as climate warms, while in the tropics in- sects should decline by as much as 20%. Reduction in population growth, combined with elevated metabolic rates, could poten- tially lower abundances and raise arthropod extinction rates. If these predictions are realized, climate warming may have an even more profound impact on the functioning and biodiversity of the Earth’s tropical forests than currently anticipated. Although arthropods comprise more than two-thirds of all terrestrial species and are centrally important to the ecological well-being of the Earth’s ecosystems, long-term data on pop- ulation abundance and extinction rates are severely limited (9). Studies documenting declines in insects have focused on tem- perate species (10–13), and have identified climate warming, along with habitat disturbance and insecticides, as primary causal mechanisms (9, 10). While demonstrated impacts of climate change on tropical forests include reductions in plant diversity (14), changes
  • 4. in plant species composition (15), and increases in tree growth, mortality, and biomass (16), little is known about the impact of climate warming on rainforest arthropods (17, 18). Here we analyze long-term data on climate change, arthropod abundance, and in- sectivores within the Luquillo rainforest in northeastern Puerto Rico, with the aim of determining if increases in ambient temper- ature may have driven reductions in arthropod numbers and asso- ciated decreases in consumer abundance. Results Climate Trends in the Luquillo Forest. Fig. 1 compares trends in mean maximum yearly temperature (MnMaxT) for the El Verde Field Station and Bisley Tower meteorological stations, both located at an altitude of 350 m. Between 1978 and 2015, MnMaxT at El Verde rose by 2.0 °C at an average rate of 0.050 °C per year. Between 1993 and 2015, the rate of temper- ature increase at Bisley Tower was 0.055 °C per year, not sig- nificantly different from the rate at El Verde. As several authors have pointed out, increased exposure to extreme temperatures may have a greater impact on fitness than gradual increases in average temperatures (6, 19, 20). At El Verde the proportion of maximum daily temperatures equal to or exceeding 29.0 °C increased significantly between 1978 and 2015 (SI Appendix, Fig. S8E). At the Bisley station, the pro- portion of maximum daily temperatures equal to or exceeding 29.0 °C grew steadily from the 1990s until 2015, with the pro- portion averaging 0.03 for 1993–1994 and 0.44 for 2014–2015. Significance Arthropods, invertebrates including insects that have external skeletons, are declining at an alarming rate. While the tropics
  • 5. harbor the majority of arthropod species, little is known about trends in their abundance. We compared arthropod biomass in Puerto Rico’s Luquillo rainforest with data taken during the 1970s and found that biomass had fallen 10 to 60 times. Our analyses revealed synchronous declines in the lizards, frogs, and birds that eat arthropods. Over the past 30 years, forest temperatures have risen 2.0 °C, and our study indicates that climate warming is the driving force behind the collapse of the forest’s food web. If supported by further research, the impact of climate change on tropical ecosystems may be much greater than currently anticipated. Author contributions: B.C.L. and A.G. designed research; B.C.L. and A.G. performed re- search; B.C.L. and A.G. analyzed data; and B.C.L. wrote the paper. The authors declare no conflict of interest. This article is a PNAS Direct Submission. This open access article is distributed under Creative Commons Attribution-NonCommercial- NoDerivatives License 4.0 (CC BY-NC-ND). 1To whom correspondence should be addressed. Email: [email protected] This article contains supporting information online at www.pnas.org/lookup/suppl/doi:10. 1073/pnas.1722477115/-/DCSupplemental. Published online October 15, 2018. www.pnas.org/cgi/doi/10.1073/pnas.1722477115 PNAS | vol. 115 | no. 44 | E10397–E10406 EC
  • 6. O LO G Y http://www.pnas.org/lookup/suppl/doi:10.1073/pnas.172247711 5/-/DCSupplemental http://crossmark.crossref.org/dialog/?doi=10.1073/pnas.1722477 115&domain=pdf https://creativecommons.org/licenses/by-nc-nd/4.0/ https://creativecommons.org/licenses/by-nc-nd/4.0/ mailto:[email protected] http://www.pnas.org/lookup/suppl/doi:10.1073/pnas.172247711 5/-/DCSupplemental http://www.pnas.org/lookup/suppl/doi:10.1073/pnas.172247711 5/-/DCSupplemental www.pnas.org/cgi/doi/10.1073/pnas.1722477115 While average temperatures increased 8–10% over the same period, the proportion of extreme temperatures increased 14 times. Because data from the Bisley and El Verde stations record just one maximum and minimum temperature per 24-h period, we could not calculate the duration of time that temperatures remained above the 29 °C extreme. However, there was a significant positive linear regression of proportion of days per year when the tem- perature equaled or exceeded 29 °C on MnMaxT at El Verde (SI Appendix, Fig. S8K), suggesting that our measure reflects signifi- cant exposure to extremes rather than ephemeral spikes in tem- perature (6, 20). From 1975 to 2015, rainfall at the El Verde station averaged
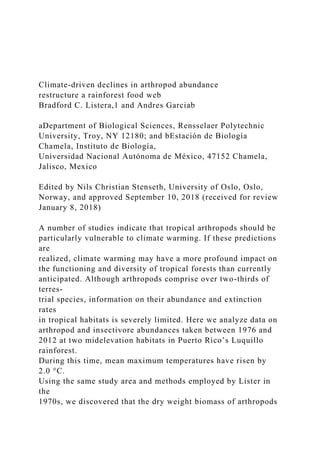
  • 7. 3,653 mm/y with no significant positive or negative trends. However, the number of dry days (rainfall less than 1 mm) has been de- creasing since 1975 (SI Appendix, Fig. S8G), while the variation in daily rainfall has been increasing (SI Appendix, Fig. S8H). Over the 36-y time span encompassed by the data analyzed here, there have been five major hurricanes and eight severe droughts with two outlier dry years, 1994 and 2015, when total rainfall was 1,404 mm and 2,035 mm, respectively (21). These disturbances are all asso- ciated with La Niña and El Niño events (SI Appendix, Fig. S9). Arthropods. Fig. 2 compares arthropod dry weight biomass cap- tured per 100 sweeps for July 1976 and January 1977 in the Luquillo forest study area (22), with our samples from July 2011 and 2012, and January 2012 and 2013. Compared with the earlier samples, arthropod biomass for July 2011–2012 and January 2012–2013 fell four and eight times, respectively. Fig. 3 shows that the declines in biomass occurred across all 10 of the major taxa captured in the sweep samples (Fig. 3 A and B vs. Fig. 3 C–E and F, respectively). A two-sample Kolmogorov–Smirnov test indicated that the distributions of biomass proportions across taxa were not significantly different between the two sample periods (Kolmogorov–Smirnov z = 0.671, P = 0.759), suggesting that all taxa declined proportionately. Sticky-trap samples for the ground (Fig. 4A) and canopy (Fig. 4B) were indicative of a collapse in forest arthropods. The catch rate
  • 8. for the ground traps fell 36 times, from 473 mg per trap per day in July 1976 to 13 mg per trap per day in July 2012, and approximately 60 times, from 470 mg per trap per day to 8 mg per trap per day, between January 1977 and January 2013. In July 1976, the canopy trap catch rate was 37 mg per trap per day compared with 5 mg per trap per day in July 2012, and 21 mg per trap per day in January 1976 vs. 8 mg per trap per day in January 2013. Analysis of Schowalter’s (23) canopy data also revealed sig- nificant decreases in invertebrate abundance, scaled with respect to foliage weight sampled between 1990 and 2010 (Fig. 5A), and a significant, nonlinear decline with increasing temperature (Fig. 5B). In keeping with our sweep net results, all 10 of the most- abundant canopy taxa exhibited negative trends in abundance between 1990 and 2010. The binomial probability of this pattern occurring by chance alone is 0.00097. Employing Willig et al.’s (24) census data, we also conducted quasi-Poisson regressions of walking stick abundance against time and against MnMaxT during the census periods (Fig. 5 C and D). Both regressions were negative and significant. During a previous study (25), we sampled arthropods within a tropical dry forest in the Chamela-Cuixmala Biosphere Reserve in western Mexico using the same sticky-trap methods employed at Luquillo. Since 1981, the Chamela-Cuixmala Biosphere Reserve
  • 9. has experienced a 2.4 °C increase in average annual air tempera- ture, from 24.5 °C in 1981 to 26.9 °C in 2014 (SI Appendix, Fig. S1). We returned to the Chamela forest in August 2014 to repeat our original samples within the same study area. Overall, we found an eightfold decrease in the dry-weight biomass of arthropods captured per day in ground traps in 2014 compared with the average for July 1987 and July 1988 (SI Appendix, Fig. S2). Insectivores. Given these declines in arthropod resources, parallel declines in insectivore abundances would be expected. The dominant insect predators within the Luquillo rainforest are anoline lizards, eleutherodactylid frogs, and birds (26). Here we analyze changes in abundance through time for forest-dwelling anoles, the most common forest frog, Eleutherodactylus coqui, and the bird community near the El Verde Field Station. Anoles. Within our Luquillo study area, the most common anoles during 1976–1977 were Anolis gundlachi, Anolis evermanni, and Anolis stratulus (22). In 2011 and 2012, we censused anoles within the same 225-m2 study area using the Schnabel method (27) employed in 1976/1977 by Lister (22). Average density of anoles in 2011–2012 had decreased ∼2.2 times compared with 1976–1977, from an estimated 12,490–5,640 anoles per hectare. Mean anole biomass within the study area dropped 32%, from 401 g to 277 g (Fig. 6 and SI Appendix, Table S1). The density of A. gundlachi, the most common species, had dropped twice, and the density of A. evermanni declined 10 times. A. stratulus,
  • 10. with a Fig. 1. Air temperature trends within the Luquillo forest. MnMaxT vs. year for the (A) El Verde (1978–2015) and (B) Bisley Tower (1994– 2012) meteo- rological stations. The stations are ∼8.2 km apart at elevations of 350 and 352 m, respectively. The least-squares regression lines have been drawn through the data points. The difference between the slopes of the two re- gression lines is not significant (t = 0.281, P = 0.78). Fig. 2. Mean dry-weight arthropod biomass per 100 sweeps taken in the same sample area in the Luquillo rainforest during July 1976, January 1977, July 2011, and January 2013. One SE around the mean biomass is shown for each bar. Total sweeps taken in each period was 800, except for July 1976, when 700 sweeps were taken. Data for 1976 and 1977 are from Lister (22). E10398 | www.pnas.org/cgi/doi/10.1073/pnas.1722477115 Lister and Garcia http://www.pnas.org/lookup/suppl/doi:10.1073/pnas.172247711 5/-/DCSupplemental http://www.pnas.org/lookup/suppl/doi:10.1073/pnas.172247711 5/-/DCSupplemental http://www.pnas.org/lookup/suppl/doi:10.1073/pnas.172247711 5/-/DCSupplemental http://www.pnas.org/lookup/suppl/doi:10.1073/pnas.172247711 5/-/DCSupplemental
  • 11. http://www.pnas.org/lookup/suppl/doi:10.1073/pnas.172247711 5/-/DCSupplemental http://www.pnas.org/lookup/suppl/doi:10.1073/pnas.172247711 5/-/DCSupplemental http://www.pnas.org/lookup/suppl/doi:10.1073/pnas.172247711 5/-/DCSupplemental http://www.pnas.org/lookup/suppl/doi:10.1073/pnas.172247711 5/-/DCSupplemental www.pnas.org/cgi/doi/10.1073/pnas.1722477115 density in the 1970s of 200 individuals per hectare, had dis- appeared from the interior forest, edge habitats, and other reg- ularly visited habitats lying within 4 km to the east and west of the study area. E. coqui. We conducted quasi-Poisson regressions of E. coqui counts vs. time for censuses conducted at El Verde (Fig. 7 A and B) by Stewart (28), and at El Verde (SI Appendix, Fig. S3 A and B) and the Bisley watershed (SI Appendix, Fig. S3 C and D) by Woolbright (29, 30). Data from Woolbright’s El Verde study area were previously analyzed to investigate the impact of Hur- ricane Hugo on Luquillo frogs (29, 30). Here we present an analysis and interpretation. To our knowledge, no analyses of the Bisley data have been previously published. The quasi-Poisson regressions of E. coqui numbers vs. time and MnMaxT for Stewart’s Activity Transect were both negative and significant (Fig. 7 A and B) (28). The regressions of E. coqui numbers vs. time and temperature for the Sonadura West study area were also negative and significant (SI Appendix, Fig.
  • 12. S3A). For the Sonadura Old population, only the regression of num- bers on time was significant (P = 0.013), while the regression of abundance on temperature was marginally insignificant (P = 0.067). Because no climate data were taken at the Bisley Tower until 1993, we were unable to conduct regression analyses of E. coqui numbers vs. temperature for the Bisley Stream and Bisley forest study areas. Regressions on time were both negative and significant (SI Appendix, Fig. S3 C and D). The temporal pattern of E. coqui abundances in Woolbright’s (29, 30) El Verde study area (SI Appendix, Fig. S3B) departs from the monotonic, negative trends found in the other E. coqui populations, and required a segmented regression consisting of three phases. In the first phase, E. coqui numbers had a signifi- cant negative trend followed by a rapid increase during phase 2 from 6 to 57 individuals between January and October 1990, most likely due to immigration from surrounding areas following Hurricane Hugo. In phase 3, the population resumed a steady decline at about the same rate as phase 1, until the census ended 6 y later. The rapid return to the preperturbation rate of decline suggests the ongoing influence of climate change on birth and death rates. Birds. To explore trends in avian abundance, we analyzed mist netting data taken near the El Verde Field Station by Waide (31) from 1990 to 2015, an analysis that had not been previously published. As Fig. 7C shows, under the same yearly sampling effort there was a significant decline in total insectivorous birds captured per year between 1990 and 2005, with captures falling 53% from a high of 137 birds in 1990 to 64 birds in 2005. During this period, seven of the eight most common bird species at El Verde experienced reductions in numbers. The quasi-Poisson
  • 13. regression of insectivorous birds caught per year on MnMaxT during the period of sampling was also negative and significant (Fig. 7D). If the declines in arthropod resources negatively impact avian abundance, then species with primarily granivorous or frugivorous diets should suffer smaller declines than those consuming a greater proportion of insects. For example, the ruddy quail dove (Geotrygon montana), which eats grains and fruits almost exclusively, showed no decline in abundance between 1990 and 2015 at El Verde, while Todus mexicanus, the Puerto Rican tody, whose diet is composed entirely of insects (26), experienced a 90% reduction in catch rate. Using data on diets of Puerto Rican birds (26) and a Theil-Sen nonparametric regression, we found that for six common species the relative decline in catch rate compared with G. montana in- creased significantly with an increase in the proportion of insects in their diet (SI Appendix, Fig. S4). Hierarchical Partitioning, Multiple Regression, and Cross- Correlation Analyses. To go beyond univariate regressions of population abun- dance on ambient temperature, we constructed multiple quasi- Poisson regressions using independent variables identified by a hier- archical partitioning (HP) analysis (32, 33). Given a set of predictors, HP averages the effect of each predictor on goodness of fit measures
  • 14. over all possible 2K regression models, where “K” is the number of predictors (34, 35). This averaging alleviates the effects of multi- collinearity and allows the explanatory impact of a given variable to be partitioned into an effect that depends only on the predictor itself and a joint effect shared with one or more other predictors. For each predictor, independent and joint effects are expressed as a percent of the total deviance explained. Variables with large independent effects are more likely to be causal than variables with small independent effects (33, 34). Hence, the technique is not designed to build an optimal predictive model, but to complement the model building process by revealing potential explanatory/causal relationships be- tween a dependent variable and a set of predictors. Fig. 4. Comparison of the average dry-weight biomass of arthropods caught per 12-h day in 10 ground (A) and canopy (B) traps within the same sampling area in the Luquillo rainforest. Numbers above the bars give the mean daily catch rate in dry weight of arthropods per day for the respective dates. Data for 1976 and 1977 are from Lister (22). Fig. 3. Comparison of total dry-weight biomass for the major arthropod taxa captured in sweep samples taken during the summer (A, C,
  • 15. and E) and winter (B, D, and F) seasons 1976–1977 and 2011–2013, within the same Luquillo forest study area. Arn, Areneida; Col, Coleoptera; Dip, Diptera; For, Formicidae; Hem, Hemiptera; Hom, Homoptera; Hym, other Hymenoptera; La, Lepidoptera adults; LI, Lepidoptera larvae; Ort, Orthoptera. Lister and Garcia PNAS | vol. 115 | no. 44 | E10399 EC O LO G Y http://www.pnas.org/lookup/suppl/doi:10.1073/pnas.172247711 5/-/DCSupplemental http://www.pnas.org/lookup/suppl/doi:10.1073/pnas.172247711 5/-/DCSupplemental http://www.pnas.org/lookup/suppl/doi:10.1073/pnas.172247711 5/-/DCSupplemental http://www.pnas.org/lookup/suppl/doi:10.1073/pnas.172247711 5/-/DCSupplemental http://www.pnas.org/lookup/suppl/doi:10.1073/pnas.172247711 5/-/DCSupplemental http://www.pnas.org/lookup/suppl/doi:10.1073/pnas.172247711 5/-/DCSupplemental http://www.pnas.org/lookup/suppl/doi:10.1073/pnas.172247711 5/-/DCSupplemental Using the nine climate-related variables listed in SI Appendix, Table S3 as independent variables, and abundance as the de-
  • 16. pendent variable, we conducted HP analyses for the three E. coqui populations, the canopy arthropods, walking sticks, and the El Verde birds. Results are shown in SI Appendix, Fig. S5. MnMaxT had considerably greater independent explanatory power than any of the other variables. Across all six populations, the average in- dependent effect of MnMaxT on abundance was 25%, while the averages for four other temperature related variables ranged from 11.4 to 14.3%. The independent explanatory power of average daily rainfall was highest in the E. coqui and walking stick populations (9.8–24.4%). The Southern Oscillation Index (SOI) also emerged as an impactful, potentially causal factor with independent effects ranging from 10.2 to 17.3% in two of the three E. coqui populations, the walking stick population and the canopy arthropods. The final multiple quasi-Poisson regressions, with supporting statistics, are given in SI Appendix, Table S5. For the El Verde birds, none of the variables in SI Appendix, Table S3 were significant once MnMaxT was entered into the model. Notably, the multivariate models for the three E. coqui populations and the walking stick population all contained MnMaxT and PropGT29 (proportion of days per year when daily temperature exceeds 29 °C) as major predictors. Multiple regressions for the El Verde E. coqui and walking stick populations also included the SOI as a significant predictor of abundance (SI Appendix, Table S5). To further analyze the effect of El Niño/Southern Oscil-
  • 17. lation (ENSO) on arthropod populations, we conducted cross-correlation analyses between the SOI and the abundances of canopy invertebrates and walking sticks (SI Appendix, Fig. S6). For the canopy invertebrates, there is a significant (P < 0.05) positive cross-correlation with the SOI at a time lag of 0. This indicates that positive SOI values (La Niña episodes) have an immediate positive impact on the abundance of canopy inver- tebrates, and negative SOI values (El Niño episodes) have an immediate negative impact. There is also a significant negative cross-correlation at a negative 5-y time lag, indicating that higher abundances precede El Niño events and lower abundances pre- cede La Niña events, as would be expected. For walking sticks, there is also a significant positive cross-correlation between abundance and the SOI, again indicating that higher and lower values of the SOI lead to higher and lower abundances re- spectively. However, for walking sticks, the ENSO events pre- cede the impact on population abundance by approximately 2 y. Vinod Causality. Regression and correlation analyses inevitably leave the issue of causality open to question (33, 34). In lieu of intractable experiments spanning large spatial and temporal scales, Vinod causality offers a statistical method that can help identify causal variables and reveal the direction of causal paths (36). Vinod’s generalized correlation and kernel causality methods (37, 38) im- prove and extend earlier attempts to discern causal paths between two or more variables, including those of Granger (39), Pearl (40), and Hoyer et al. (41). With a success rate of 70–75%, Vinod’s
  • 18. methods are the most accurate to date in terms of correctly iden- tifying causality in the CauseEffectPairs benchmark database (42). Here we explore the evidence that temperature is the causal agent affecting abundance using Vinod’s generalCorr R package. Given an xy dataset, generalCorr calculates a unanimity index (UI) that quantifies the likelihood that either x or y is causal. This index will always lie in the range [−100, 100]. If all three of Vinod’s causality criteria are met, then the UI will have an ab- solute value of 100, signifying the strongest evidence for the causality of a given variable. Three decision rules based on the value of the UI determine the direction of the causal path. If the UI lies in the interval [−100, −15], then y causes x, and if UI Fig. 5. Trends in the abundance of canopy arthropods and walking sticks in the Luquillo forest El Verde study area. (A) Linear regression of the total number of canopy arthropods captured per foliage weight sampled at El Verde against the period when the samples were taken. (B) Cubic regression for the total number of canopy arthropods captured per foliage weight sampled against the MnMaxT during the period when the samples were taken. (C) Quasi-Poisson regression of total number of walking sticks vs. the period when the population was sampled. (D) Quasi-Poisson regression of total number of walking sticks vs. the MnMaxT during the period when the
  • 19. population was sampled. The 95% confidence intervals are shown around the best-fit regression lines. For the Poisson regressions, Pr(χ) is the result of a likelihood-ratio χ2 test of whether the independent variable improves the Poisson model beyond an intercept-only model. P < 0.05 indicates a statis- tically significant regression. Fig. 6. Comparison of anoles censuses conducted in the same Luquillo rainforest study area during July 1976 and January 1977, with censuses conducted during July 2011 and January 2012. The total number of anoles in each census, estimated by the Schnabel multiple capture– recapture method (27), is given above each histobar. Brown represents male and female A. gundlachi. Green represents A. evermanni. Gray represents A. stratulus. SI Appendix, Table S1 gives the 95% confidence intervals around estimated abundances for A. gundlachi and A. evermanni. E10400 | www.pnas.org/cgi/doi/10.1073/pnas.1722477115 Lister and Garcia http://www.pnas.org/lookup/suppl/doi:10.1073/pnas.172247711 5/-/DCSupplemental http://www.pnas.org/lookup/suppl/doi:10.1073/pnas.172247711 5/-/DCSupplemental http://www.pnas.org/lookup/suppl/doi:10.1073/pnas.172247711 5/-/DCSupplemental http://www.pnas.org/lookup/suppl/doi:10.1073/pnas.172247711
  • 20. 5/-/DCSupplemental http://www.pnas.org/lookup/suppl/doi:10.1073/pnas.172247711 5/-/DCSupplemental http://www.pnas.org/lookup/suppl/doi:10.1073/pnas.172247711 5/-/DCSupplemental http://www.pnas.org/lookup/suppl/doi:10.1073/pnas.172247711 5/-/DCSupplemental http://www.pnas.org/lookup/suppl/doi:10.1073/pnas.172247711 5/-/DCSupplemental http://www.pnas.org/lookup/suppl/doi:10.1073/pnas.172247711 5/-/DCSupplemental www.pnas.org/cgi/doi/10.1073/pnas.1722477115 is in the interval [15, 100] then x causes y. If the UI lies within the range [−15, 15], the causal direction is indeterminate. SI Appendix, Table S4 summarizes the outcome of the gen- eralCorr analyses of causation. The unanimity indices equaled 100 in five of the six groups, indicating that the causal path Temperature → Abundance is supported by all three of Vinod’s criteria for causality. Inclusion of mean daily rainfall as a cova- riate improved the UI for all analyses except for walking sticks, which had a UI of 100 without the covariate, and for the E. coqui at the Sonadura Old study site, which retained a low UI and indeterminate causal path with and without the covariate. Discussion Climate Change and Arthropods. Based on 14 y of light-trap data within a Panamanian rainforest, Wolda (43) observed that the stability of tropical insects varied considerably. He concluded that this result reflected the absence of a “dominant environ- mental process” affecting many species simultaneously. We
  • 21. sug- gest that climate warming has emerged as such a dominant force affecting arthropod populations in the Luquillo forest and, most likely, in other tropical forests experiencing significant increases in ambient temperature. Several lines of evidence support this hypothesis. First, from a single species of walking stick to a community of over 120 canopy taxa, long-term declines have occurred in parallel with rising temperatures. Average ambient temperature is also a significant predictor of changes in the abundance of canopy invertebrates and walking sticks. Second, the simultaneous declines of all 10 arthropod taxa in our sweep samples, the 10 most-abundant taxa in Schowalter’s (23) canopy samples, and arthropods occu- pying all strata of our forest study area, all point to an overriding environmental factor that has had ubiquitous, adverse effects on forest arthropods regardless of taxonomic affiliation, stratum occupied, or type of niche exploited. Third, declines in arthropod abundance have occurred despite major decreases in their preda- tors. This “counter cascade” conflicts with decades of research on trophic dynamics (44), as well as studies documenting the major impact of anoles, frogs, and birds on arthropod abundance (45, 46). Stewart and Woolbright (47), for example, estimated the E. coqui population alone harvested 114,000 prey items per hectare per night in the Luquillo forest, and Reagan and Waide (26) calculated that A. stratulus, A. gundlachi, and A. evermanni collectively
  • 22. consumed ∼443,300 invertebrates per hectare per day at El Verde. If climate warming is not driving arthropod declines, then whatever the factors may be, they must completely override the reduction in mortality from lowered predation levels. Fourth, our analyses are in keeping with predictions of Deutsch et al. (5) that tropical insects should be especially vulnerable to climate warming, adding to field and lab- oratory studies over the past several years that have consistently supported the predicted sensitivity (8, 48–53). Finally, our arthro- pod samples from the Chamela-Cuixmala reserve in Mexico add support to our hypothesis that climate warming is having a serious negative impact on invertebrate populations in tropical forests. Other studies have also documented declines in arthropod abundance across a broad range of geography, habitats, and taxa (10–12, 54, 55, 56–58). Research on causal factors has focused on anthropogenic disturbance and pesticides (57, 58). Given its long- term protected status (59), significant human perturbations have been virtually nonexistent within the Luquillo forest since the 1930s, and thus are an unlikely source of invertebrate declines. Due to the ongoing reduction in agriculture and associated farmland, pesticides use in Puerto Rico also fell up to 80% between 1969 and 2012 (SI
  • 23. Appendix, Fig. S7). Most pesticides have half-lives measured in days, not decades (60), making it improbable that, despite precipitous declines in their use, remaining residues are responsible for waning arthropod abundance. Recently, Hallman et al. (61) published an extensive analysis of long-term data on the biomass of flying insects sampled at 63 protected reserves in Germany. Overall, they found a 75% decline in biomass between 1989 and 2016. Their statistical models largely eliminated land-use change as an explanatory vari- able but did not thoroughly analyze a number of climate-change variables. Increases in average temperature had a positive influence on insect biomass, an effect predicted by Tewksbury et al. (62) for temperate insects. However, the reasons for the alarming losses in insect biomass are currently unknown and, of course, may differ from causal agents in tropical habitats. Anolis Population Declines. Long-term abundance data taken by Pounds et al. (63), Whitfield et al. (4), and Stapley et al. (20) indicate that Anolis populations in other tropical forests have declined in parallel with anoles at Luquillo. At Monteverde, Costa Rica, populations of Anolis tropidolepis and Anolis altae were diminishing by 4.4% and 3.1% per year, respectively, for 11 and 13 y before both species became locally extinct. Over a 35-y period at La Selva, Costa Rica, Anolis capito, Anolis humilis, and Anolis apletophallus decreased by 23%, 78%, and 71%, respectively
  • 24. (3), and in the rainforest on Barro Colorado Island, Panama, A. apletophallus abundance declined by 71% between 1971 and 2011 (19). Proposed drivers of these trends were reduced mist frequency at Monteverde, diminished leaf litter due to climate change at La Selva, and the effects of the ENSO combined with a rise in mini- mum temperatures on Barro Colorado. Estimated rates of decline for Anolis populations at Luquillo, Monteverde, La Selva, and Barro Colorado are given in SI Ap- pendix, Table S2. All of these species are nonbasking, thermal- conforming forest inhabitants (6). In a macrophysiological and focal species analysis of Puerto Rican anoles and other lizards Fig. 7. Population trends for E. coqui and birds near the El Verde Field station. (A) Quasi-Poisson regression of estimated total number of E. coqui individuals against time from censuses conducted by Stewart (28) in the Activity Transect. (B) Quasi-Poisson regression of the estimated number of E. coqui individuals against MnMaxT during the time periods when Stewart’s censuses were conducted. (C) Quasi-Poisson regression for the total number of birds captured during equal length, 4-d sessions of mist netting (31) near the El Verde Field Station against the period when the mist netting was conducted. (D) Quasi-Poisson regression of the total number of birds cap- tured during Waide’s (31) 4-d sessions vs. MnMaxT during the
  • 25. year of mist netting. The 95% confidence intervals are shown around the best-fit re- gression lines. Pr(χ) is the result of a likelihood-ratio χ2 test of whether the independent variable improves the model beyond an intercept- only model. P < 0.05 indicates a statistically significant regression. Lister and Garcia PNAS | vol. 115 | no. 44 | E10401 EC O LO G Y http://www.pnas.org/lookup/suppl/doi:10.1073/pnas.172247711 5/-/DCSupplemental http://www.pnas.org/lookup/suppl/doi:10.1073/pnas.172247711 5/-/DCSupplemental http://www.pnas.org/lookup/suppl/doi:10.1073/pnas.172247711 5/-/DCSupplemental http://www.pnas.org/lookup/suppl/doi:10.1073/pnas.172247711 5/-/DCSupplemental http://www.pnas.org/lookup/suppl/doi:10.1073/pnas.172247711 5/-/DCSupplemental from 12 neotropical locations, Huey et al. (6) proposed that thermal-conforming lizards inhabiting shaded tropical forests should be especially vulnerable to climate warming. This vul- nerability results from lower critical thermal maxima than basking species, limited acclimation via thermoregulation, and reduced thermal safety margins. As ambient temperatures in-
  • 26. crease, thermal stress can lead to extinction by lowering per- formance, restricting activity time, and lessening food intake. In an encompassing study spanning local extinctions of lizard pop- ulations on five continents, Sinervo et al. (7) reached broadly similar conclusions for baskers and thermal-conformers in tem- perate and tropical habitats. In the Huey et al. (6) and Sinervo et al. (7) hypotheses, rising ambient temperatures indirectly lower food intake via changes in thermoregulatory behavior, while we propose that reduced con- sumption and declines in abundance result directly from climate- driven declines in food abundance. Although the mechanisms differ, the results are the same. As climate warms, lizards should in- creasingly become nutritionally challenged, resulting in reduced body condition, growth rates, egg production, fat body mass, phys- ical performance, and immune system response. Consequently, death rates from starvation, predation, and disease should increase along with concomitant decreases in reproduction. Eleutherodactylus Declines. Decreases in Puerto Rico’s Eleuther- odactylus populations began in the 1970s, with three species classified as threatened by 1985 (64). Stewart’s data (28), doc- umenting the collapse of E. coqui, was also an early warning sign of negative trends in Puerto Rican frogs. Currently, 3 of the original 16 species of Puerto Rican Eleutherodactylus are con- sidered extinct, and 13 species are listed as critically endangered, endangered, vulnerable, or near threatened (65). The monolithic pattern of rapid declines of E. coqui populations shown in Fig.
  • 27. 7A and SI Appendix, Fig. S3, when extrapolated, suggest their extinctions may be imminent by 2030–2040. The ongoing losses of anuran biodiversity on Puerto Rico and other West Indian islands (66, 67) are part of a global amphibian decline that has continued largely unabated since at least the 1970s (68–72). To our knowledge, no studies have explored re- ductions in arthropod prey as a possible causal mechanism. Most research has focused on the fungus Batrachochytrium den- drobatidis, which has precipitated mass-mortality events and catastrophic reductions in over 200 frog species world-wide (63, 73, 74). While B. dendrobatidis has been detected in E. coqui populations at higher elevations in Puerto Rico (66, 75), the fungus is restricted to areas above 600 m (76) and, at present, there is no evidence that it has impacted the lower elevation E. coqui populations analyzed in this study. Pounds and coworkers (63, 73, 77–79) have presented a wide- ranging body of evidence indicating that climate warming is a central factor promoting outbreaks of Batrachochytrium and the mass die-offs that follow. The relationship between chytrid out- breaks and climate is complex, but in general epidemics are often associated with repeated warm years and drier weather. Given ongoing climate change, the elevational range of Batrachochytrium will almost certainly change, as well as its impact on Puerto Rican frogs, especially juveniles (80). The key to understanding future impacts lies at the intersection of a changing climate with the spe- cific temperature- and moisture-related physiological limitations of the fungus, and how these constraints in turn affect its
  • 28. reproduction (81, 82). Based on our literature searches, no studies have explored re- ductions in arthropod prey as a possible causal mechanism behind amphibian declines, nor the possibility that malnutrition could in- teract with rising temperature and drought, compounding the im- pacts of disease through depression of immunocompetence (83). Avian Declines. Bird populations in many tropical and temperate ecosystems have been declining in parallel with those in Puerto Rico. In Canada, 44% of 460 bird species have had negative trends since 1970, and 42 species common to the United States, Canada, and Mexico have lost 50% or more of their populations in 40 y (84). Over a 20-y period, 54% of bird species native to Britain have also decreased (55). In the rainforest at La Selva, Costa Rica, 10–20% of resident birds declined between 1960 and 1999 (85), and in the Guanica dry forest in southwestern Puerto Rico mist-net data indicate that dry season bird populations dropped by two-thirds over two decades (86). Common drivers of plummeting bird populations mentioned in the literature are habitat loss, effects of temperature on reproduction (87–89), water stress (90), increased predation (91, 92), a disconnect between rates of climate change and climate tracking (93), mis- matches between breeding period and prey abundance (94), and atmospheric pollutants and insecticides (95). For farmland birds in Europe, reduction in prey due to herbicides, plowing, and loss
  • 29. of marginal habitats (96) appear to be major factors. We found only two articles that ascribed the collapse of avian populations to the impact of climate warming on prey abundance. Pearce-Higgins et al. (97) analyzed the demographics of the golden plover in Europe and showed that trends in population dynamics were closely associated with temperature-based reductions in prey abundance. Pearce- Higgins et al. (97) also analyzed the diets of 17 upland, insec- tivorous bird species in the United Kingdom, calculated a climate- sensitivity index for their prey, and showed that the index was correlated with recent negative population trends. In the forests of Victoria, Australia, Mac Nally et al. (98) documented major declines in the resident avifauna regardless of spatial scale, disturbance level, species conservation status, or foraging guild. They attributed the ongoing declines to the impact of increasing temperatures and decreasing rainfall on arthropods and other food resources. We also note that in many studies of passerine declines, such as Mac Nally et al. (98), insectivores are often the group exhib- iting the largest decreases in abundance, as appears to be the case in the Luquillo forest. In Canada and the northeastern United States, the total reduction in aerial insectivores between 1970 and 2010 was greater than 60%, the largest decline of all passerines analyzed (84, 99). Nebel et al. (100) concluded that these declines resulted from impoverishment of flying insect populations, and suggested acid rain as a possible mechanism. Between 1923 and 1998 in Singapore, insectivores experienced
  • 30. the highest level of extinctions of any foraging guild (101), and in fragmented forests in Costa Rica and Brazil, insectivores suf- fered greater declines and local extinctions than other avian groups (102–104). In a lowland tropical rainforest at La Selva, Costa Rica, Sigel et al. (85) also found that at least 50% of de- clining bird species were insectivorous. Given decades of research linking avian survivorship, reproduc- tion, and abundance to food resources (105–107), the paucity of studies on climate-related reductions in arthropod prey is surpris- ing. Galapagos finches provide a classic example of how climatic events associated with El Niño can lead to major fluctuations in food supplies, which in turn drive reductions in abundance of up to 40% per year in Geospiza populations (108). Anomalous rises in seawater temperature associated with ENSO have also caused se- vere reductions in food supplies, leading to starvation and mass mortality of marine birds (109–111). More recently, ocean warming associated with climate change has precipitated bottom-up trophic cascades, analogous to those proposed here for terrestrial systems, which have restructured both benthic and pelagic food webs and driven declines in shearwaters and auklets (112–114). Multiple Regression and Cross-Correlation. Our multiple regression results speak to the impact of both rising and falling tempera- tures on vertebrates and invertebrates in the Luquillo forest. While the effect of MnMaxT on abundance was negative in all
  • 31. E10402 | www.pnas.org/cgi/doi/10.1073/pnas.1722477115 Lister and Garcia http://www.pnas.org/lookup/suppl/doi:10.1073/pnas.172247711 5/-/DCSupplemental www.pnas.org/cgi/doi/10.1073/pnas.1722477115 models, the proportion of temperatures greater than 29 °C had both negative (El Verde E. coqui) and positive (walking sticks, E. coqui at Sonadura West and Sonadura Old) effects (SI Appendix, Table S5). This was perplexing, as we expected the frequency of extreme temperatures to track the rise in mean temperature. While this is true over the long term (SI Appendix, Fig. S8E), it was not the case during the Sonadura West and Sonadura Old censuses when the proportion of temperatures greater than 29 °C fell from 0.1 to 0.0, or during the walking stick census when the proportion dropped from 0.3 to 0.0. Only during Stewart’s earlier E. coqui census (28) did the proportion of higher temperature rise steadily from 0.0 in 1982 to 0.1 in 1992. The time line in SI Appendix, Fig. S9 places the dates of the population studies analyzed here into the context of El Niño and La Niña years as measured by the SOI. Positive SOI values (SI Appendix, Fig. S9, blue areas) correspond to La Niña years and negative values (SI Appendix, Fig. S9, red areas) to El Niño years. As SI Appendix, Fig. S9 illustrates, the canopy and walking stick censuses spanned three La Niña and three El Niño episodes. As SI Appendix, Fig. S9 also shows, the eruption of Mount Pinatubo,
  • 32. which lowered global temperature by as much as 0.6 °C over the next 2 y, occurred during the walking stick, Sonadura West, and Sonadura Old censuses. The effects of Pinatubo most likely lowered the frequency of extreme temperatures at El Verde despite a simultaneous strong El Niño episode. In a recent analysis of the growing frequency of extreme weather, Diffenbaugh et al. (115) predicted a two- to threefold increase in the probability of historically unprecedented maxi- mum daily temperatures between 2018 and 2036, and a three- to fivefold increase between 2036 and 2055. If these predictions are realized, the impact on food webs and ecosystems will be even more rapid than expected from the steady, linear increases in mean temperatures that are currently ravaging the natural world. Numerous studies have documented the impact of the ENSO on all of the major taxa considered here, including invertebrates (116), frogs (63, 73, 77, 117), lizards (1, 5), and birds (118). In keeping with our HP results, the multiple regressions for walking sticks and the El Verde E. coqui populations included the SOI as an important predictor of abundance, and the cross-correlations between the SOI and abundances of canopy invertebrates and walking sticks (SI Appendix, Fig. S6) underscore the fluctuating effects of La Niña and El Niño. The reason for the 2-y time lag in the effects of ENSO on walking stick abundance is not clear. Changes in temperature often lag phase shifts in the SOI by up to 9 mo, and this effect may be partly responsible. From data gathered over 55 y and 16 locations in Puerto Rico, the National Weather Service found that temperatures during La
  • 33. Niña events averaged ∼2.0 °C lower during the dry season (December to August), and 1.5 °C lower during the wet season (May to November) compared with El Niño episodes. ENSO also impacts rainfall across Puerto Rico, increasing dry season precipitation by 13% during El Niño years and causing a 14% increase in wet season precipitation during La Niña years. We interpret the positive effect of La Niña on invertebrate abun- dance as the result of cooler, wetter conditions conducive to increased survivorship and population growth compared with the hotter and seasonally drier conditions of El Niño years. Stapley et al. (20) reached a similar conclusion concerning the effects of ENSO on Anolis populations in Panama. While we have focused on population collapse driven by climate change, shifts in altitudinal distributions of arthropods, insectivores, producers, and top predators may also play an important role in the observed declines in abundance. In montane habitats upward mi- grations into cooler refugia can spell the difference between survival and extinction as temperatures rise at lower elevations (119). However, altitudinal shifts can also cause rapid changes in com- munity structure, disrupting coevolved interactions, creating “no- analogue communities,” and contributing to community disassem- bly via accelerated extinctions (120, 121). The reductions in habitat area as species move up mountains also increase extinction rates (87), and can erode genetic diversity, further reducing fitness and response to ongoing changes in climate (122, 123). At present,
  • 34. the extent to which these systemic factors may have influenced the midelevation population declines documented here is unknown. However, Luquillo forest birds and frogs are known to exhibit elevational range shifts similar to those encountered on other tropical mountains. Since 1998, 8 of 33 Luquillo forest bird species (124) and 10 of 12 resident frog species (125) have un- dergone elevational shifts. An alternative to the climate-warming hypothesis for pop- ulation declines in Luquillo and other tropical montane habitats is a mechanism proposed by Lawton et al. (126). In theory, clear cutting of lowland forests raises surface temperature, which in turn increases conductive heat flux from exposed ground to the atmosphere. This reduces both evapotranspiration and evapo- rative cooling (126) and lowers humidity. Pounds et al. (63) have presented a detailed rebuttal of the Lawton scenario with respect to montane forests in Costa Rica. With regard to the Luquillo rain forest, the assumptions of the Lawton hypothesis simply do not hold, given a major regeneration of the lowland forest since the 1950s after a transition from an agrarian to a manufacturing economy (127). Consequently, the degree of shade, cooling, and humidification of the habitats surrounding the Luquillo Moun- tains have all increased (128). Conclusion In general, a more integrated understanding of how climate warming and global cycles affect population and food web dy- namics awaits more extensive time series that encompass all levels of tropical forest ecosystems, from producers to top predators. The impacts of major climatic perturbations on the forest food web, such as the hurricanes and prolonged droughts driven by ENSO (SI Appendix, Fig. S9), also need further
  • 35. study. While the initial damage from Hurricane Hugo was devastating (129), the Luquillo forest vegetation recovered remarkably quickly, with 70% of trees at El Verde producing new leaves after just 7 wk (130), and after Hurricane Georges insect pop- ulations at all sites studied by Barberena-Arias and Aide (131) recovered in less than 1 y. The resilience of the forest was also manifested after Hurricane Maria when researchers found many locations well on their way to recovery after 2 mo (132). How- ever, as climate warming continues, the frequency and intensity of hurricanes in Puerto Rico are expected to increase (133), along with the severity of droughts and an additional 2.6–7 °C temperature increase by 2099 (134), conditions that collectively may exceed the resilience of the rainforest ecosystem. The central question addressed by our research is why simul- taneous, long-term declines in arthropods, lizards, frogs, and birds have occurred over the past four decades in the relatively undisturbed rainforests of northeastern Puerto Rico. Our anal- yses provide strong support for the hypothesis that climate warming has been a major factor driving reductions in arthropod abundance, and that these declines have in turn precipitated decreases in forest insectivores in a classic bottom-up cascade. This hypothesis also provides a parsimonious explanation for why similar cross-taxa, concordant decreases in reptiles, anurans, and birds have occurred in Costa Rican rainforests (3, 63), and are likely occurring across a broad range of tropical ecosystems. Overall, there is an urgent need for more widespread monitoring of arthropods and insectivores throughout the tropics (135, 136). As the sixth mass extinction continues to decimate the world’s biota (137, 138), these data will be crucial to understanding the impact of climate change on terrestrial food webs (139), eco- system dynamics (140), and biodiversity (8), and to formulating conservation strategies aimed at mitigating the effects of future
  • 36. climate forcing. Lister and Garcia PNAS | vol. 115 | no. 44 | E10403 EC O LO G Y http://www.pnas.org/lookup/suppl/doi:10.1073/pnas.172247711 5/-/DCSupplemental http://www.pnas.org/lookup/suppl/doi:10.1073/pnas.172247711 5/-/DCSupplemental http://www.pnas.org/lookup/suppl/doi:10.1073/pnas.172247711 5/-/DCSupplemental http://www.pnas.org/lookup/suppl/doi:10.1073/pnas.172247711 5/-/DCSupplemental http://www.pnas.org/lookup/suppl/doi:10.1073/pnas.172247711 5/-/DCSupplemental http://www.pnas.org/lookup/suppl/doi:10.1073/pnas.172247711 5/-/DCSupplemental http://www.pnas.org/lookup/suppl/doi:10.1073/pnas.172247711 5/-/DCSupplemental http://www.pnas.org/lookup/suppl/doi:10.1073/pnas.172247711 5/-/DCSupplemental http://www.pnas.org/lookup/suppl/doi:10.1073/pnas.172247711 5/-/DCSupplemental http://www.pnas.org/lookup/suppl/doi:10.1073/pnas.172247711 5/-/DCSupplemental http://www.pnas.org/lookup/suppl/doi:10.1073/pnas.172247711 5/-/DCSupplemental Materials and Methods
  • 37. Study Sites. Our research was carried out in the Luquillo Experimental Forest (LEF), which encompasses 10,871 acres in the Luquillo Mountains of northeastern Puerto Rico. Elevations extend from <100 m to 1,078 m. Rainfall and temperature vary with altitude, ranging from 150 cm y−1 and 26 °C at lower limits, to 450 cm y−1 and 18.9 °C on the highest peaks. We conducted our field work in the same study area utilized by Lister (22) in the 1970s. This location (18°19′584″N longi- tude, 65°228″W latitude) is situated on a northeast facing slope at 440 m. The vegetation is midelevation Tabonuco (Dacryodes excelsa) forest (141), char- acterized by an 8- to 10-m canopy, low ground light levels, and high plant diversity (171 tree species). We also sampled arthropods in a tropical dry forest in the Chamela-Cuixmala Biosphere Reserve in western Mexico (19°22003″– 19°35011″N, 104°56013″ to 105°03025″W), to compare recent samples with those we obtained in the same study area in 1986 and 1987 (25). Arthropod Samples. Lister (22) sampled arthropods within the Luquillo forest during July 1976 and January 1977. Following the same procedures and using the same study area, arthropod abundances were again estimated during July 2011 and January 2012 using both sticky-traps and sweep netting. Our 10 traps were the same size (34 × 24 cm) as Lister’s (22), and also
  • 38. utilized Tanglefoot as the sticky substance. Traps were laid out on the ground in the same-sized grid (30 × 24 m), and also left uncovered for 12 h between dawn and dusk before all captured insects were removed and stored in alcohol. Hoop sizes of our sweep nets (30-cm diameter) matched those used by Lister (22). Body lengths of all captured arthropods were measured to the nearest 0.5 mm using a dissecting scope and ocular micrometer. Regression equations were used to estimate in- dividual dry weights from body lengths (142, 143). Anolis Abundance. To compare Anolis densities with Lister’s (22) estimates from July 1976 and January 1977, we sampled anoles within the same 15 × 15-m quadrat during July 2011 and January 2012. Following Lister (22), we used the Schnabel multiple recapture method (27) to estimate densities. However, instead of marking captured lizards by toe clipping, we used Testor’s enamel paint to create small (∼2 mm) spots with different color combinations directly above the dorsal base of the tail. Climate Data. We analyzed climate data taken at two locations in the Luquillo forest: the United States Forest Service El Verde Field Station and the Bisley Lower meteorological tower, which is part of the Luquillo Critical Zone Observatory. The El Verde station lies 5 km southwest of our
  • 39. study area (18.3211° N, 65.8200° W), at an elevation of 350 m. The upper Bisley Tower is located 3.2 km southeast of our study area (18.3164 N, 65.7453 W) at 352 m in elevation. Temperature data for the El Verde station span 37 y, from 1978 to 2015 (Fig. 1A), and for the Bisley station 21 y from 1993 to 2014 (Fig. 1B). Given that the highest ambient temperatures for a given area should have the greatest impact on fitness, especially for ectotherms (144), daily maximum temperatures were utilized in our analyses. Climate data for the Estacion de Biologia Chamela were obtained from www.ibiologia.unam.mx/ ebchamela/www/clima.html. Luquillo Long-Term Ecological Research Data. Data sets from the Luquillo long- term ecological research (LTER) online Data Center were downloaded and an- alyzed for trends in population abundances over time. Detailed methods employed in the various studies can be found at the LTER Data Center website (https://luq.lter.network/luquillo-information-management- system-luq-ims). Canopy arthropods. Data were collected by Schowalter (23) near the El Verde field station between February 1991 and June 2009. Several articles have ana- lyzed these samples with respect to invertebrate diversity, functional groups, arthropod composition in gap and intact forest, and recovery
  • 40. from disturbance (145), but none have looked for trends in overall abundance. Here we summed all arthropods sampled each year across taxa, forest type, and tree genera. Walking sticks. We analyzed data from a census of walking sticks (Lamponius portoricensis) carried out by Willig et al. (24) between 1991 and 2014 in the 16-ha Luquillo Forest Dynamics Plot (LFDP) near the El Verde Field Station. Sampling was conducted during the wet and dry seasons and captured in- dividuals were classified as adults or juveniles. To analyze walking stick abundance through time, we summed all juveniles and adults across seasons and land classes. E. coqui abundance. We analyze census data for the Puerto Rican frog E. coqui taken by Woolbright (29, 30) between 1987 and 1997 at study areas near the El Verde Field Station and in the Bisley watershed, as well as E. coqui census data taken by Stewart (28) in another study area at El Verde. For Wool- brights’s (29, 30) census data at the Sonadura Old study area, we removed one outlier for the 1995 census data when E. coqui numbers increased from 29 to 236 and returned to 45 individuals in the next census. Mist netting. We analyze mist netting data taken by Waide (31) in the LFDP from June 1990 until May 2005. Nets were run from dawn to dusk for a total
  • 41. of 4 consecutive days each year during late May and early June. Only the post-Hurricane Hugo capture rates for June 1990 have previously been published (31). We calculated the total number of individuals caught per year across all species across all 15 y of data. Given that the ruddy quail dove (G. montana) is an exclusive granivore (SI Appendix, Fig. S4) and could confound patterns in insectivore abundance, we excluded this species from counts of captured birds. Recaptures of the same individuals within a given sampling period were also eliminated from the analysis. Statistical Analyses. All analyses were conducted with R 3.4.2 using RStudio v1.0.153. Poisson regressions and the nonparametric Theil-Sen regression were carried out with the glm2 (146) and mblm (147) R packages. Poisson regressions were tested for overdispersion using the AER package (148). Because all dispersion tests rejected the null hypothesis, only quasi-Poisson regressions were used. Guided by Pounds et al. (63, 73), Aguilar et al. (149), Stapley et al. (20), and García-Robledo et al. (53), we constructed 11 climate- related indices from the Luquillo LTER temperature and rainfall data for use in HP and regression analyses. SOI data were downloaded from the National Center for Atmospheric Research website (www.cgd.ucar.edu). Olea et al.
  • 42. (150) have shown that for more than nine explanatory variables, the order in which variables are entered in an HP analysis can affect the amount of in- dependent variance explained by a given predictor. Hence, we eliminated 2 of the 11 climate variables that had the highest correlations with the other climate variables. The final nine variables are defined in SI Appendix, Table S3. If a given variable did not make at least a 5% independent contribution to the explanation of the deviance, it was not included in the regression analyses. For the HP analyses we employed the hier.part R package (151), and for the Vinod Causality analyses the generalCorr package (37). We did not utilize automated regression techniques, such as stepwise selection and backward elimination, due to a variety of issues including erroneous type I error rates and inflated R2 measures (33). Climate variables are often highly correlated and can generate spurious results when used in regression (34, 134). To guard against such effects of multicollinearity, we constructed correlation matrices of the HP predictors and eliminated variables having correlations of 0.7 or higher. All multivariate quasi-Poisson regressions were then checked for multicollinearity using the Variance Inflation Factor and Bartlett’s Test of Sphe- ricity. Because Akaike’s Information Criterion cannot be
  • 43. calculated for quasi- Poisson models, we selected models having the smallest deviance residuals and the lowest χ2 test statistic P values. ACKNOWLEDGMENTS. We thank Ray Huey for his advice throughout this study; Patricia Burrowes, Luisa Otero, and Hector Alvarez for their support in Puerto Rico; Sarahi Torobio, Eduardo Avila, Helda Hernandez, and Katherine Lister for assistance in Mexico; Felipe Cano (US Department of Agriculture Forest Service) for facilitating research at Luquillo; Wayne Arendt (US Depart- ment of Agriculture Forest Service) for sharing his knowledge of Luquillo avian populations; Prof. H. D. Vinod for guidance on using his generalCorr R Package; and our reviewers for their comments, which broadened our understanding of climate warming effects and strengthened our analyses. We received sup- port from the Department of Biological Sciences at Rensselaer Polytechnic Institute, the graduate program in the biological sciences at the Instituto de Biologia, Universidad Nacional Autonoma de Mexico, and the Estacion de Biologıa Chamela of the Instituto de Biologia- Universidad Nacional Autonoma de Mexico. This research was supported by National Science Foundation Grant 1038013. 1. Parry ML, Canziani OF, Palutikof JP, van der Linden PJ,
  • 44. Hanson CE, eds (2007) Contribution of Working Group II to the Fourth Assessment Report of the Intergovernmental Panel on Climate Change (Cambridge Univ Press, Cambridge, UK). 2. Seebacher F, White CR, Franklin CE (2015) Physiological plasticity increases resilience of ectothermic animals to climate change. Nat Clim Change 5:61–66. 3. Janzen D (1967) Why mountain passes are higher in the tropics. Am Nat 101:233–249. 4. Whitfield SM, et al. (2007) Amphibian and reptile declines over 35 years at La Selva, Costa Rica. Proc Natl Acad Sci USA 104:8352–8356. 5. Deutsch CA, et al. (2008) Impacts of climate warming on terrestrial ectotherms across latitude. Proc Natl Acad Sci USA 105:6668–6672. 6. Huey RB, et al. (2009) Why tropical forest lizards are vulnerable to climate warming. Proc Biol Sci 276:1939–1948. 7. Sinervo B, et al. (2010) Erosion of lizard diversity by climate change and altered thermal niches. Science 328:894–899. 8. Sunday J, Bates A, Dulvy N (2011) Global analysis of thermal tolerance and latitude in ectotherms. Proc Biol Sci 278:1823–1830. E10404 | www.pnas.org/cgi/doi/10.1073/pnas.1722477115
  • 45. Lister and Garcia http://www.ibiologia.unam.mx/ebchamela/www/clima.html http://www.ibiologia.unam.mx/ebchamela/www/clima.html https://luq.lter.network/luquillo-information-management- system-luq-ims http://www.pnas.org/lookup/suppl/doi:10.1073/pnas.172247711 5/-/DCSupplemental http://www.cgd.ucar.edu/ http://www.pnas.org/lookup/suppl/doi:10.1073/pnas.172247711 5/-/DCSupplemental http://www.pnas.org/lookup/suppl/doi:10.1073/pnas.172247711 5/-/DCSupplemental www.pnas.org/cgi/doi/10.1073/pnas.1722477115 9. Maclean IM, Wilson RJ (2011) Recent ecological responses to climate change support predictions of high extinction risk. Proc Natl Acad Sci USA 108:12337–12342. 10. Conrad M, Warren B, Fox R, Parsons M, Woiwoda I (2006) Rapid declines of common, widespread British moths provide evidence of an insect biodiversity crisis. Biol Conserv 132:279–291. 11. Forister ML, et al. (2010) Compounded effects of climate change and habitat alter- ation shift patterns of butterfly diversity. Proc Natl Acad Sci USA 107:2088–2092. 12. Brooks D, et al. (2012) Large carabid beetle declines in a United Kingdom monitoring network increases evidence for a widespread loss in insect biodiversity. J Appl Ecol
  • 46. 49:1009–1019. 13. Potts SG, et al. (2010) Global pollinator declines: Trends, impacts and drivers. Trends Ecol Evol 25:345–353. 14. Fonty E, Sarthou C, Larpinz D, Ponge J (2009) A 10-year decrease in plant species richness on a neotropical inselberg: Detrimental effects of global warming? Glob Change Biol 15:2360–2374. 15. Feeley KJ, Davies SJ, Perez R, Hubbell SP, Foster RB (2011) Directional changes in the species composition of a tropical forest. Ecology 92:871–882. 16. Lewis S, Lloyd S, Sitch E, Mitchard A, Laurance W (2009) Changing ecology of tropical forests: Evidence and drivers. Annu Rev Ecol Evol Syst 40:529– 549. 17. Robinet C, Roques A (2010) Direct impacts of recent climate warming on insect populations. Integr Zool 5:132–142. 18. Guo K, Jianxing Sun O, Kang L (2011) The responses of insects to global warming. Recent Advances in Entomological Research, eds Liu T, Kang L (Springer Science, Business Media, New York). 19. Duarte C, Lenton T, Wadhams P, Wassmann P (2012) Abrupt climate change in the Arctic. Nat Clim Change 2:60–62. 20. Stapley J, Garcia M, Andrews RM (2015) Long-term data
  • 47. reveal a population decline of the tropical lizard Anolis apletophallus, and a negative affect of El Niño years on population growth rate. PLoS One 10:e0115450. 21. Ault T (2016) High Resolution Caribbean Drought Atlas. Available at ecrl.eas.cornell. edu/node/56. Accessed May 20, 2018. 22. Lister BC (1981) Seasonal niche relationships of rainforest anoles. Ecology 62: 1548–1560. 23. Schowalter TD (1994) Invertebrate community structure and herbivory in a tropical rain forest canopy in Puerto Rico following Hurricane Hugo. Biotropica 26:312–319. 24. Willig MR, Presley SJ, Bloch CP (2011) Long-term dynamics of tropical walking sticks in response to multiple large-scale and intense disturbances. Oecologia 165:357–368. 25. Lister BC, Garcia A (1992) Seasonality, predation and the behaviour of a tropical mainland anole. J Anim Ecol 61:717–734. 26. Reagan D, Waide R, eds (1996) The Food Web of a Tropical Rain Forest (Univ of Chicago Press, Chicago). 27. Ricker W (1975) Computation and interpretation of biological statistics of fish populations. Bull Fish Res Board Can 191:1–382. 28. Stewart MM (1995) Climate driven population fluctuations
  • 48. in rain forest frogs. J Herpetol 29:437–446. 29. Woolbright L (1991) Impact of Hurricane Hugo on forest frogs in Puerto Rico. Biotropica 23:462–467. 30. Woolbright L (1996) Disturbance influences long-term population patterns in the Puerto Rican frog, Eleutherodactylus coqui (Anura: Leptodactylidae). Biotropica 28: 493–501. 31. Waide R (1991) The effect of Hurricane Hugo on bird populations in the Luquillo Experimental Forest, Puerto Rico. Biotropica 23:475–480. 32. Mac Nally R (1996) Hierarchical partitioning as an interpretative tool in multivariate inference. Aust J Ecol 21:224–228. 33. Mac Nally R (2000) Regression and model-building in conservation biology, bio- geography and ecology: The distinction between—and reconciliation of—‘predictive’ and ‘explanatory’ models. Biodivers Conserv 9:655–671. 34. Mac Nally R (2002) Multiple regression and inference in ecology and conservation biology: Further comments on identifying important predictor variables. Biodivers Conserv 11:1397–1401. 35. Chevan A, Sutherland M (1991) Hierarchical partitioning. Am Stat 45:90–96. 36. Vinod HD (2017) Generalized correlation and kernel
  • 49. causality with applications in development economics. Commun Stat Simul Comput 46:4513– 4534. 37. Vinod HD (2017) Generalized correlation and kernel causality using R package generalCorr. Available at https://cran.r- project.org/web/packages/generalCorr/ vignettes/generalCorr-vignette.pdf. Accessed May 1, 2018. 38. Vinod HD (2018) New exogeneity tests and causal paths: Air pollution and monetary policy illustrations using generalCorr package. Available at https://cran.r-project.org/ web/packages/generalCorr/vignettes/generalCorr-vignette2.pdf. Accessed May 1, 2018. 39. Granger CWJ (1969) Investigating causal relations by econometric models and cross- spectral methods. Econometrica 37:424–438. 40. Pearl J (2010) The foundations of causal inference. Sociol Methodol 40:75–149. 41. Hoyer P, Janzig D, Mooij J, Peters J, Scholkopf B (2009) Non-linear causal discovery with additive noise models. Adv Neural Inf Process Syst 21:689–696. 42. Mooij J, Peters J, Janzig D, Zscheischler J, Scholkopf B (2016) Distinguishing cause from effect using observational data: Methods and benchmarks. J Mach Learn Res 17:1–102.
  • 50. 43. Wolda H (1992) Trends in abundance of tropical forest insects. Oecologia 89:47–52. 44. Terborgh J, Estes J (2010) Trophic Cascades: Predators, Prey, and the Changing Dynamics of Nature (Island Press, Washington, DC), 2nd Ed. 45. Pacala S, Roughgarden J (1984) Control of arthropod abundance by Anolis lizards on St. Eustatius (Neth. Antilles). Oecologia 64:160–162. 46. Marquis R, Whelan C (1994) Insectivorous birds increase growth of white oak through consumption of leaf-chewing insects. Ecology 75:2007– 2014. 47. Stewart M, Woolbright L (1996) Amphibians. The Food Web of a Tropical Rain Forest, eds Reagan DP, Waide RB (Univ of Chicago Press, Chicago), pp 363–398. 48. Villalpando SN, Williams RS, Norby RJ (2009) Elevated air temperature alters an old- field insect community in a multifactor climate change experiment. Glob Change Biol 15:930–942. 49. Karl I, Stoks R, De Block M, Janowitz SA, Fischer K (2011) Temperature extremes and butterfly fitness: Conflicting evidence from life history and immune function. Glob Change Biol 17:676–687. 50. Zeh J, et al. (2012) Degrees of disruption: Projected temperature increase has cata-
  • 51. strophic consequences for reproduction in a tropical ectotherm. Glob Change Biol 18:1833–1842. 51. Piyaphongkul J, Pritchard J, Bale J (2012) Can tropical insects stand the heat? A case study with the brown planthopper Nilaparvata lugens (Stål). PLoS One 7:e29409. 52. Diamond SE, et al. (2012) Who likes it hot? A global analysis of the climatic, eco- logical, and evolutionary determinants of warming tolerance in ants. Glob Change Biol 18:448–456. 53. García-Robledo C, Kuprewicz EK, Staines CL, Erwin TL, Kress WJ (2016) Limited tol- erance by insects to high temperatures across tropical elevational gradients and the implications of global warming for extinction. Proc Natl Acad Sci USA 113:680–685. 54. Kotze DJ, O’Hara RB (2003) Species decline—But why? Explanations of carabid beetle (Coleoptera, Carabidae) declines in Europe. Oecologia 135:138–148. 55. Thomas JA, et al. (2004) Comparative losses of British butterflies, birds, and plants and the global extinction crisis. Science 303:1879–1881. 56. Kerr JT, et al. (2015) Climate change. Climate change impacts on bumblebees con- verge across continents. Science 349:177–180. 57. Goulson D, Nicholls E, Botías C, Rotheray EL (2015) Bee
  • 52. declines driven by combined stress from parasites, pesticides, and lack of flowers. Science 347:1255957. 58. Becher MA, Osborne JL, Thorbek P, Kennedy PJ, Grimm V (2013) Towards a systems approach for understanding honeybee decline: A stocktaking and synthesis of ex- isting models. J Appl Ecol 50:868–880. 59. Harris NL, Lugo AE, Brown S, Heartsill Scalley T, eds (2012) Luquillo Experimental Forest: Research History and Opportunities. Experimental Forests and Ranges EFR-1 (USDA Forest Service, Washington, DC). 60. Hanson B, Bond C, Buhl K, Stone D (2015) Pesticide half- life fact sheet. (National Pesticide Information Center, Oregon State University Extension Services, Corvallis, OR), Available at npic.orst.edu/factsheets/half-life.html. Accessed October 10, 2017. 61. Hallmann CA, et al. (2017) More than 75 percent decline over 27 years in total flying insect biomass in protected areas. PLoS One 12:e0185809. 62. Tewksbury JJ, Huey RB, Deutsch CA (2008) Ecology. Putting the heat on tropical animals. Science 320:1296–1297. 63. Pounds J, Fogden M, Campbell J (1999) Biological response to climate change on a tropical mountain. Nature 398:611–615. 64. Joglar R, Burrowes P (1996) Declining amphibian
  • 53. populations in Puerto Rico. Con- tributions to West Indian Herpetology: A Tribute to Albert Schwartz, Contributions to Herpetology, eds Powell R, Henderson RW (The Society for the Study of Am- phibians and Reptiles, Ithaca, NY), Vol 12, pp 371–380. 65. IUCN (2017) IUCN Red List of Threatened Species. Available at www.iucnredlist.org. Accessed May 25, 2017. 66. Burrowes P, Joglar R, Green D (2004) Potential causes for amphibian declines in Puerto Rico. Herpetologica 60:141–154. 67. Hedges S (1993) Global amphibian declines: A perspective from the Caribbean. Biodivers Conserv 2:290–303. 68. Pounds JA (1990) Disappearing gold. BBC Wildlife 8:812– 817. 69. Pounds JA (1991) Amphibian watch: New clues in the case of the disappearing amphibians. Wildlife Conservation 94:16–18. 70. Barinaga M (1990) Where have all the froggies gone? Science 247:1033–1034. 71. Crawford AJ, Lips KR, Bermingham E (2010) Epidemic disease decimates amphibian abundance, species diversity, and evolutionary history in the highlands of central Panama. Proc Natl Acad Sci USA 107:13777–13782. 72. Pounds JA, Fogden MPL, Savage J, Gorman G (1997) Tests of null models for am-
  • 54. phibian declines on a tropical mountain. Conserv Biol 11:1307– 1322. 73. Pounds JA, et al. (2006) Widespread amphibian extinctions from epidemic disease driven by global warming. Nature 439:161–167. 74. Catenazzi A (2015) State of the world’s amphibians. Annu Rev Environ Resour 40: 91–119. 75. Burrowes P, Longo A, Joglar R (2008) Geographic distribution of Batrachochytrium dendrobatidis in Puerto Rico. Herpetol Rev 39:321–324. 76. Longo AV, Burrowes PA, Joglar RL (2010) Seasonality of Batrachochytrium den- drobatidis infection in direct-developing frogs suggests a mechanism for persistence. Dis Aquat Organ 92:253–260. 77. Pounds JA, Crump ML (1994) Amphibian declines and climate disturbance: The case of the golden toad and the harlequin frog. Conserv Biol 8:72– 85. 78. Pounds JA, Carnaval AC, Puschendorf R, Haddad CFB, Masters KL (2006) Responding to amphibian loss. Science 314:1541–1542. 79. Pounds JA (2001) Climate and amphibian declines. Nature 410:639–640. 80. Langhammer PF, Burrowes PA, Lips KR, Bryant SB, Collins JP (2014) Susceptibility to the amphibian chytrid fungus varies with ontogeny in the direct-
  • 55. developing frog Eleutherodactylus coqui. J Wildl Dis 50:438–446. 81. Stevenson LA, et al. (2013) Variation in thermal performance of a widespread pathogen, the amphibian chytrid fungus Batrachochytrium dendrobatidis. PLoS One 8:e73830. 82. Holmes I, McLaren K, Wilson B (2014) Precipitation constrains amphibian chytrid fungus infection rates in a terrestrial frog assemblage in Jamaica, West Indies. Biotropica 46:219–228. Lister and Garcia PNAS | vol. 115 | no. 44 | E10405 EC O LO G Y http://ecrl.eas.cornell.edu/node/56 http://ecrl.eas.cornell.edu/node/56 https://cran.r- project.org/web/packages/generalCorr/vignettes/generalCorr- vignette.pdf https://cran.r- project.org/web/packages/generalCorr/vignettes/generalCorr- vignette.pdf https://cran.r- project.org/web/packages/generalCorr/vignettes/generalCorr- vignette2.pdf https://cran.r-
  • 56. project.org/web/packages/generalCorr/vignettes/generalCorr- vignette2.pdf http://npic.orst.edu/factsheets/half-life.html http://www.iucnredlist.org 83. Blaustein AR, et al. (2012) Ecophysiology meets conservation: Understanding the role of disease in amphibian population declines. Philos Trans R Soc Lond B Biol Sci 367:1688–1707. 84. Berlanga H, et al. (2010) Saving Our Shared Birds: Partners in Flight Tri-National Vision for Landbird Conservation (Cornell Lab of Ornithology, Ithaca, NY). 85. Sigel BJ, Sherry TW, Young BE (2006) Avian community response to lowland tropical rainforest isolation: 40 years of change at La Selva Biological Station, Costa Rica. Conserv Biol 20:111–121. 86. Faaborg J, et al. (2013) Long-term decline of a winter- resident bird community in Puerto Rico. Biodivers Conserv 22:63–75. 87. Sekercioglu C, Primack R, Wormworth J (2012) The effects of climate change on tropical birds. Biol Conserv 148:1–18. 88. Jiguet F, et al. (2010) Bird population trends are linearly affected by climate change along species thermal ranges. Proc Biol Sci 277:3601–3608. 89. McKechnie AE, Wolf BO (2010) Climate change increases
  • 57. the likelihood of cata- strophic avian mortality events during extreme heat waves. Biol Lett 6:253–256. 90. Cruz-McDonnell KK, Wolf BO (2016) Rapid warming and drought negatively impact population size and reproductive dynamics of an avian predator in the arid south- west. Glob Change Biol 22:237–253. 91. Ydenberg R, Butler R, Lank D, Smith B, Ireland J (2004) Western sandpipers have altered migration tactics as peregrine falcon populations have recovered. Proc Biol Sci 271:1263–1269. 92. Baines D, Redpath S, Richardson M, Thirgood S (2008) The direct and indirect effects of predation by Hen Harriers Circus cyaneus on trends in breeding birds on a Scottish grouse moor. Ibis 150:27–36. 93. Devictor V, Julliard R, Couvet D, Jiguet F (2008) Birds are tracking climate warming, but not fast enough. Proc Biol Sci 275:2743–2748. 94. Both C, Bouwhuis S, Lessells CM, Visser ME (2006) Climate change and population declines in a long-distance migratory bird. Nature 441:81–83. 95. Hallmann CA, Foppen RP, van Turnhout CA, de Kroon H, Jongejans E (2014) Declines in insectivorous birds are associated with high neonicotinoid concentrations. Nature 511:341–343.
  • 58. 96. Wilson J, Morris A, Arroyo B, Clark S, Bradbury R (1999) A review of the abundance and diversity of invertebrate and plant foods of granivorous birds in northern Europe in relation to agricultural change. Agric Ecosyst Environ 75:13–30. 97. Pearce-Higgins J, Dennis P, Whittingham M, Yalden D (2010) Impacts of climate on prey abundance account for fluctuations in a population of a northern wader at the southern edge of its range. Glob Change Biol 16:12–23. 98. Mac Nally R, et al. (2009) Collapse of an avifauna: Climate change appears to ex- acerbate habitat loss and degradation. Divers Distrib 15:720– 730. 99. North American Bird Conservation Initiative Canada (2012) The State of Canada’s Birds, 2012. Available at stateofcanadasbirds.org/. Accessed October 1, 2016. 100. Nebel S, Mills A, McCracken J, Taylor P (2010) Declines of aerial insectivores in North America follow a geographic gradient. Avian Conserv Ecol 5:1. 101. Castelletta M, Sodhi NS, Subaraj R (2000) Heavy extinctions of forest avifauna in Singapore: Lessons for biodiversity conservation in Southeast Asia. Conserv Biol 14: 1870–1880. 102. Stouffer P, Bierregaard R (1995) Use of Amazonian forest fragments by understory insectivorous birds. Ecology 76:2429–2445.
  • 59. 103. Stratford JA, Stouffer PC (1999) Local extinctions of terrestrial insectivorous birds in a fragmented landscape near Manaus, Brazil. Conserv Biol 13:1416–1423. 104. Sekercioglu CH, et al. (2002) Disappearance of insectivorous birds from tropical forest fragments. Proc Natl Acad Sci USA 99:263–267. 105. Newton I (1980) The role of food in limiting bird numbers. Ardea 68:11–30. 106. Edworthy A, Drevera M, Martina K (2011) Woodpeckers increase in abundance but maintain fecundity in response to an outbreak of mountain pine bark beetles. For Ecol Manage 261:203–210. 107. Brown DR, Sherry TW (2006) Food supply controls the body condition of a migrant bird wintering in the tropics. Oecologia 149:22–32. 108. Grant B, Grant P (1993) Evolution of Darwin’s finches caused by a rare climatic event. Proc R Soc Lond 251:111–117. 109. Piatt J, Van Pelt T (1997) Mass-mortality of Guillemots (Uria aalge) in the Gulf of Alaska in 1993. Mar Pollut Bull 34:656–662. 110. Ayala L, Paz-Soldan L, Garate P (2013) A mass mortality event of sooty shearwaters (Puffinus griseus) on the central coast of Peru. Notornis 60:258–261.
  • 60. 111. Fuentes H, Antonietti E (1989) Efectos del Fenómeno El Niño en las aves marinas del litoral peruano. Boletín Estudio Regional del Fenómeno El Niño 29:19–26. 112. Veit R, McGowan J, Ainley D, Wahland T, Pyle P (1997) Apex marine predator de- clines ninety percent in association with changing oceanic climate. Glob Change Biol 3:23–28. 113. Baduini C, et al. (2001) Mass mortality of short-tailed shearwaters in the south- eastern Bering Sea during summer 1997. Fish Oceanogr 10:117– 130. 114. Springer A, Byrd G, Iverson S (2007) Hot oceanography: Planktivorous seabirds reveal ecosystem responses to warming of the Bering Sea. Mar Ecol Prog Ser 352:289–297. 115. Diffenbaugh NS, Singh D, Mankin JS (2018) Unprecedented climate events: Historical changes, aspirational targets, and national commitments. Sci Adv 4:eaao3354. 116. Gutiérrez-Fonseca PE, Ramírez A, Pringle CM (2018) Large-scale climatic phenomena drive fluctuations in macroinvertebrate assemblages in lowland tropical streams, Costa Rica: The importance of ENSO events in determining long-term (15y) patterns. PLoS One 13:e0191781. 117. Kiesecker JM, Blaustein AR, Belden LK (2001) Complex causes of amphibian pop-
  • 61. ulation declines. Nature 410:681–684. 118. Sillett TS, Holmes RT, Sherry TW (2000) Impacts of a global climate cycle on pop- ulation dynamics of a migratory songbird. Science 288:2040– 2042. 119. Colwell RK, Brehm G, Cardelús CL, Gilman AC, Longino JT (2008) Global warming, elevational range shifts, and lowland biotic attrition in the wet tropics. Science 322: 258–261. 120. Sheldon KS, Yang S, Tewksbury JJ (2011) Climate change and community disas- sembly: Impacts of warming on tropical and temperate montane community struc- ture. Ecol Lett 14:1191–1200. 121. Urban MC, Tewksbury JJ, Sheldon KS (2012) On a collision course: Competition and dispersal differences create no-analogue communities and cause extinctions during climate change. Proc Biol Sci 279:2072–2080. 122. Arenas M, Ray N, Currat M, Excoffier L (2012) Consequences of range contractions and range shifts on molecular diversity. Mol Biol Evol 29:207– 218. 123. Rubidge EM, et al. (2012) Climate-induced range contraction drives genetic erosion in an alpine mammal. Nat Clim Chang 2:285–288. 124. Campos-Cerqueira M, Arendt WJ, Wunderle JM, Jr, Aide TM (2017) Have bird dis-
  • 62. tributions shifted along an elevational gradient on a tropical mountain? Ecol Evol 7: 9914–9924. 125. Campos-Cerqueira M, Aide TM (2017) Lowland extirpation of anuran populations on a tropical mountain. PeerJ 5:e4059. 126. Lawton RO, Nair US, Pielke RA, Sr, Welch RM (2001) Climatic impact of tropical lowland deforestation on nearby montane cloud forests. Science 294:584–587. 127. Helmer EH, Brandeis TJ, Lugo AE, Kennaway T (2008) Factors influencing spatial pattern in tropical forest clearance and stand age: Implications for carbon storage and species diversity. J Geophys Res 113:G02S04. 128. Otero LM, Huey RB, Gorman GC (2015) A few meters matter: Local habitats drive reproductive cycles in a tropical lizard. Am Nat 186:E72–E80. 129. Brokaw NVL, Grear JS (1991) Forest structure before and after Hurricane Hugo at three elevations in the Luquillo Mountains, Puerto Rico. Biotropica 23:386–392. 130. Walker LR, Voltzow J, Ackerman JD, Fernandez DS, Fetcher N (1992) Immediate impact of Hurricane Hugo on a Puerto Rican rain forest. Ecology 73:691–694. 131. Barberena-Arias MF, Aide TM (2002) Variation in species and trophic composition of insect communities in Puerto Rico. Biotropica 34:357–367.
  • 63. 132. Thompson J (2018) Forest dynamics. Available at luq.lter.network/forest-dynamics- jill-thompson. Accessed June 20, 2018. 133. Bender MA, et al. (2010) Modeled impact of anthropogenic warming on the fre- quency of intense Atlantic hurricanes. Science 327:454–458. 134. Knape J, de Valpine P (2011) Effects of weather and climate on the dynamics of animal population time series. Proc Biol Sci 278:985–992. 135. Vasconcelos H, Bruna E (2012) Arthropod responses to the experimental isolation of Amazonian forest fragments. Zoologia 29:515–530. 136. Lobo JM (2016) The use of occurrence data to predict the effects of climate change on insects. Curr Opin Insect Sci 17:62–68. 137. Ceballos G, et al. (2015) Accelerated modern human- induced species losses: Entering the sixth mass extinction. Sci Adv 1:e1400253. 138. Ceballos G, Ehrlich PR, Dirzo R (2017) Biological annihilation via the ongoing sixth mass extinction signaled by vertebrate population losses and declines. Proc Natl Acad Sci USA 114:E6089–E6096. 139. Traill LW, Lim MLM, Sodhi NS, Bradshaw CJA (2010) Mechanisms driving change: Altered species interactions and ecosystem function through global warming. J Anim Ecol 79:937–947.
  • 64. 140. Walther GR (2010) Community and ecosystem responses to recent climate change. Philos Trans Royal Soc A 365:2019–2024. 141. Foster DR, Fluet M, Boose ER (1999) Human or natural disturbance: Landscape-scale dynamics of the tropical forests of Puerto Rico. Ecol App 9:555–672. 142. Ganihar SR (1997) Biomass estimates of terrestrial arthropods based on body length. J Biosci 22:219–224. 143. Johnson MD, Strong AM (2000) Length-weight relationships of Jamaican arthro- pods. Entomol News 111:270–281. 144. Kingsolver JG, Diamond SE, Buckley LB (2013) Heat stress and the fitness conse- quences of climate change for terrestrial ectotherms. Funct Ecol 27:1415–1423. 145. Schowalter TD, Ganio LM (1999) Invertebrate communities in a tropical rain forest canopy in Puerto Rico following Hurricane Hugo. Ecol Entomol 24:191–201. 146. Marschner IC (2011) glm2: Fitting generalized linear models with convergence problems. R J 3:12–15. 147. Komsta L (2013) mblm: Median-Based Linear Models. R Package Version 0.12. Available at https://CRAN.R-project.org/package=mbl. Accessed December 1, 2017.
  • 65. 148. Kleiber C, Zeileis A (2008) Applied Econometrics with R (Springer, New York), Available at https://cran.r- project.org/web/packages/AER/index.html. Accessed June 1, 2016. 149. Aguilar E, et al. (2005) Changes in precipitation and temperature extremes in Central America and northern South America, 1961–2003. J Geophys Res Atmos 110:D23107. 150. Olea PP, Mateo-Tomás P, de Frutos A (2010) Estimating and modelling bias of the hierarchical partitioning public-domain software: Implications in environmental management and conservation. PLoS One 5:e11698. 151. Walsh C, Mac Nally R (2013) hier.part: Hierarchical Partitioning. R Package Version 1.0-4. Available at https://cran.r- project.org/web/packages/hier.part/index.html. Ac- cessed May 1, 2018. E10406 | www.pnas.org/cgi/doi/10.1073/pnas.1722477115 Lister and Garcia http://stateofcanadasbirds.org/ http://luq.lter.network/forest-dynamics-jill-thompson http://luq.lter.network/forest-dynamics-jill-thompson https://CRAN.R-project.org/package=mbl https://cran.r-project.org/web/packages/AER/index.html https://cran.r-project.org/web/packages/hier.part/index.html www.pnas.org/cgi/doi/10.1073/pnas.1722477115 Sheet1xy47.6108192763-122.290816002247.6878010086-
  • 66. 122.313427273947.5239795043- 122.359890599147.6541086069- 122.337605288247.5506196981- 122.320135414147.6080099819- 122.328738669947.5553892558- 122.384738627147.5562356536-122.385980506247.654787431- 122.336519884647.5652091275- 122.373747516847.5536456857- 122.363257325247.6957185793- 122.311943918747.6972009726-122.31348102947.6544767899- 122.336464262947.6957369531-122.31316340847.6872456761- 122.334695702447.6882655474-122.33585552447.6840722784- 122.326488432147.555381734-122.38622263147.6136155346- 122.347057814947.6953856705- 122.313074947647.6733393883-122.39512028247.6736070968- 122.393802859447.622366025-122.315918000447.5341884029- 122.281393234447.6153962664- 122.348663745947.6794116899- 122.370539626147.6174259787- 122.326756271747.6395260756- 122.328378742247.6789013609- 122.381863274647.5254361097- 122.329019336847.6880480751- 122.392309999447.6526306369- 122.342217144547.5603489768- 122.314023190647.6505515559- 122.330588662547.6924645956- 122.286883768947.6715870433-122.25994740447.5664287096- 122.38084221347.6794670377-122.356600081547.6717143403- 122.365887597947.6942077243- 122.286249166247.6928151492- 122.285336467147.5616814291-122.27212282847.6258516153- 122.320041323447.582391548-122.394477613247.6842730779- 122.32661592247.6841569098-122.325972154247.5799961341- 122.402044500147.7148851918- 122.332963649647.5525663188-
  • 67. 122.304349644347.6543710193- 122.357453783247.5687392259- 122.406487507547.6523091071- 122.350004524747.6692278094- 122.335173722547.6822606054- 122.343449998947.6214209585- 122.316419530747.5550843545- 122.264553261547.6189390326- 122.292123417847.5837867009-122.316769676847.612313045- 122.298252155447.6500847223- 122.319314511347.6699213774- 122.401463847947.6129415063- 122.312635956847.6276735193- 122.358610808547.5114571958- 122.256080995947.6354817084- 122.358477761647.6441308606- 122.356299165347.5454306533- 122.397837271247.5528423227- 122.277893570747.5821599678- 122.393871524847.5357006476- 122.386312408247.5960491227- 122.317850102147.6777046524- 122.359838852147.6800375715-122.283983427847.621627392- 122.316929307647.699898373-122.366141804747.5612970384- 122.281218607147.6153386452-122.34790529347.682309278- 122.378749661947.6569247665- 122.360934882347.6757467839- 122.357389082847.6138602018- 122.348787339147.6778094417- 122.358621319947.6896610846- 122.368394178547.6611973366- 122.401445522947.5496907093- 122.318679113447.6680705341-122.3620861647.5782293013- 122.411812120547.7063897406- 122.280745621747.5732655583- 122.374361170747.6432862428-
  • 68. 122.375818622447.6362890384-122.371025247.6705794109- 122.323632518447.5814326781-122.394109027847.67716562- 122.361692831547.6837806708- 122.342012818947.5752909722- 122.302048733947.6981811943- 122.387101329647.6157753482- 122.348718584147.6160746943-122.34667747747.6329184028- 122.37247063447.6812254063-122.379711402447.5937973205- 122.305148836247.6198828241- 122.319612564247.6575891112- 122.354376195647.6114811167- 122.329121063747.6152320255-122.347027420647.614972824- 122.348554496847.644810466-122.324285142147.6464213197- 122.324953750947.6233621581- 122.316677816247.6563340605- 122.349977532747.5958290744- 122.297884216947.6189713884- 122.324207191247.6558849377- 122.332135968947.6234428298-122.30658692547.6103771172- 122.311565836547.6136745639- 122.322028272147.5800288098- 122.390251091847.5050883437- 122.378238815747.6500516073- 122.321101330747.6130430105- 122.323214212947.6835447395- 122.330911144447.6834831487-122.357053886747.666229972- 122.360696908947.6256981038-122.32095362247.628365679- 122.326260468947.6217782547-122.323787088847.676753104- 122.293971845747.5851302744- 122.315261446647.5757694805- 122.316362088547.6581070148- 122.357388977247.6598921769- 122.330428833547.6755332684- 122.376324014147.6090700187- 122.296132610247.6992161483- 122.350716020847.6588313139-
  • 69. 122.347966513247.6541015659- 122.338510944247.6852808972-122.34315760247.615827761- 122.34077729947.5696575879-122.361711277547.6852324694- 122.289434643747.7135183282- 122.358735286647.6839408813- 122.373045532647.6973600413- 122.376222211847.6689948071- 122.402800638747.7179619172- 122.291140673447.6278521271- 122.298714842647.6542975861- 122.352588507447.6117183145- 122.343684974347.5605111091-122.27894830147.7029543964- 122.368611502247.6780459888- 122.360425546547.6585389006-122.32581803247.6787125823- 122.360664363847.5699913111- 122.360713734647.6364168374- 122.341243881347.5688564595- 122.361843923147.5366044051- 122.356052313747.6208177429- 122.356335311147.6493265813- 122.319245602947.6836234235- 122.288278251647.6196773839- 122.324147043747.5791652603- 122.292118994547.5795538805- 122.293685620347.6209347612- 122.298146744347.7015512911- 122.366511276147.5494561115-122.31657741647.6135485752- 122.321305398947.6877821424- 122.348596091347.5622061778-122.38597831647.6143636866- 122.331716188147.5775607823- 122.304280664247.6986129648- 122.363442379647.6965616389- 122.362750743647.5696153458- 122.293955301547.6565084085- 122.360570570647.5772706959- 122.301857092947.6636953872-122.33622518147.518552187-
  • 70. 122.391188202747.613483112-122.348432111447.6615375113- 122.313591080847.6516086237- 122.356066470547.6097485679-122.29010858147.6558721093- 122.356883912847.6123428474-122.329721846447.526971086- 122.272650426147.6459738129- 122.362324331247.6037507448- 122.308117076947.6242335889- 122.290418626947.7261976611- 122.301490146147.7255570168- 122.302399343647.6910934857- 122.364640020647.5684082524- 122.286214045247.5494823544- 122.317787771947.5292447862- 122.358525056947.5924299848- 122.301900251247.7227266354- 122.356684276647.6325968957- 122.398798959847.5625275097- 122.292439795147.6716905009- 122.385239065247.6524341561- 122.337853312947.6421518092- 122.369592775747.6433899897- 122.325821949447.5654363033- 122.390756506847.6389730057- 122.324887806947.6380629005- 122.277922831847.6674564047- 122.359880435147.6299568633-122.308609952647.619662372- 122.289556538747.6965313153- 122.317258767147.6190565218- 122.319734043947.5554631737- 122.272183819947.6794466877- 122.363549450347.6207252047- 122.317150245747.5737539459- 122.292719910247.6315263596-122.358426776147.566740773- 122.381084067947.6090318632-122.31548085247.5793103478- 122.292886018447.6337693483- 122.311949790147.6063162173-
  • 71. 122.294826208347.6067368958-122.29008773647.5514219196- 122.2808747054 Seattle Datahost_nameneighbourhoodlatitudelongituderoom_typepricen umber_of_reviewsMeganMadrona47.6108192763- 122.2908160022Entire home/apt29621Jess & JoeyRoosevelt47.6878010086-122.3134272739Private room8263MaddySouth Delridge47.5239795043- 122.3598905991Entire home/apt48462JoyceWallingford47.6541086069- 122.3376052882Entire home/apt90134AngielenaGeorgetown47.5506196981- 122.3201354141Private room65131SienaFirst Hill47.6080099819-122.3287386699Private room79406CassieFairmount Park47.5553892558- 122.3847386271Entire home/apt16536CassieFairmount Park47.5562356536-122.3859805062Entire home/apt12536JoyceWallingford47.654787431- 122.3365198846Entire home/apt12076LauraFairmount Park47.5652091275-122.3737475168Entire home/apt12557Mike & CassandraHigh Point47.5536456857-122.3632573252Private room5036Jess & JoeyMaple Leaf47.6957185793- 122.3119439187Private room6094Jess & JoeyMaple Leaf47.6972009726-122.313481029Private room10920JoyceWallingford47.6544767899- 122.3364642629Entire home/apt29980Jess & JoeyMaple Leaf47.6957369531-122.313163408Private room6073BobGreen Lake47.6872456761-122.3346957024Private room40126BobGreen Lake47.6882655474- 122.335855524Private room6070AngelaGreen Lake47.6840722784-122.3264884321Private room10017LauraFairmount Park47.555381734- 122.386222631Entire home/apt10591Seattle OasisBelltown47.6136155346-122.3470578149Entire home/apt14579Jess & JoeyMaple Leaf47.6953856705-
  • 72. 122.3130749476Entire home/apt199121Brad / LizAdams47.6733393883-122.395120282Entire home/apt89502Brad / LizAdams47.6736070968- 122.3938028594Private room79279IanBroadway47.622366025- 122.3159180004Entire home/apt200100TonyhaiHolly Park47.5341884029-122.2813932344Entire home/apt18919Seattle OasisBelltown47.6153962664- 122.3486637459Entire home/apt15779AmandaWhittier Heights47.6794116899-122.3705396261Entire home/apt70698JamilahBroadway47.6174259787- 122.3267562717Entire home/apt259143KellyEastlake47.6395260756- 122.3283787422Entire home/apt16559AlLoyal Heights47.6789013609-122.3818632746Entire home/apt7586TonyhaiSouth Park47.5254361097- 122.3290193368Entire home/apt2855DarrellLoyal Heights47.6880480751-122.3923099994Entire home/apt853SethWallingford47.6526306369- 122.3422171445Entire home/apt22594PinaMid-Beacon Hill47.5603489768-122.3140231906Entire home/apt9528MichaelWallingford47.6505515559- 122.3305886625Private room55234CarolWedgwood47.6924645956- 122.2868837689Private room5544Piper + KentWindermere47.6715870433-122.259947404Entire home/apt11039MarieGenesee47.5664287096- 122.380842213Entire home/apt24929Gus & ChelseaPhinney Ridge47.6794670377-122.3566000815Entire home/apt75219IrmgardWest Woodland47.6717143403- 122.3658875979Entire home/apt76216CarolWedgwood47.6942077243- 122.2862491662Private room5025CarolWedgwood47.6928151492- 122.2853364671Private room4025JeanSeward Park47.5616814291-122.272122828Private room70178GoldieBroadway47.6258516153-
  • 73. 122.3200413234Entire home/apt11015JaneNorth Admiral47.582391548-122.3944776132Private room7563TrungGreen Lake47.6842730779- 122.326615922Entire home/apt15017TrungGreen Lake47.6841569098-122.3259721542Entire home/apt25019AnneNorth Admiral47.5799961341- 122.4020445001Entire home/apt79118Roberta & DanHaller Lake47.7148851918-122.3329636496Entire home/apt120222MaryMid-Beacon Hill47.5525663188- 122.3043496443Entire home/apt13057DanniFremont47.6543710193- 122.3574537832Entire home/apt12539JudithAlki47.5687392259- 122.4064875075Private room100126HalFremont47.6523091071-122.3500045247Entire home/apt79352RalphWallingford47.6692278094- 122.3351737225Entire home/apt11092NatalieGreen Lake47.6822606054-122.3434499989Entire home/apt150251JoeBroadway47.6214209585- 122.3164195307Entire home/apt170154ShariSeward Park47.5550843545-122.2645532615Private room8556JanaHarrison/Denny-Blaine47.6189390326- 122.2921234178Private room75140JanaNorth Beacon Hill47.5837867009-122.3167696768Private room89348JulieMann47.612313045-122.2982521554Entire home/apt68344TaraPortage Bay47.6500847223- 122.3193145113Entire home/apt24916MarciaSunset Hill47.6699213774-122.4014638479Private room60413DesmondMinor47.6129415063- 122.3126359568Private room909NadineLower Queen Anne47.6276735193-122.3586108085Entire home/apt750207MichelleRainier Beach47.5114571958- 122.2560809959Private room8836Ray & EileenWest Queen Anne47.6354817084-122.3584777616Entire home/apt85279AndrewNorth Queen Anne47.6441308606- 122.3562991653Entire
  • 74. home/apt2501HarrietSeaview47.5454306533- 122.3978372712Entire home/apt78260DeniseColumbia City47.5528423227-122.2778935707Entire home/apt80153VidyaNorth Admiral47.5821599678- 122.3938715248Private room5979AmyGatewood47.5357006476-122.3863124082Entire home/apt89165AprylInternational District47.5960491227- 122.3178501021Entire home/apt15920Tim And PamPhinney Ridge47.6777046524-122.3598388521Entire home/apt24522KerryView Ridge47.6800375715- 122.2839834278Entire home/apt99143DavidBroadway47.621627392- 122.3169293076Entire home/apt212131FlorCrown Hill47.699898373-122.3661418047Private room8067JulieColumbia City47.5612970384- 122.2812186071Entire home/apt80340LoriBelltown47.6153386452- 122.347905293Entire home/apt200138Corinne & TomLoyal Heights47.682309278-122.3787496619Private room90131Rose And GlenFremont47.6569247665-122.3609348823Entire home/apt27576JudithPhinney Ridge47.6757467839- 122.3573890828Private room7530LoriBelltown47.6138602018- 122.3487873391Entire home/apt13989JudithPhinney Ridge47.6778094417-122.3586213199Private room9083Rose And GlenWhittier Heights47.6896610846- 122.3683941785Entire home/apt17081CherylLawton Park47.6611973366-122.4014455229Private room46167AngielenaGeorgetown47.5496907093- 122.3186791134Private room55134MichaelWest Woodland47.6680705341-122.36208616Entire home/apt120212WayneAlki47.5782293013- 122.4118121205Entire home/apt1602PaulMatthews Beach47.7063897406-122.2807456217Private room54142DanielleNorth Admiral47.5732655583- 122.3743611707Private room601MaijaNorth Queen Anne47.6432862428-122.3758186224Entire