Impact of unit cost on academic performance of public secondary education in kenya a case study of siaya district from 1997 to 2007
•
1 like•212 views

International peer-reviewed academic journals call for papers, http://www.iiste.org/Journals

Recommended
Recommended
More Related Content
What's hot
What's hot (19)
Similar to Impact of unit cost on academic performance of public secondary education in kenya a case study of siaya district from 1997 to 2007
Similar to Impact of unit cost on academic performance of public secondary education in kenya a case study of siaya district from 1997 to 2007 (20)
More from Alexander Decker
More from Alexander Decker (20)
Recently uploaded
Recently uploaded (20)
Impact of unit cost on academic performance of public secondary education in kenya a case study of siaya district from 1997 to 2007
- 1. Journal of Education and Practice www.iiste.org ISSN 2222-1735 (Paper) ISSN 2222-288X (Online) Vol.4, No.11, 2013 168 Impact of Unit Cost on Academic Performance of Public Secondary Education in Kenya: A Case Study of Siaya District from 1997 to 2007 James Ochieng Sika1* Prof. F.Q.Gravenir2 Dr. Andrew Riechi3 1.Department of Education Management, Maseno University, P.O.box Private Bag, Maseno 2.Department of Education Management, Kenyatta University, P.o.box 43844, Nairobi, Kenya. 3.Department of Education Planning, Nairobi University, P.O.box 30197, Nairobi, Kenya. *E-mail of the corresponding author: drjamessika@yahoo.com ABSTRACT The unit cost of secondary education has continued to increase steadily and especially the direct and indirect cost while outcomes are repeatedly unsatisfactory. The consequence of this would be that students in Siaya district lose hope and parents who have clearest interest in a high level of their children’s performance become disoriented with secondary schooling. The study focused on relationship between unit cost and academic performance at secondary level. The descriptive and causal comparative designs were used in this study. The study sample comprised 85 head teachers’, 765 teachers’, 3349 students and one DEO. Questionnaires’ and interview guides were used. Pearson’s correlation between unit cost in day secondary schools and performance index using raw scores reveal a coefficient of relationship of 0.372 while the constant variation shows a correlation of 0.372. In boarding secondary schools, Pearson’s correlation between unit cost and performance index using raw score and constant variation shows a correlation of 0.412. The correlation in most cases is low with an implication of very low relationship between unit cost and performance index. The implication of such a relationship is that a rise in unit cost does not necessary mean an increase in performance index and putting more resources as a mean of improving performance should be treated with caution. Key Terms:Unit Cost, Academic Performance Index, Impact 1.0 Introduction The human capital stock comprises cognitive and non-cognitive skills and is mainly produced in formal and non- formal educational system (UNDP, 2006). In the formal education system, secondary education is strategically placed in such a way that it connects primary education, tertiary education and the labour market. It plays a key role as a transition level of education that links basic education with skills and professional development without which one cannot achieve them (World Bank, 2005). The question confronting educators in every society is how to provide quality secondary education when unit cost has continued to rise and resources are scarce. In recent years, stakeholders in education in both industrialized and developing countries increasingly demand effective secondary schooling for their disadvantaged youth (Watkins, Watt & Buston, 2001). Yet providing quality and effective secondary education at lower unit cost is an overwhelming challenge to most governments, particularly those in developing countries (Atcharena &Hite, 2001). Students in many developing countries frequently go through their secondary education system without actually learning valuable basic skills that are crucial for their future survival (Cohen, Raudenbush & Ball, 2003). Are unit costs vital in contributing to the school performance? Insufficient financial resources are often cited as a root cause for the poor quality of education (CIDA, 2002). Most stakeholders in education readily believe that adding more money to schools will improve the quality of education and thereby, schools’ performance. However, production function studies in both industrialized and developing countries have produced findings that are inconsistent and mixed. Hanushek (1999) reported that in 12 studies on per pupil expenditure in developing countries, half were statistically significant, and the other half were found to be statistically insignificant. Whether secondary schools with greater access to more financial resources outperform others is still an issue demanding exploration in developing countries. Poor parents often find it difficult to make a projection of the payoff of their children’s education and cannot capture all the benefits of schooling, since these accrue across a child’s lifetime and are difficult to access in the immediate or short term (Herz and Sperling, 2005). According to Ngware et al. (2006b), since the late 1980s household’s investment to secondary education has risen considerably. Given that household contribution to physical facilities and instructional materials was meant to be optional, a growing proportion of households are making contributions below what is needed or are opting out of secondary education for their children - if they cannot afford the needed levies. In Siaya District, parents were responsible for meeting up to Ksh.9,914 of charges per annum. In addition, ‘development fund’, ‘caution money’ and ‘lunch fees’ were charged to parents
- 2. Journal of Education and Practice www.iiste.org ISSN 2222-1735 (Paper) ISSN 2222-288X (Online) Vol.4, No.11, 2013 169 increasing the unit cost annually. Although the unit cost has been high, the performance has been fluctuating and below average in most of the subjects and especially in languages, science and mathematics. By implication, few students are being admitted in competitive courses such as medicine, engineering and architecture. Parents are questioning how the system currently delivers secondary education. The objective of this study among others sought to answer this questions: Are changes in unit cost consistent with changes in performance index and what is the nature of their relationship? Methodology This study adopted descriptive (survey) and causal-comparative (ex-post facto) designs. Descriptive (survey) research describe systematically the facts and characteristics of a given population or area of interest, factually and accurately. Causal comparative research design is “ex-post facto” in nature, which means the data is collected after all the events of interest have occurred. The study was carried out in Siaya district, Nyanza province in Kenya. The district lies between latitude 00 26' to 00 18' North and Latitude 330 58' east and 340 33' West (Republic of Kenya, 2003e). The population of the study comprised 85 headteachers’, 749 teachers’, 3210 form 4 students’ and one DEO. In this study, stratified, systematic and purposive sampling methods were used. Data pertinent to the study were collected using questionnaire and interview schedules. Research Findings & Discussion Table 1 and Figure.1 shows unit cost derived from remuneration of teachers per annum, bursary and grants per student per annum giving overall unit government expenditure per student in Siaya district. Table 1: Unit Government Expenditure per Student (in Ksh.) Year Teacher salary per student Bursary per student Grants per student Unit government expenditure 2007 13,628 1,106 98 14,822 2006 13,183 996 167 14,346 2005 13,460 979 172 14,511 2004 12,494 655 96 13,149 2003 11,314 280 159 11,753 2002 11,029 265 - 11,294 2001 7,829 260 - 8,089 2000 6,459 246 - 6,704 1999 5,420 247 - 5,667 1998 4,900 232 - 5,132 1997 4,328 230 - 4,568 Authors’ Derivation Figure 1: Line Graph of Government Contribution to Cost per Student 0 2,000 4,000 6,000 8,000 10,000 12,000 14,000 16,000 19971998199920002001200220032004200520062007 Government cost per student Year
- 3. Journal of Education and Practice www.iiste.org ISSN 2222-1735 (Paper) ISSN 2222-288X (Online) Vol.4, No.11, 2013 170 Table 2: Actual Fees Paid. Items 1997 1998 1999 2000 2001 2002 2003 2004 2005 2006 2007 Board 8200 8500 8900 9000 9200 9500 10500 11600 12500 13400 14500 Tuition 2700 2700 2700 2700 3000 3000 3600 3600 3600 3650 3650 P.E 2400 2400 2700 2700 3000 3200 3300 3500 3600 4000 4565 R.M.I 500 500 500 500 500 500 500 500 500 800 800 Activity 500 500 500 500 800 800 800 800 800 900 900 Medical 200 200 200 200 200 200 200 200 400 400 400 L.T&T 600 600 600 675 675 675 800 800 1000 1000 1000 E.W.C 600 600 600 600 600 600 600 800 800 800 800 Conti. 400 450 450 450 450 500 600 600 600 900 900 PTA 2000 2000 2000 2000 2000 2000 2000 2000 2000 2000 2000 Dev. 3000 3000 3000 3000 3000 3000 3000 3000 3000 3000 3000 Lunch 1500 1500 1500 1500 1500 1500 1500 1500 1500 1500 1500 Caution* 500 500 500 500 500 500 500 500 500 500 500 Mock* 1000 1000 1000 1000 1000 1000 1000 1000 1000 1000 1000 Smasse - - - - - - 200 200 200 200 200 KNEC* 3700 3700 3700 3700 3700 3700 3700 3700 3700 3700 3700 Source: Authors’ Derivation *caution money – only form one and new students *mock – only form 4 students *KNEC – only form 4 students Table 2 shows the actual fees paid by parents in Siaya District from 1997 to 2007. Table 3 shows average unit cost in day and boarding secondary schools. It shows that day secondary schools were cheaper than boarding secondary schools. Table 3: Unit Cost in Day and Boarding Secondary Schools (in Ksh.) Year Household –cost per student in day Household- cost per student in boarding Government-Cost per student Unit cost in day Unit cost in boarding 2007 14,116 42,437 14,822 28,938 57,259 2006 13,600 40,296 14,346 27,946 54,642 2005 12,643 38,411 14,511 27,154 52,922 2004 12,486 35,649 13,149 25,635 48,798 2003 12,238 32,753 11,753 23,991 44,506 2002 11,486 30,269 11,294 22,770 41,563 2001 11,225 26,414 8,089 19,314 34,503 2000 10,240 24,029 6,704 16,944 30,733 1999 10,353 22,827 5,667 15,921 28,494 1998 10,100 21,582 5,132 15,032 26,714 1997 9,790 20,668 4,568 14,358 25,236 Authors’ Derivation Figure 2 shows both unit cost of day and boarding secondary schools. The elasticity of day secondary school curve was 1536 units while boarding secondary schools was 2177 units. The implication was that boarding cost was rising faster than day secondary schools.
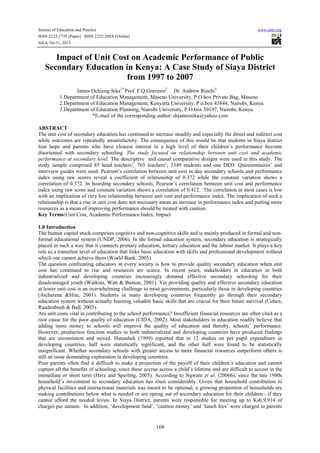
- 4. Journal of Education and Practice www.iiste.org ISSN 2222-1735 (Paper) ISSN 2222-288X (Online) Vol.4, No.11, 2013 171 Year Figure 2: Unit Cost of Day and Boarding Secondary Schools The trend of academic performance in the district can inform the education stakeholders whether resources being injected in secondary education are yielding much needed results. Table 4 show the mean performance index from 1997 to 2007 in Siaya District. Table 4: Mean performance index Year 1997 1998 1999 2000 2001 2002 2003 2004 2005 2006 2007 P.index 5.57 5.58 4.68 5.50 5.46 4.20 5.19 5.87 5.95 5.96 5.92 Table 4 shows that the mean performance index dropped in 1999 to 4.680 from 5.58 in 1998. The performance dropped to 4.20 in 2002 an all time low from 5.460 in 2001. However, it improved in preceding years to an all time high index of 5.96 in 2006. Deviation analysis Table 5 shows the deviation analysis of unit cost and performance index in current and constant growth (index) over the time series period 1997/98 to 2006/07. Table 5: Absolute and Constant Analysis of Unit Cost (in Ksh.) and Performance Index year Absolute analysis unit cost (day) Absolute analysis unit cost (board) Constant analysis unit cost (day) Constant analysis unit cost (board) Absolute analysis performance index Constant analysis performance index 2007 992 2617 14580 32023 -0.5 0.346 2006 792 1720 13588 29406 +0.0137 0.394 2005 1519 4124 12796 27686 +0.0829 0.371 2004 1644 4292 11277 23562 +0.6801 0.298 2003 1221 2943 9633 19270 +1.0925 0.374 2002 3456 7060 8412 16327 -1.2612 -1.374 2001 2370 3770 4956 9267 -0.381 -0.114 2000 1023 2239 2586 5497 +0.8185 -0.076 1999 889 1780 1563 3258 -0.9009 -0.894 1998 674 1478 674 1478 0.007 0.007 1997 0 0 0 0 0 0 Authors’ Derivation The absolute deviation analysis in Table 6 shows that the unit cost in day secondary schools rose from 674 units 0 10,000 20,000 30,000 40,000 50,000 60,000 70,000 80,000 90,000 1997 1998 1999 2000 2001 2002 2003 2004 2005 2006 Unit cost in Boarding Unit cost in day UnitCost(inKsh.) Key
- 5. Journal of Education and Practice www.iiste.org ISSN 2222-1735 (Paper) ISSN 2222-288X (Online) Vol.4, No.11, 2013 172 in 1997 to 3456 in 2002 then dropped to 1,221 units in 2003 and dropped further to 992 units in 2007. In boarding secondary schools, the unit costs rose from 1478 in 1997 to 7,060 in 2002 before fluctuating between 2003 and 2007where unit cost fell to 1,720 in 2006 and rose to 2,617 in 2007. The implication of fluctuation (Fig. 3) is that unit cost can rise and fall depending on the prevailing market situation dictated by inflationary rates and therefore parents are faced with unpredictable fee regime dictated by the institutions and prevailing circumstances. FIG. 3: Absolute Analysis Graph Under absolute deviation analysis, the performance was fluctuating from 1997 to 2002 with extreme cases of negative deviation reaching -1.26 in 2002 (see Figure 4). If we look at the growth in absolute terms, unit cost has been experiencing above average increase while performance index has been experiencing below average improvement. The implication of Figure 3 and 4 was that parents are faced with unpredictable fee regime and unsatisfactory academic performance therefore there is need for performance index and unit cost to be steadied. To the administrator of the school system allocations to education are seen less as absolute amounts but assessed more from the angle of quantity of inputs that such allocations can purchase. The purchasing power of allocations is therefore, considered more important from a management point of view than the absolute amount allocated and therefore as the purchasing of the school system diminish, they are forced to increase fees levied to parents but when savings are accrued, and then the fees are reduced in line with the government policy of the day. 0 2000 4000 6000 8000 10000 12000 1997 1998 1999 2000 2001 2002 2003 2004 2005 2006 2007 Absolute Bparding Absolute day Year AbsoluteMean(InKsh) Key
- 6. Journal of Education and Practice www.iiste.org ISSN 2222-1735 (Paper) ISSN 2222-288X (Online) Vol.4, No.11, 2013 173 Figure 4: Absolute Deviation Analysis for Performance index Constant Deviation Analysis For the constant deviation analysis, the base year was 1997. The performance index reveal a negative and fluctuating trend from 1997 to 2007. However, between 2003 to 2007, it tended to flatten out as shown in Figure 5.The implication of such a curve is that students and parents are faced with unpredictable performance trend. In terms of constant analysis, the unit cost in day secondary show an upward trend from 674 units in 1998 to a maximum of 14,580 units in 2007. In boarding secondary schools the unit cost rose from 1,478 in 1998 to 32,023 in 2007 as shown in Figure 6. The implication of such trends is that parents should be prepared to pay high fees according to agents demand and although, measures are being adopted to control unit cost faced by parents, still some loopholes exist to charge extra levies on parents increasing the cost of education. YEAR 20072006200520042003200220012000199919981997 ABSOLUTEPERFORMANCEINDEX 1.5 1.0 .5 0.0 -.5 -1.0 -1.5 ___ Performance Index Key
- 7. Journal of Education and Practice www.iiste.org ISSN 2222-1735 (Paper) ISSN 2222-288X (Online) Vol.4, No.11, 2013 174 Figure 5: Constant Analysis for Performance index Figure 6: Constant Unit Cost Analysis Nature and Impact of Relationship Between Unit Cost and Performance Index This section makes a comparison between unit cost and performance index between 1997 and 2007. The absolute deviation analysis shows that both unit cost and performance index have been fluctuating as shown in the Figures 3 and 4. Closer scrutiny reveals that although the deviation has been fluctuating, unit cost has enjoyed more positive deviation than performance. In absolute terms, the unit cost in day secondary schools grew 5.6 times between 1997 and 2002. In the period between 2003 and 2007, the growth experienced a decline averaging 1.3 times the 2003 units due to government regulations. In boarding secondary schools the unit cost grew 4.2 times between 1997 and 2002. It experienced fluctuations and decline between 2003 and 2007 averaging 1.1 times. On the whole the growth averaged 2.65 times in boarding schools. The government YEAR 2007200620052004200320022001200019991998.1997 ConstantPerfomanceindex .5 0.0 -.5 -1.0 -1.5 0 5000 10000 15000 20000 25000 30000 35000 40000 1997 1998 1999 2000 2001 2002 2003 2004 2005 2006 2007 Constant Boarding Consant Day Year ConstantUnitCost(inKsh.) ___ Constant Index Line Key Key
- 8. Journal of Education and Practice www.iiste.org ISSN 2222-1735 (Paper) ISSN 2222-288X (Online) Vol.4, No.11, 2013 175 contribution to unit cost grew by 5.6 units between 1997 and 2002. It also experienced fluctuations between 2003 and 2007 averaging 3 times that of the 2003 units. However under constant analysis, the household contribution to unit cost grew by 26 times in 2007compared to the 1997 figure for both day and boarding secondary schools. The constant analysis of government contribution to unit cost grew by 15 times in the period 1997 to 2007. The constant analysis of performance indicated fluctuations and therefore growth over time could not be measured appropriately. The administrators of the school system view unit costs differently. Unit cost of education are usually seen as absolute amounts but assessed more from the angle of the quantity of inputs that the unit cost can purchase. The purchasing power of the unit cost is therefore, considered more important from a management point of view than the absolute amounts allocated. Pearson’s correlation between unit cost in day secondary schools and performance index using raw scores reveal a coefficient of relationship of 0.372 while the constant variation shows a correlation of 0.372. In boarding secondary schools, Pearson’s correlation between unit cost and performance index using raw score and constant variation shows a correlation of 0.412. The correlation in most cases is low with an implication of very low relationship between unit cost and performance index. Conclusions The contribution of parents to funding secondary education outweigh the contribution of the government. Parent’s contribution has experience steady increase between 1997 to 2007. However academic performance has been fluctuating over the same time period. It was concluded that a rise in unit cost does not necessary mean an increase in performance index and therefore putting more resources as a means of improving performance should be treated with caution. To the school administrator, the purchasing power is more important than the absolute or constant performance index hitherto demanded by society. Recommendation The government should strengthen the audit arm of the Ministry of Education so that it can monitor the efficiency of utilization of financial resources at the disposal of secondary schools. There should be some efforts made towards sharing resources between district secondary schools and provincial secondary schools through structured agreement. For instance, many schools can gain access to resources of tacit knowledge and skills of specialized teachers (i.e markers, examiners, and science teachers) as those resources are contracted out by schools previously advantaged by exclusive access to these resources. REFERENCE Atchoarena, D. & Hite, S.J.(2001). Lifelong Learning Policies in Low Development Context: An African Perspective. In D. Aspin, J. Chapman, M. Hatton & Y. Sawano (Eds.), International Handbook of Lifelong Learning (201-228). Dordrecht/ Boston/London: Kluwer Publishers. CIDA (2002). CIDA Action plan on Basic Education.Montreal, Canada: Canadian International Agency. Cohen, D.K., Raudenbush, S.W. & Ball, D.L. (2003). Resources, Instruction & Research. Educational Evaluation and Policy Analysis. 25 (2), 119-142 District Education Office, Siaya (2008). Comprehensive KCPE and KCSE Analysis: Quality Education for Enhanced Development of Siaya District. Siaya : DEO Siaya district. Hanushek, E.A. (1999).“The evidence on class size”. In Earning and learning: How schools Matter.(Eds)S. E. Meyer and P. E. Peterson. Washington, D.C: Brookling Institution Hertz, B. & Sperling, G. (2004). What works in Girls Education?, Evidence and policies from the Developing World” .Washington DC: IMF. Ngware, M., Onsomu, E.N., Muthaka, D & Kusimbei, G. (2006). Improving Access to Secondary Education In Kenya: What can Be Done? Nairobi, Kenya: KIPPRA & Emerald Group Publishing Limited www.emeraldinsight.com/0261-0159.htm. Republic of Kenya (2003e). Siaya District Development Plan (2002 – 2008), Nairobi: Government printer. UNDP (2006). Kenya National Human Development Report 2006: Human Security and Human Development: A deliberate Choice. Retrieved on 20 october 2010 from http//wwk.ke.undp.org/06NHDRreport.pdf. Wainana, G. (2007). An Inequality Perspective of Education Structure and Performance in Kenya: Readings on inequality in Kenya: Sectorial Dynamics and Perspective. Retrieved from ideas.repec.org/n/rep- dev/2006-08-19.html-. Watkins, K., Watt, P. & Buston, O.(2001). Education Charges; A tax on Human Development (Oxfam Briefing Paper). London, Great Britain: Oxfam International. World Bank (2005). Education Sector Strategy Update: Achieving Education for All,Broadening our Perspective, Maximizing our Effectiveness. Washington DC: World Bank.
- 9. This academic article was published by The International Institute for Science, Technology and Education (IISTE). The IISTE is a pioneer in the Open Access Publishing service based in the U.S. and Europe. The aim of the institute is Accelerating Global Knowledge Sharing. More information about the publisher can be found in the IISTE’s homepage: http://www.iiste.org CALL FOR PAPERS The IISTE is currently hosting more than 30 peer-reviewed academic journals and collaborating with academic institutions around the world. There’s no deadline for submission. Prospective authors of IISTE journals can find the submission instruction on the following page: http://www.iiste.org/Journals/ The IISTE editorial team promises to the review and publish all the qualified submissions in a fast manner. All the journals articles are available online to the readers all over the world without financial, legal, or technical barriers other than those inseparable from gaining access to the internet itself. Printed version of the journals is also available upon request of readers and authors. IISTE Knowledge Sharing Partners EBSCO, Index Copernicus, Ulrich's Periodicals Directory, JournalTOCS, PKP Open Archives Harvester, Bielefeld Academic Search Engine, Elektronische Zeitschriftenbibliothek EZB, Open J-Gate, OCLC WorldCat, Universe Digtial Library , NewJour, Google Scholar