
Recommended
Recommended
More Related Content
Similar to EXTRA COST OF SPECIAL LEARNING NEEDS INCURED BY STUDENTS WITH DISABILITIES IN PUBLIC UNIVERISTIES IN KENYA.pdf
Similar to EXTRA COST OF SPECIAL LEARNING NEEDS INCURED BY STUDENTS WITH DISABILITIES IN PUBLIC UNIVERISTIES IN KENYA.pdf (20)
Recently uploaded
Recently uploaded (20)
EXTRA COST OF SPECIAL LEARNING NEEDS INCURED BY STUDENTS WITH DISABILITIES IN PUBLIC UNIVERISTIES IN KENYA.pdf
- 1. International Journal of Science Arts and Commerce Vol. 1 No. 7, September-2016 www.ijsac.net 35 EXTRA COST OF SPECIAL LEARNING NEEDS INCURRED BY STUDENTS WITH APPARENT DISABILITIES ENROLLED IN PUBLIC UNIVERSITIES: A CASE OF KENYATTA UNIVERSITY, KENYA Author: Judith Chepkorir Higher Education Loans Board P.O Box 69489-00400 Nairobi. Corresponding author: Dr. Beatrice Bunyasi Awori Special Needs Education Department Kenyatta University P.O Box 43844 00100, Nairobi. ABSTRACT While effort has been put in place to promote inclusion of students with disabilities in higher institutions worldwide, their access, retention and academic achievement is still a major issue of concern. This study examined the cost of participation in public universities incurred by students with selected disabilities (visual, hearing and physical disabilities) which would assist in developing an adequate funding model for these learners. The findings reveal that students with
- 2. International Journal of Science Arts and Commerce Vol. 1 No. 7, September-2016 www.ijsac.net 36 visual impairments incur high extra cost of inclusion in public university as compared to students with hearing and physical disabilities. The study revealed that, students with visual impairments enrolled in school-based programmes notably spend an average of Ksh. 54,500 for assistive devices and support services per academic year as compared to Ksh. 17,000 and Ksh.18, 000 for students with HI and PH respectively. On the other hand students with visual impairments enrolled in regular education programmes spent an average extra cost of Ksh. 56,830 per year on the assistive devices and support services required for their inclusion in public university as compared to Ksh. 47, 330 and Ksh. 54, 850 per year for students with physical handicap and students with hearing impairments respectively. Key Words: Cost, participation, students with disabilities, public universities INTRODUCTION Despite the fact that access to higher education is well established worldwide as national agenda to alleviating poverty and achieving a sustainable society, disparities persist in access, retention and academic qualification of marginalized groups. Most studies reveal that students with disabilities (SWDs) form the majority of the marginalized poor. According to the EFA Global Monitoring Report 2010, disability is recognized as one of the least visible yet most potent factors in educational marginalization. As a result, a dominant problem in the education of SWDs is that despite the fact that most of them go through primary and secondary education, very limited number are included in higher institutions of learning (UNESCO, 2004). In order to address these disparities, adequate investment in higher education for these learners is very crucial if national development is to be attained. From the point of view of educational finance, efficient and effective increased spending on higher education has contributed to reduce poverty and achieve better educational outcomes especially for SWDs (McCoy, Calvert, Smyth & Darmody, 2009). The benefits of higher education qualification for SWDs include increased workforce opportunities, democratic participation, reduction of welfare costs and future dependence, reduction of current dependence, increased employment or other productive activities among other life opportunities which in turn increases their potential productivity and wealth creation (World Bank, 2002). Kamal and Yasuyuki, (2009) further established that the rate of return of investment to higher education for SWDs is 19% to 32% which is worth the investment. The fact that disability also closes all other avenues of self-empowerment and leave education as the only tool for self-advancement, it is very critical to put in place measures to
- 3. International Journal of Science Arts and Commerce Vol. 1 No. 7, September-2016 www.ijsac.net 37 promote access, retention and academic performance of these learners if this rate of return on their investment is to be realized for a sustainable society. While every other rational mind wish to attain higher education qualification and to accrue its benefits, most studies have established that the cost of higher education, among other challenges is a major concern affecting access and retention of SWDs and other students from poor background in higher education. Wolanin, (2005) established that low-income SWDs, experience challenges in meeting the high costs of higher education due to extra cost associated with their disabilities as compared to their peers without disabilities. For instance, majority of SWDs take twice as long period in universities than their peers without disabilities, they also face additional years of room costs and semester fees which increase their cost of participation in higher education (IHEP, 2004; Wolanin, 2005). These extra costs include but not limited to costs of purchasing assistive devices, costs of adapting the learning curricula, cost of adapting school infrastructure and cost of supplying teaching aids and material to enhance their effective participation and communication (Johnson, 2006). It may also include the cost of providing accessible sanitation facilities, adaptations such as widening windows to allow more light in the classrooms, painting white lines across walkways as well as building ramps (Wolanin, 2005). It also includes the costs of diagnostics tests or a social service program such as vocational rehabilitation (Wolanin & Steel, 2004). To ensure that this challenge of high cost of education among SWDs is addressed, most international conventions mandate the world community to ensure highest policy and budgetary priority to meet adequate and appropriate accommodation for SWDS in the mainstream education setting (UNESCO, 1994). In Kenya, various policy documents including the report on the National Committee on Educational Objectives and Policies (Gachathi Report, 1976) specifically emphasize on a clear national strategy to support the specialized training and provision of special instructional materials and services for special education programs in mainstream education system. This includes but not limited to financial support to address the cost of higher education for these learners. These provisions will play a critical role in reducing the cost of education incurred by SWDs enrolled in these institutions of learning thus promoting their access and retention to completion. The Special Needs Education (SNE) policy (2010) and the Kenya Vision 2030 further sets out clear policy guidelines with regard to appropriate budgetary allocations for these provision to ensure that these learners have equal access to quality and relevant education. However, while these international conventions mandate that SWDs should be provided with adequate and appropriate modifications or accommodations to help them meet the academic requirements from governments and institutions of learning, enhancements beyond what the college provides must be borne by SWDs. In addition, the role of the government in effecting support provision for effective inclusion of SWDs is unclear (Gichura, 1999). This challenge may be largely attributed to lack of adequate and accurate information on how much these
- 4. International Journal of Science Arts and Commerce Vol. 1 No. 7, September-2016 www.ijsac.net 38 learners spent on the learning resources requisite for their effective inclusion in higher education. To ensure adequate provision for effective inclusion of SWDs in the mainstream education system, a well-structured funding arrangement is therefore, desirable. Increasingly, information on the cost of inclusion for these learners is required to provide insights to policy-makers to develop sustainable funding model to support the participation of this group. It is against this background that this study sought to establish the amount incurred by SWDs for their effective participation in higher education. STATEMENT OF THE PROBLEM Despite the fact that inclusion of SWDs spread over decades, their access, retention and completion in the mainstream higher institutions of learning is very limited. Out of about 115 million school-going population of SWDs world-wide, less than 40 million (35%) are included in higher institutions of learning. In Africa, out of the total 10% population of persons with disabilities, less than 1% is included in these institutions of higher learning, out of which the majority drop out during their first year (UNESCO, 2004). In Kenya, inclusion of SWDs in six public universities represents only 0.175% of the total university enrolments (Wawire, 2008). Most studies reveal that majority of these learners either cannot access or drop out because they cannot afford the cost of higher education due to its high costs and limited available financial support (Wolanin & Steel, 2004; Fosters, 2003). However, while there has been a significant increase in government financial support in an attempt to enhance participation of SWDs in public universities in Kenya, lack of adequate studies on their cost of participation, it is not clear whether the investments already made have been adequate to address the learning needs required for their effective participation. This study, therefore, sought to establish the cost of inclusion of SWDs in public universities which stood out as a gap to be addressed. PURPOSE OF THE STUDY The purpose of this study was to establish the cost of inclusion incurred by students with visual, hearing and physical disabilities enrolled in Kenyan public university per academic year.
- 5. International Journal of Science Arts and Commerce Vol. 1 No. 7, September-2016 www.ijsac.net 39 OBJECTIVES OF THE STUDY i. Establish the cost of assistive devices provided by students with visual, hearing and physical disabilities for their inclusion in a public university per academic year. ii. Establish the cost of support devices provided by students with visual, hearing and physical disabilities for their inclusion in a public university per academic year. THEORETICAL FRAMEWORK This study adopted the human Capital Theory. The theory outlines how financial aid affects individual choice of education as given by human capital models (Becker, 1993). The theory predicts that lower costs of education or equivalent increased financial support to curb the high cost of education, enhance enrolment of students to schooling. The theory states that investing in education and training creates ''human capital'', in form of knew knowledge, skills and desirable attributes, all of which increase employability and productive capacities of all the beneficiaries just the same way as investment in new physical assets. Human Capital theorists also argue that an individual will invest in education owing to the significant returns and therefore graduates should be expected to contribute to the cost of their Higher Education (Greenaway & Haynes, 2003). This implies that for each additional year of education and training completed a series of economic benefits flow to both the individual who has added to their stock of knowledge, and to the community/economy to which the individual contributes that knowledge. In his model of human capital investments, Becker (1964) suggests that students will pursue a college education if the perceived present discounted value (PDV) of the benefits of higher education exceeds the PDV of the costs of going to college. Human capital theory argues that education and training create ''human capital'', assets in form of knew knowledge, skill and desirable attributes, all of which increase employability and productive capacities of all the beneficiaries in just the same way as investment in new physical assets. Money spent on education, be it general or special education, represents an investment in individuals and society. Investment on inclusion of PWDs creates human capital which will eventually promote their self-empowerment, increase their employability and socio-economic development while lack of adequate financial support for inclusion of PWDs greatly affects their access and retention in higher education. Reducing the cost of going to college or financial aid may lower the real or perceived cost of attendance to the point whereby students on the margin of enrolling decide to matriculate.
- 6. International Journal of Science Arts and Commerce Vol. 1 No. 7, September-2016 www.ijsac.net 40 CONCEPTUAL FRAMEWORK Figure 1.1: Cost of Participation in Higher Education by SWD Dependent Variables Intervening Variables Dependent Variables Source: Researcher, 2012 Access and retention of SWDs in the mainstream higher education is an ultimate goal in ensuring equal educational opportunities for all. Financing policies that promote effective financial support for SWDs based on the special and regular learning needs that they require, type of disability and programme of study among other factors reduces the cost incurred by SWDs. These will in turn enhance their access and retention in higher education. The relationship between these variables is illustrated in Figure 1.1. Methodology The study adopted a mixed method research design which employs both qualitative and quantitative methods. Qualitative method was used to collect data on regular and support COST OF HIGHER EDUCATION TO SWDs Cost of regular learning needs Cost of special learning needs Access and Retention of SWDs in Higher Support provision required for inclusion Regular learning needs required for inclusion Level of financial support Programme of study Type of disabling condition Gender Age Policy on inclusion Institutiona l responsiven ess to inclusion
- 7. International Journal of Science Arts and Commerce Vol. 1 No. 7, September-2016 www.ijsac.net 41 services required for inclusion while qualitative data was used to collect data on cost of these requirements. This design was considered appropriate because it enabled the triangulation of results which ensured that the strengths of one method overcome the weaknesses of the other method thus strengthening quality and reliability of the findings. Study Variables The dependent variables included the type of disability, regular and support provision, type of sponsorship and the amount of available financial support, the dependent variable was the cost of inclusion per SWDs in public universities that is the cost of regular learning needs and the cost of assistive devices and support services while the intervening variables included the policy on inclusion and the institutional responsiveness towards inclusion of SWDs. Location of the Study The study was carried out at Kenyatta University main campus. Kenyatta University is located in Kahawa, about 23 Kilometres from Nairobi's City Centre, along the Nairobi-Thika road. This locale was selected purposively because it is the only public university that integrates the highest number of SWDs into various degree programmes in Kenya. It is also the only university that has established a disability office known as Directorate of Disability Services (DODS) which is mainly concerned with the provision of services and other affairs of SWDs in the university. Target Population The study targeted all one hundred and fifteen (115) undergraduate (regular and institutional- based) SWDs who were registered by DODS and were on session when the data was being collected. These comprised of eighty five students enrolled in regular education programme: sixty-two, twenty-one and two students with visual, physical and hearing impairments respectively. It also comprised of thirty students enrolled in institutional-based programmes: Eighteen students with visual impairments, seven students with physical disabilities and five students with hearing impairments. Sampling Techniques and Sample Size Sampling Techniques
- 8. International Journal of Science Arts and Commerce Vol. 1 No. 7, September-2016 www.ijsac.net 42 The study adopted a stratified random sampling technique. The total number of SWDs who were registered by DODS at the time when that data was being collected was first classified per programme of study and was further classified according to the type of disability. The population sample of more than twenty students per disability category was sampled but populations of less than twenty students were all examined. Sample Size A total of sixty (60) students with visual, hearing and physical disabilities were sampled as presented in table 3.5. Table 3.5: Sample Size of SWDs Category of SWDs Students with VI Students with HI Students with PH Total sample size of SWDs SWDs enrolled in REG 21 2 7 30 SWDs enrolled in IBP 18 5 7 30 Total 39 7 14 60 Research Instruments Questionnaires and interviews were used to collect data. Questionnaires Questionnaires were developed based on the research questions and they were used to gather information on the cost of support provisions and regular learning needs required for effective inclusion and the available level of funding for university education from the SWDs. Interview schedule Interview schedules were also used to collect data regarding regular and special learning needs required for inclusion of SWDs. This method calls for direct contact between the researcher and
- 9. International Journal of Science Arts and Commerce Vol. 1 No. 7, September-2016 www.ijsac.net 43 the respondent (Kothari, 2004). Interviews with students with hearing impairments were conducted with the help of sign language interpreter. Pilot Study Before the actual study, a pilot study was conducted in the University of Nairobi. The population sample comprised twenty (20) students with disabilities: Ten (10) students with visual impairments, seven (7) students with physical disabilities and three (3) with hearing impairments. The same instruments administered to the same group of respondent after a period of one month. The findings were analyzed and compared to establish validity and reliability of the instruments. Validity The validity of the instrument was tested through content validity and criterion validity. The test items of the research instruments were examined carefully with the guidance of the supervisors to ensure that they exhaustively answered the research questions and met the expectations of the research while the criterion validity was determined by subjecting the instrument to a pilot study. Reliability Reliability of the instruments was determined through test-retest method. The instruments were administered to the respondents and analyzed. After one month, the same instruments were administered to the same respondents and analyzed. The Spearman Rank Order was then used to compute the Correlation Co-efficient of the two answers. This helped in determining the extent to which the contents were consistent in producing similar results. Using the Pearson Product Moment Formula, a correlation of 0.05 confidence interval level was used to determine the reliability of the items in questionnaires. The internal consistency value of 0.98 was established and indicated the reliability of the instruments. Data Collection Procedures After the acquisition of research permit from the Ministry of Education, Science and Technology, the data were collected by the researcher using questionnaires and interviews. First, the researcher made a courtesy call to sample population of SWDs two weeks before data collection using the list and contacts obtained from Kenyatta University students with disability office (KUSDO) to seek their consent. All SWDs who expressed willingness to participate in the study were also contacted to arrange an appointment in a quiet place on campus or any other
- 10. International Journal of Science Arts and Commerce Vol. 1 No. 7, September-2016 www.ijsac.net 44 place according to their preference after two weeks of the first contact and one week before the data collection. During data collection, the purpose and procedure of the study were explained to the students before they responded to the questionnaires. The print questionnaires were converted to Braille for students who were totally blind while the font size of the questionnaires was magnified for persons with low vision to enhance their eligibility by the resource room assistance. The students then answered the research questionnaires individually within approximately forty minutes. The researcher personally administered the questionnaires and assisted the students by clarifying the questions where need be. Researcher also conducted interviews with SWDs on range of regular and special learning needs used for their inclusion in the university. Data Analysis Quantitative data on cost of assistive devices and support services were organized using a step- down costing methodology, which offered a relatively simple and practical approach to costing: This involved determining the cost centres, cost items for each cost centre, quantity/ frequencies of each cost centre, allocating the cost to each cost item using an appropriate allocation bases and finally analyzing cost per procedure. The analysis was then computed with the help of Statistical Package for Social Sciences (SPSS) version 13.1 computer software. Observational data were converted into a write-up based on concepts embedded in each observation question and the data obtained were then summarized, coded and analyzed using ATLAS ti software package. Results: Annual extra cost of special learning needs incurred by SWDs Most studies on the extra cost of education due to disability have focused on the institutional cost. This study sought to establish the extra cost expended by SWDs on special learning needs required for their inclusion in public universities. Figures 4.12, 4.13 and 4.14 summarize the results. Annual average cost of assistive devices incurred by students with visual impairment enrolled in regular education programmes The study sought to establish the cost of assistive devices incurred by students with visual impairment enrolled regular education programmes. Figure 4.13 presents the findings.
- 11. International Journal of Science Arts and Commerce Vol. 1 No. 7, September-2016 www.ijsac.net 45 Figure 4.1: Average cost of AD incurred by students with visual impairment enrolled in regular education programmes Figure 4.1 reveals that students with VI incur an extra cost of Ksh. 9,500 per year on AD for their inclusion: Approximately Ksh. 2,500 on magnifying classes, Ksh. 1,000 on white cane, Ksh. 1,500 on low vision aids, Ksh.1500 on tape recorders, Ksh. 1,500 on talking calculator and Ksh. 2,500 on other AD associated with visual disability. Annual average cost of support services incurred by students with visual impairments enrolled in regular education programmes The study also sought to establish the cost of support services incurred by students with visual impairments enrolled in regular education programmes. Figure 4.2 presents the findings. Figure 4.2: Average cost of support services incurred by students with VI enrolled in regular education programmes 0 500 1,000 1,500 2,000 2,500
- 12. International Journal of Science Arts and Commerce Vol. 1 No. 7, September-2016 www.ijsac.net 46 Figure 4.2 reveals that students with visual impairments spent an average of Ksh. 47, 330 per academic year on support services required for their inclusion: Ksh 11, 000 on readers, Ksh 12, 330 for personal guides, Ksh 12,000 for eye checkup and treatment, Ksh. 9,000 on vision therapy and at least Ksh. 3,000 for other special services. The other support service which was mainly required by these learners was note takers. This finding reveals that students with visual impairments spent almost twice on SS as compared to AD required for their inclusion. The finding support Holloway (2001) who conducted a small-scale study in the UK and found that SWDs incurred extra costs because of the disability and thus faced financial difficulties in paying for specific, often expensive, services deemed essential for the continuation of their studies. Annual average cost assistive devices and support services incurred by students with physical disabilities The study further sought to establish cost assistive devices and support services incurred by students with physical disabilities enrolled in regular education programmes. Figure 4.3 presents the findings. 0 2,000 4,000 6,000 8,000 10,000 12,000 14,000 Readers Guide Eye check Vision therapy Other services related to visual disabilities Series1
- 13. International Journal of Science Arts and Commerce Vol. 1 No. 7, September-2016 www.ijsac.net 47 Figure 4.3: Annual cost AD and SS incurred by students with PH Figure 4.3 reveals that students with PH enrolled in regular education spent an average of Ksh. 54, 850 on AD per academic year: Ksh. 16,000 on wheel chairs, Ksh. 12, 500 on crutches and Ksh. 9,800 on other AD. On the other hand, these students reported that they spent an average of Ksh. 9,750 for physical therapy and Ksh. 6,800 for disability related health care cost. This finding reveals that students with PH spent less on AD and SS and thus do not experience much financial challenges as compared to students with VI. Wolanin, (2005) established that the extra costs incurred by the institutions of higher learning on inclusion of SWDs included but not limited to the cost of providing accessible sanitation facilities, adaptations such as widening windows to allow more light in the classrooms, painting white lines across walkways as well as building ramps. Annual average cost assistive devices and support services incurred by students with hearing disabilities The study further sought to establish cost assistive devices and support services incurred by students with physical disabilities enrolled regular education programmes. Figure 4.4 presents the findings. 0 10,000 20,000 Wheel chairs Crutches Other AD Average cost AD incurred by students with PH enrolled in regular education programmes
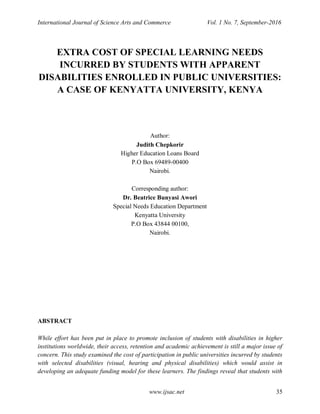
- 14. International Journal of Science Arts and Commerce Vol. 1 No. 7, September-2016 www.ijsac.net 48 Figure 4.4: Annual cost AD and SS incurred by students with hearing disabilities Figure 4.4 reveals that students with HI enrolled in Regular Education Programmes (IBP) spent an average of Ksh. 55, 840 on AD and SS required for their inclusion per academic year. This included Ksh. 33,500 on hearing aids, Ksh. 16,800 on sign language interpretation and Ksh. 5,540 on other SS related to hearing impairments. Annual extra cost of special learning needs incurred by SWDs enrolled in Institutional- based Programme The study also sought to establish the amount expended by SWDs who were enrolled in institutional-based programmes on support provision required for their inclusion in the university. Figure 4.5 presents the findings. Figure 4.5: Annual cost of special learning needs incurred by SWDs enrolled in institutional-based programme. 0 5,000 10,000 15,000 20,000 25,000 30,000 35,000 Hearing aids Sign language interpretation Others Series1
- 15. International Journal of Science Arts and Commerce Vol. 1 No. 7, September-2016 www.ijsac.net 49 Figure 4.5 summarizes the findings which reveals that students with visual impairments enrolled in IBP spent more than twice the amount spent by students with hearing and physical disabilities on AD and SS required for their inclusion. Students with VI notably spend an average of Ksh. 54,500 for both the assistive devices and support services per academic year as compared to Ksh. 17,000 and Ksh.18, 000 for students with HI and PH respectively. It is important to note that students enrolled in IBP spent less than students enrolled in regular education programmes because they spent only three months per academic year as compared to nine months for SWDs enrolled in regular programmes. Heather, (2000) found that the cost incurred by institution of learning on support provision for SWDs was exceedingly high with the average cost of $ 7,153.50 per year. The study further established that the cost of instruction for SWDs was the most expensive with a total cost of $ 4, 553 representing 68.16% of the total special education services expenditure with the cost of transportation contributing significantly at 17.05% while the cost of administration was the least expensive and accounted to 2.52% of the total expenditure. Conclusion In general, the cost of assistive devices and support services for SWDs are very high. The cost incurred by students with visual impairments being higher than the cost incurred by students with hearing and physical disabilities. Students with visual impairments enrolled in school-based programmes spent an average of Ksh. 54,500 for both the assistive devices and support services per academic year as compared to Ksh. 17,000 and Ksh.18, 000 for students with hearing and physical disabilities respectively. On the other hand students with visual impairments enrolled in regular education programmes spent an average extra cost of Ksh. 56,830 per year on the assistive devices and support services required for their inclusion in public university as compared to an average extra cost of Ksh. 47, 330 and Ksh. 54, 850 per year for students with physical handicap and students with hearing impairments respectively. 0 20,000 40,000 60,000 Students with VI Students with HI Students with PH 54,500 17,000 18,000 Series1
- 16. International Journal of Science Arts and Commerce Vol. 1 No. 7, September-2016 www.ijsac.net 50 Recommendations From the discussion and conclusions derived from the data collected and analyzed, the researcher suggests the following recommendations: i. The government financing agencies should provide adequate financial support to meet the extra costs for inclusion of SDWs in higher education so as to empower them academically. ii. The government should remove the import tax from the assistive devices and offer support services for free or at a subsidized cost to enhance its affordability especially for students with disabilities. iii. Universities and institutions of learning should establish units for registering, and solicit for funds from the government and non-governmental organizations. iv. Institutions of higher learning should provide stipend to encourage enrolment and completion of higher education among SWDs. v. The amount of financial support provided to SWDs should be increased to match their cost of participation in university education. vi. More of financial support should be provided to SWDs in the form of grants rather than loans. REFERENCES Angela, J., Robinson, C., O’Meara, L., & Amanda, H., (2006). The experiences of disabled students in higher education. The Higher Education Academy: University of Sussex. Becker, G. C.(1964). Human capital: A theoretical and empirical analysis, with special reference to education. New York: Columbia University Press Chaikind, S., Danielson, L.C. & Brauen, M. L. (1993). What do we know about the cost of special education? The Journal of Special Education, 26(4), 344-370. Chambers, S. (2002). The total expenditure used to educate students eligible for special education services. U.S.: The University of Chicago Press.
- 17. International Journal of Science Arts and Commerce Vol. 1 No. 7, September-2016 www.ijsac.net 51 Darmody, M., Smyth, E. & O’Connell, P., (2005). Eurostudent Survey 2004: Irish report. Dublin: Higher Education Authority Fosters, K. (2003). Special education eligibility and the learning disability category: Examining environmental, cultural and socio-economic factors. Dissertation report. Gichura, S. (1999).Education for all (EFA 2000): Assessment of progress. Kenya country report: Draft report. UNESCO. Heckman, J., & Krueger, A. (2004). Inequality in America: What role for human capital policy? Cambridge: MIT Press Heather, A. P (2000). Educating students with special needs: Fiscal story of three school divisions. Unpublished Doctoral Thesis: Saskatwn, Beat. Holloway, S. (2001). ‘The Experience of Higher Education from the Perspective of Disabled Students’. Disability and Society 16(4): 597-615 Ibua, M. & Macharia, F. (2010). Transforming higher education: Opportunities and challenges. Cost of higher education compared to average income of Kenyans. Journal of the KIM School of Management, 1, 12-24. Institute for Higher Education Policy [IHEP]. (2004). Higher education opportunities for students with disabilities. Washington, DC: Author. Kakalik, F. T. & Carney, L. (1991). The cost of special education. Rand Corporation: Santa Monica. Kamal L. & Yasuyuki S. (2009). Disability and Returns to Education in a Developing Country. Unpublished CIRJE Discussion Paper. Retrieved on 4th August, 2012 from http://www.e.u-tokyo.ac.jp/cirje
- 18. International Journal of Science Arts and Commerce Vol. 1 No. 7, September-2016 www.ijsac.net 52 Ministry of Education, (2009). A report on the task force on special needs education. Appraisal Exercise. Nairobi: KISE. MoEST, (2005). Deliveing quality education and training to all Kenyans. Kenya Education Support Programme 2005-2010. Ministry of Education, (1976). National Committee on Education Objectives (The Gachathi Report). Nairobi: Government Printer. Mugo J., Oranga, J. & Singal, N. (2010). Testing youth transition in Kenya: Are young people with disabilities falling through the cracks? Unpublished conference paper: Kenyatta University. National Council on Disability (NCD), (2003). People with Disabilities in Post-secondary Education: Journal of Student Financial Aid, 35(1), 17–26. Ngolovoi, M. (2006). Means testing of student loans in Kenya. Presented at the Comparative and International Higher Education Policy: Issues and Analysis Workshop: University at Albany OECD, (2003). Education policy analysis, diversity, inclusion and equity: Insights from special needs provision. Chapter 1, p.9-37, The Foundation of Tertiary Institutions of the Northern Metropolis (FOTIM), (2011). Disability in Higher Education. Project Report: South Africa UNESCO, (2010). Reaching the Marginalized: Education for All Global Monitoring Report. Paris: UNESCO. Wawire, V. (2009). Access and retention opportunities for students with disabilities in Kenya’s higher education: Strategies and experience from selected public Universities. Unpublished Doctoral Dissertation: Kenyatta University.
- 19. International Journal of Science Arts and Commerce Vol. 1 No. 7, September-2016 www.ijsac.net 53 Wolanin, T.R. (2005). Students with Disabilities Financial Aid Policy Issue. Journal of special education: Washington DC. Wolman, J. & Steel, L. (2010). Higher education opportunities for person with disabilities: Washington DC. McCoy, E., Calvert, E. S. & Merike, D. (2009). The Study on the Costs of Participation in Higher Education. Higher Education Authority: Dublin.