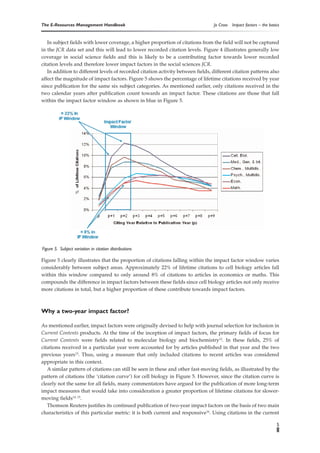
SlideShare a Scribd company logo
1 of 12
Download to read offline
The E-Resources Management Handbook                                            Jo Cross   Impact factors – the basics


Impact factors – the basics
JO CROSS
Market Research Manager
Taylor & Francis
                                                               The E-Resources Management Handbook – UKSG


                         This chapter is designed to be an introduction to impact factors and how they are
                         calculated. It goes on to look at some of the major issues that need to be consid-
                         ered when evaluating journal impact factors.The chapter considers implications
                         of the cause and effect of subject differences in impact factors and different
                         article types such as news items, editorials and review articles.The paper also
                         considers the skewed distribution of citations to articles within a journal and the
                         relationship between journal size and impact factor changes between years.


What are impact factors?

At the simplest level, journal impact factors give the average number of citations to articles in a particular
journal; essentially, the average number of times that articles in a journal are referenced by other articles.
Impact factors were conceptualized by Eugene Garfield and Irving H Sher in the 1960s as an aid to
evaluating journals for inclusion in Current Contents® and the Science Citation Index® 1, 2.
   An average citation measure was needed to account for the effects of the size and age of a journal on
the total number of citations it receives. Older and larger journals will generally receive more citations
because they have larger bodies of previously published articles available to be cited.
   Calculating an impact factor requires a denominator (the total number of articles published) and a
numerator (the total number of citations to those articles). A time period, or ‘window,’ needs to be defined
for both of these variables.
   The publication window is the period during which the articles included in the calculation were
published. The citation window is the period during which citations to these articles were counted.
   Today, the term ‘impact factor’ most commonly refers to figures calculated and published by Thomson
Reuters each year in the Science and Social Sciences Editions of the Journal Citation Reports (JCR). Thomson
had acquired ISI and all its products in 1992 and merged with Reuters in 2008 to form Thomson Reuters.
These figures give a two-year impact factor and use very specific publication and citation windows. The
citation window here is the impact factor year, and the publication window refers to the two previous
years. Therefore, the 2007 JCR impact factors (released in 2008) were calculated as follows:

            number of citations in 2007 to articles published in 2005 and 2006 in Journal X

                       number of articles published in 2005 and 2006 in Journal X

For example, the 2007 impact factor for Advances in Physics was calculated as follows:

Citations in 2007 to articles published in Advances in Physics in 2005 = 115
Citations in 2007 to articles published in Advances in Physics in 2006 = 86
Total citations received in 2007 to articles published in 2005 and 2006 = 201

Number of articles published in Advances in Physics in 2005 = 12
Number of articles published in Advances in Physics in 2006 = 9
Total number of articles published in 2005 and 2006 = 21


                                                                                                                   1
Impact factors – the basics   Jo Cross                                     The E-Resources Management Handbook


                                          citations in 2007 to articles published in 2005 and 2006
                   2007 impact factor =
                                              number of articles published in 2005 and 2006

                                                                   201
                   2007 impact factor for Advances in Physics =        = 9.571
                                                                    21

For the rest of this article ‘impact factor’ will refer to the two-year JCR impact factor unless stated otherwise.
  The use of the JCR model has the following implications:

■     each article published is included in the denominator for two impact factor years (the two years after
      the year of publication). Thus, an article published in 2005 will be included in both the 2006 and 2007
      impact factors
■     citations received in the year of publication or in the third year after publication or later will not count
      towards any impact factor calculation.

Impact factors have been adopted for use as measures of journal quality based on the premise that: “the
value of information is determined by those who use it” 3, the idea being that the value of a journal can be
measured by the number of times its use is formalized in the form of a citation. Thomson Reuters has
suggested that impact factors can be useful tools for the management of library journal collections. There
are, however, several issues associated with the use of impact factors as measures of quality and it is
important to understand these before utilizing impact factor data in any decision-making process. The rest
of this chapter will look in some depth at many of these issues.


Subject variation in impact factors

The average number of citations to articles during the two years after publication varies considerably
across different subject fields. This leads to impact factors of very different magnitudes between fields, as
illustrated in Figure 1. The impact factors plotted here are calculated by counting the number of citations
in the current year to articles published by all journals in the category in the two previous years then
dividing this by the total number of these articles. Thus, these figures represent the average number of
times an article in the field has been cited: the impact factor of the entire category.
    JCR category


                                                                Category aggregate impact factor

Figure 1. Impact factors for 15 categories from the 2007 JCRs

2
The E-Resources Management Handbook                                                      Jo Cross   Impact factors – the basics


   The 15 categories shown in Figure 1 are from a very wide range of fields from both the Science and
Social Sciences Editions of the JCR. However, even within a more closely-related group of subject
categories, there can be high variation in impact factors. This is illustrated in Figure 2, which shows the
category impact factors for nine sub-fields within physics.
   JCR category


                                                                     Category aggregate impact factor

Figure 2. Impact factors for nine physics categories from the 2007 JCR Science Edition


What causes subject variation in impact factors?

Subject variations in impact factor are due to both different levels and patterns of citation activity between
journals in different fields. Figure 3 shows the general magnitude of citation levels after publication for six
subject categories. As shown here, there are major differences in the number of citations to articles in each


Figure 3. Subject variation in citation levels after publication


                                                                                                                             3
Impact factors – the basics   Jo Cross                                                 The E-Resources Management Handbook


of the different subject areas, with those in cell biology, for example, receiving many more citations at all
points after publication than those in economics or maths.
   One possible reason for higher citation levels in some fields is variation in the average number of
authors per article. There is some evidence that highly-cited articles tend to have more authors4 and that
subject fields with more authors per paper tend to have higher impact factors5. This is probably due to the
tendency of authors to cite their own work and that of their research team.
   Varying publication behaviours in different subject fields also contribute to differing levels of citations;
for example, in many of the social sciences greater use is made of books as a method of dissemination than
in the hard sciences. This means that a relatively high proportion of references from journal articles in
these fields go to books6, reducing the total number of inter-journal citations. Equally, many of the citations
in these fields may come from references within books and these are mostly not captured by Thomson
Reuters7,8. In engineering a similar effect occurs with many citations going to material published in
conference proceedings rather than in traditional journals9.
   Applied fields also differ from basic research fields in terms of the total number of citations. Journals in
applied fields are more likely to reference journals in related basic research fields than other applied
journals. There is no comparable flow of citations back from the basic research journals. Thus, basic
research fields tend to receive more citations than related applied fields and, therefore, have higher impact
factors. For example, journals in basic medicine fields generally have higher impact factors than those in
clinical medicine fields10. We can also see from Figure 2 that the applied physics category has a relatively
low impact factor compared to most of the other physics categories.
   A difference in the level of coverage by Thomson Reuters across subject fields is another major
contributor to varying magnitudes of citation activity as measured by the JCR11. Citation data in the JCR
comes only from publications that are indexed by Thomson Reuters. Figure 4, which is based on data from
Ulrich’s Periodicals Directory, illustrates the different levels of coverage of journals by Thomson Reuters
across broad fields. Science subjects are in blue and social science and humanities subjects in yellow.


* Does not include titles only listed in the Arts & Humanities Citation Index

Figure 4. Percentage of active, refereed, academic/scholarly titles covered in the JCR by subject, according to Ulrichs (June 2008)

The source list for citations in the JCR is slightly broader than the journals covered within, additionally
incorporating any citations from titles covered in the Arts & Humanities Citation Index, ISI Proceedings
and the Biosis database. However, these additional sources do not compensate for the different levels of
coverage across fields.

4
The E-Resources Management Handbook                                               Jo Cross   Impact factors – the basics


   In subject fields with lower coverage, a higher proportion of citations from the field will not be captured
in the JCR data set and this will lead to lower recorded citation levels. Figure 4 illustrates generally low
coverage in social science fields and this is likely to be a contributing factor towards lower recorded
citation levels and therefore lower impact factors in the social sciences JCR.
   In addition to different levels of recorded citation activity between fields, different citation patterns also
affect the magnitude of impact factors. Figure 5 shows the percentage of lifetime citations received by year
since publication for the same six subject categories. As mentioned earlier, only citations received in the
two calendar years after publication count towards an impact factor. These citations are those that fall
within the impact factor window as shown in blue in Figure 5.


Figure 5. Subject variation in citation distributions

Figure 5 clearly illustrates that the proportion of citations falling within the impact factor window varies
considerably between subject areas. Approximately 22% of lifetime citations to cell biology articles fall
within this window compared to only around 8% of citations to articles in economics or maths. This
compounds the difference in impact factors between these fields since cell biology articles not only receive
more citations in total, but a higher proportion of these contribute towards impact factors.


Why a two-year impact factor?

As mentioned earlier, impact factors were originally devised to help with journal selection for inclusion in
Current Contents products. At the time of the inception of impact factors, the primary fields of focus for
Current Contents were fields related to molecular biology and biochemistry12. In these fields, 25% of
citations received in a particular year were accounted for by articles published in that year and the two
previous years13. Thus, using a measure that only included citations to recent articles was considered
appropriate in this context.
   A similar pattern of citations can still be seen in these and other fast-moving fields, as illustrated by the
pattern of citations (the ‘citation curve’) for cell biology in Figure 5. However, since the citation curve is
clearly not the same for all fields, many commentators have argued for the publication of more long-term
impact measures that would take into consideration a greater proportion of lifetime citations for slower-
moving fields14, 15.
   Thomson Reuters justifies its continued publication of two-year impact factors on the basis of two main
characteristics of this particular metric: it is both current and responsive16. Using citations in the current

                                                                                                                      5
Impact factors – the basics   Jo Cross                                 The E-Resources Management Handbook


year (where ‘current year’ refers to the impact factor year rather than the year of JCR publication, which
is the year after) and articles in the two previous years ensures that JCR impact factors are highly sensitive
to recent changes in citation activity.
    For example, a journal’s JCR impact factor will respond to papers or topical issues that receive an
abnormally high number of citations, but will not be skewed for more than two years. Using a longer
publication window would dilute these effects but would include them for a longer period. Thomson
Reuters considers this sensitivity to be one of the strengths of the JCR impact factor. However, it could also
be considered a weakness since it means that several years of impact factors need to be considered to
gauge the general impact of a title.
    Another advantage of the JCR impact factor is that it only requires three years’ worth of data (two
publication years and one citation year) to calculate. Alternative metrics that have been suggested, such
as five- or seven-year impact factors, would take over twice as long to produce. Considering the
importance that has been, rightly or wrongly, assigned to impact factors, this extended delay could be
highly detrimental to new journals trying to establish themselves.
    Currently, the two-year measure continues to be the only official impact factor published in the annual
JCR. Thomson Reuters, however, does acknowledge that a longer-term impact measure may be more
appropriate in some fields and recent communications with Thomson Reuters’ staff suggest that a five-
year measure may be included in a forthcoming update to the 2007 JCR.
    In the meantime, a couple of ways in which a five-year measure can be calculated from data available
in the JCR have been suggested17,18. Extended impact measures for journals can also be calculated from
data available in another Thomson Reuters product, the Journal Performance Indicators19. This product
allows comparison to field-specific baselines.


Consequences of subject variations in impact factors

The high variation in average impact across different subject areas means that impact factors cannot be
used to compare journals from different subject areas. This is why the journals covered by the JCR are
classified into fairly narrow subject categories. It is only at this level that journals should be ranked
according to their impact factors.
   Even within the JCR subject categories some journals will have a subject advantage over others, for
example, where a subject category contains both basic research and applied journals – practice-based and
educational journals often have particularly low impact factors compared to the basic research journals
listed in the same categories. There can also be a subject advantage in categories which are
multidisciplinary by nature, for example, social science journals such as the Journal of Sports Management
and Journal of the Philosophy of Sport in the sports sciences categories tend to rank lower than the majority
of the sports medicine titles in the same category. All these factors need to be considered when comparing
journal rankings within a subject category.
   Subject variation in impact factors is also one of the reasons it is unwise to create an ‘average impact
factor’ for a publisher’s entire list of journals. Now that many publishers offer ‘bulk sales deals’ it can be
tempting to try and gauge the quality of such an offering by creating an average impact factor for the
journals included in the deal. However, if subject differences mean that the impact factors of journals from
different fields cannot be compared, then it follows that the data should not be combined either. This sort
of publisher-wide averaging of impact factors will always favour publishers with strong life sciences
programmes over those with stronger social science programmes. Since impact factors can vary even
between quite closely related fields, as shown in Figure 2, averaging impact factors across even a single
subject package is unlikely to give a fair view of the quality of the package. The same is true of trying to
compare publishers on the basis of price per impact factor where journals from multiple JCR categories
are included in the analysis, for example, the LISU report on ‘Trends in Scholarly Journal Publishing’,
which combines such diverse categories as educational psychology and cell biology (which have 2007
category aggregate impact factors of 1.154 and 5.603, respectively) into one analysis on biomedical titles20.


6
The E-Resources Management Handbook                                            Jo Cross   Impact factors – the basics


Is every published item counted?

Many journals publish non-substantive items such as news articles, editorials, letters to the editor and
meeting abstracts, often referred to as ‘non-source items’. These items are usually never cited and, so that
journals publishing this material are not unduly penalized, they are not counted in the article total
(denominator) for JCR impact factor calculations.
   Although these ‘non-source items’ are rarely cited, there are exceptions and, interestingly, these
citations do count towards the citation total (the numerator of the calculation). This discrepancy between
what is counted in the two halves of the calculation arises due to the method used by the JCR division at
Thomson Reuters to count citations to a journal.
   The system searches the reference lists of articles published in the impact factor year for journal titles
and publication years only. Citations are not matched to individual published items and for that reason
the system does not differentiate between citations to source items and those to non-source items. So, for
example, in the reference below, the JCR would record a citation to the 2005 volume of Contemporary
Physics but would not capture any more detailed information about the actual article that had been cited.


  BIER, M. (2005) Modelling processive motor proteins: moving on two legs in the microscopic realm.
  CONTEMPORARY PHYSICS 46: 4.


Other departments at Thomson Reuters do match citation data at the individual article level and this
information is used to compile products such as ISI Journal Performance Indicators (JPI) and Essential Science
Indicators SM. The data used in the JCR, however, continues to be collected at the journal level.
   The consequence of this discrepancy is that journals publishing a large number of ‘non-source items’
(this is more common in some fields, such as medicine) or journals publishing particularly interesting
‘non-source items’ can have artificially inflated JCR impact factors. For these journals, citations are being
counted in the numerator to articles that are not counted in the denominator. These citations can be
considered to be ‘free’ citations.
   The number of non-source items published by particular journals can be found under the heading
‘Journal Source Data’ in the JCR. The number of ‘other items’ here refers to the number of non-source
items. This does not, however, give an indication of the number of citations these articles have received.


Review articles

Review articles, i.e. articles that attempt to sum up the current state of research on a particular topic, are
generally cited more often than primary research articles. This is because authors will often cite one review
article rather than the many primary research articles it is based on. Therefore review journals, or journals
that publish a significant amount of review content alongside their primary content, usually have higher
impact factors than other journals in their field. For example, analysing data from the 2007 JCR shows that
the aggregate 2007 impact factor for science journals publishing over 75% review articles is over 2.5 times
higher than the figure for the remaining journals.
   Although the JCR lists journals from different subject areas separately to take account of subject
variation in its impact factors, it does not list review journals separately from primary journals. Therefore
review journals and journals containing a high proportion of review content are often ranked amongst the
highest journals in their fields. For instance, the top three journals in the 2007 toxicology category are
review journals and the fourth ranked journal publishes over 25% review articles. The JCR also includes
figures on the number of review articles published by each journal that it covers in the ‘Journal Source
Data’ section. It is important to consider the proportion of review content when comparing the impact
factors of different journals.
   The variance in citation rates to different types of journals and journals with a different mix of articles
is another reason why it is unwise to calculate average impact factors across publisher lists. Publishers
with a large list of review journals will generally fare better in such comparisons.
                                                                                                                   7
Impact factors – the basics   Jo Cross                                              The E-Resources Management Handbook


Skewed distribution of citations

Impact factors are designed to be “a measure of the frequency with which the ‘average article’ in a journal has
been cited in a particular year” 21. However, the distribution of citations to articles within a journal is
generally highly skewed with a minority of articles receiving the majority of citations especially within the
narrow impact factor windows22,23,24.


Figure 6. Distribution of citations in 2007 to articles published in 2005 and 2006 for a journal with an impact factor of 4.651


This type of skew is clearly illustrated in Figure 6, which shows the distribution of citations in 2007 to
articles published in 2005 and 2006 for a journal with an impact factor (mean number of citations) of 4.651.
In this case over 80% of articles have less than the mean number of citations, while over 40% have zero
citations within this window. Here the mean is particularly skewed by one article which received 73
citations.
   What this means is that the impact factor often does not actually give a good indication of the frequency
with which the ‘average article’ has been cited. There have been calls for Thomson Reuters to produce a
median-based average for journals along with the mean25 but this would not be possible without a change
in the way the data is collected for the JCR. Data is currently collected at the journal level (see Is Every
Published Item Counted?) above and therefore measures which rely on distribution data such as medians
cannot be calculated from the current data set.


Journal size and impact factor variability

Impact factors can be highly variable from year to year, however, it is important not to read too much into
subtle changes in these figures, especially in smaller journals.
   Impact factors can be thought of as the mean number of citations to a biased sample of articles from the
population of all articles in that field26. Statistically, smaller samples will have greater sampling errors than
larger ones; that is, the mean values delivered by repeated sampling will be more variable. If we envisage
impact factors as repeated samples from the same population of articles, then we would expect the impact
factors of smaller journals to be more variable, year on year, than those of larger journals.
   Figure 7 shows the median change in JCR impact factor (either up or down) between 2006 and 2007, for
all journals in both JCR editions, grouped by journal size. This clearly illustrates that smaller journals have
more variable impact factors, on average, than larger ones.


8
The E-Resources Management Handbook                                                        Jo Cross   Impact factors – the basics


Figure 7. Median change in impact factor between 2006 and 2007 by journal size


Another way to look at this is to consider that a very small change in the total number of citations to a
journal that publishes relatively few articles a year will lead to quite a high percentage change in the
impact factor between years. This is especially true when we look at journals that have relatively low
impact factors to start with. For example, it only takes two extra citations to a journal with an impact factor
of 0.500 which publishes 20 articles a year (and so would have an impact factor denominator of 40) to
increase its score to 0.550, a 10% increase. Compare this to a much larger journal publishing 100 articles a
year with an impact factor of 4.000. This title would need to gain an extra 80 citations to see a 10% increase
to 4.400.
    It is important to bear this caveat in mind when evaluating any changes in JCR impact factor between
two years. If a journal is very small, then a relatively large change in impact factor (or a consistent increase
or decrease over several years) is required to demonstrate that there has been an underlying change in the
population from which the journal draws its articles.
    In addition to averaging impact factors across a list, it can be tempting to calculate the mean percentage
increase of a group of titles in an attempt to gauge the improvement of the list as a whole. However, the
high variability in impact factor is one reason to avoid this approach. In the theoretical examples given
above, both journals see an increase of 10% for very different changes in the actual number of citations
received between the two years. Both these changes would be given exactly the same weight in a simple
average of the percentage changes in impact factors across a list.
    There is also a definite increase bias in such a calculation. Table 1 illustrates how increases are given a
much higher weight in mean percentage change calculations. Suppose that two theoretical journals both
publish 20 articles per year, giving both titles an impact factor denominator of 40 (2 x 20), and that one title
gains six citations and the other loses six. The average absolute change in impact factor is zero but the
mean percentage change is +45% because the increase in citations leads to a 150% increase in impact factor
compared to only a 65% decrease for the loss of citations.
    This is an extreme and hypothetical example, but the principle holds across all increases and decreases.
It is worth bearing in mind that the highest possible percentage decrease for a journal is –100%, but there

                       Citations         IF year 1         Citations       IF year 2   Absolute Change         % Change
                       year 1                              year 2                      in IF                   in IF
 Journal A              4                0.100             10              0.250       +0.150                  +150%
 Journal B             10                0.250              4              0.001       –0.150                  –65%
 Average Change                                                                        0                       +45%

Table 1. Illustration of the increase bias in mean percentage change calculations


                                                                                                                               9
Impact factors – the basics   Jo Cross                                        The E-Resources Management Handbook


is no limit to how high a percentage increase can be. In fact there are four journals in the 2007 JCR which
have seen an impact factor increase of over 1000% compared to the 2006 figures.
   What this all means is that simple mean percentage increases across a list can be highly skewed by small
journals which have seen a high percentage change in impact factor due to only a small, and quite possibly
random, change in the number of citations received. This skew is even greater when the change is an
increase.


Further information

This chapter has covered some of the basic principles that should be considered when using the JCR
impact factors. It is not intended to be a completely comprehensive look at the myriad issues that
surround the many different ways in which this ubiquitous measure is used. Those interested in these
issues may wish to follow some of the references.

Data sources/acknowledgements

Data and charts included with kind permission of Thomson Reuters and ProQuest LLC. Data sources for
individual charts are also as follows:

■    Figures 1,2,3,5 and 7 – Journal Citation Reports®. Copyright © 2008 Thomson Reuters
■    Figure 4 – Ulrichsweb.com™. Copyright © 2008 ProQuest LLC. All rights reserved.
■    Figure 6 – Web of Science®. Copyright © 2008 Thomson Reuters.


References

1. The Thomson Scientific impact factor, Thomson Reuters essay. This essay was originally published in the Current
     Contents print editions June 20, 1994, when Thomson Scientific was known as The Institute for Scientific
     Information® (ISI®):
     http:/ thomsonreuters.com/business_units/scientific/free/essays/impactfactor/ (Accessed 5 January 2009)
           /
2. Garfield, E, Long term Vs. short-term journal impact: does it matter? The Scientist, 1998, 2(3) 10–12.
     http:/ www.garfield.library.upenn.edu/commentaries/tsv12(03)p10y19980202.pdf (Accessed 5 January 2009)
           /
3. History of citation indexing, Thomson Reuters essay:
     http:/ thomsonreuters.com/business_units/scientific/free/essays/history/ (Accessed 5 January 2009)
           /
4. Aksnes, D W, Characteristics of highly cited papers, Research Evaluation, 2003, 12(3) 159–170.
5. Amin, M and Mabe M, Impact factors: use and abuse, Perspectives in Publishing, 2000, 1.
     http:/ www.elsevier.com/framework_editors/pdfs/Perspectives1.pdf (Accessed 5 January 2009)
           /
6. Garfield, E, On the literature of the social sciences and the usage and effectiveness of the Social Sciences Citation
     Index. Current Contents, 1976, 34 5–10.
     http:/ www.garfield.library.upenn.edu/essays/v2p550y1974-76.pdf (Accessed 5 January 2009)
           /
7. Line, M B, Social science information – the poor relation. INSPEL 1999 33(3) 131–136.
     http:/ www.ifla.org/VII/d2/inspel/99-3libm.pdf (Accessed 5 January 2009)
           /
8. Harzing, A-W, & van der Wal, R, Google Scholar as a new source for citation analysis?, Ethics in Science and
     Environmental Politics, 2008, 8 (1) 62–71.
     http:/ www.harzing.com/download/gsdemo.pdf (Accessed 5 January 2009)
           /
9. Harzing, A-W, & van der Wal, R, ref. 8
10. Seglen, P O, Why the impact factor of journals should not be used for evaluating research, BMJ, 1997, 314 497.


10
The E-Resources Management Handbook                                                       Jo Cross   Impact factors – the basics


11. Althouse, B M et al, Differences in impact factor across fields and over time, Department of Economics, UCSB.
    Departmental Working Papers (Paper 2008-4-23), 2008.
    http:/ repositories.cdlib.org/ucsbecon/dwp/2008-4-23 (Accessed 5 January 2009)
          /
12. Garfield, E, The use of journal impact factors and citation analysis for evaluation of science. Paper presented at
    the 41st Annual Meeting of the Council of Biology Editors, Salt Lake City, UT, May 4, 1998 – April 17, 1998.
    http:/ www.garfield.library.upenn.edu/papers/eval_of_science_CBE(Utah).html (Accessed 5 January 2009)
          /
13. Garfield, E, The meaning of the impact factor, International Journal of Clinical and Health Psychology, 2003, 3(2)
    363–369.
    http:/ www.garfield.library.upenn.edu/papers/meaningofif2003.pdf (Accessed 5 January 2009)
          /
14. Garfield, E, ref. 2
15. Garfield, E, ref. 12
16. Althouse, B M, ref. 11
17. The Thomson Scientific impact factor, Thomson Reuters essay, ref. 1
18. How to calculate a five-year impact factor- JCR Online Help Section:
    http:/ admin-apps.isiknowledge.com/JCR/help/h_fiveyr_if.htm (Accessed 5 January 2009)
          /
19. Pringle, J, Trends in the use of ISI citation databases for evaluation, Learned Publishing, 2008, 21 85–91.
    http:/ dx.doi.org/10.1087/095315108X288901 (Accessed 5 January 2009)
          /
20. White, S and Creaser, C, Trends in Scholarly Journal Prices 2000-2006, (LISU Occasional Paper No. 37), 2007
    http:/ www.lboro.ac.uk/departments/ls/lisu/pages/publications/oup2.html (Accessed 5 January 2009)
          /
21. The Thomson Scientific impact factor, Thomson Reuters essay, ref. 1
22. Seglen, P O, ref. 10
23. Editorial, Not-so-deep impact, Nature, 2005, 435, 1003–1004.
    http:/ www.nature.com/nature/journal/v435/n7045/full/4351003b.html (Accessed 5 January 2009)
          /
24. Alder, R, Ewing, J and Taylor, P, Citation statistics: A report from the International Mathematical Union (IMU) in
    cooperation with the International Council of Industrial and Applied Mathematics (ICIAM) and the Institute of
    Mathematical Statistics, 2008:
    http:/ www.mathunion.org/fileadmin/IMU/Report/CitationStatistics.pdf (Accessed 5 January 2009)
          /
25. Rossner, M, Van Epps, H and Hill, E, Show me the data, Journal of Cell Biology, 2007, 179(6), 1091–1092.
    http:/ cb.rupress.org/cgi/doi/10.1083/jcb.200711140 (Accessed 5 January 2009)
          /
26. Amin, M and Mabe, M, ref. 5


© Jo Cross


■ Jo Cross
Market Research Manager
Taylor & Francis
4 Park Square
Milton Park
Abingdon
OX14 4RN
E-mail: jo.cross@tandf.co.uk


                                                                                                                             11
Impact factors – the basics   Jo Cross                                      The E-Resources Management Handbook


Biographical note

Jo graduated from Oxford University with a BA (Hons) in Experimental Psychology. She started her career
in academic journal publishing at Elsevier where she worked in various roles including author support,
journal management (Editorial) and as a Publishing Information Manager. Jo moved to Taylor & Francis
in 2004 to set up and run the Market Research Department.
   Studying and analysing citation and impact factor data has been a large component of Jo’s role since
she became a Publishing Information Manager in 2002. In 2007 she ran a briefing session on Impact Factors
at the annual UKSG conference.


  To view more chapters from The E-Resources Management Handbook, published by UKSG, click here:
                                         http://www.uksg.org/serials/handbook.asp


12

More Related Content

What's hot

Conducting a Literature Search & Writing Review Paper, Part 2: Finding proper...
Conducting a Literature Search & Writing Review Paper, Part 2: Finding proper...Conducting a Literature Search & Writing Review Paper, Part 2: Finding proper...
Conducting a Literature Search & Writing Review Paper, Part 2: Finding proper...Nader Ale Ebrahim
 
Journal ranking metrices new perspective in journal performance management
Journal ranking metrices   new perspective in journal performance managementJournal ranking metrices   new perspective in journal performance management
Journal ranking metrices new perspective in journal performance managementAboul Ella Hassanien
 
Research metrics Apr2013
Research metrics Apr2013Research metrics Apr2013
Research metrics Apr2013Naz Torabi
 
Theoretical Framework and Hypothesis Development
Theoretical Framework and Hypothesis DevelopmentTheoretical Framework and Hypothesis Development
Theoretical Framework and Hypothesis DevelopmentMuhammad Ayyoub, PhD
 
Impact Factor and the Evaluation of Scientists - a book chapter by Nicola de ...
Impact Factor and the Evaluation of Scientists - a book chapter by Nicola de ...Impact Factor and the Evaluation of Scientists - a book chapter by Nicola de ...
Impact Factor and the Evaluation of Scientists - a book chapter by Nicola de ...Xanat V. Meza
 
International Journal of Humanities and Social Science Invention (IJHSSI)
International Journal of Humanities and Social Science Invention (IJHSSI)International Journal of Humanities and Social Science Invention (IJHSSI)
International Journal of Humanities and Social Science Invention (IJHSSI)inventionjournals
 
Trentin, Forza and Perin, 2015
Trentin, Forza and Perin, 2015Trentin, Forza and Perin, 2015
Trentin, Forza and Perin, 2015Alessio Trentin
 
What is bibliometrics and how does it work?
What is bibliometrics and how does it work?What is bibliometrics and how does it work?
What is bibliometrics and how does it work?Ciarán Quinn
 

What's hot (11)

Conducting a Literature Search & Writing Review Paper, Part 2: Finding proper...
Conducting a Literature Search & Writing Review Paper, Part 2: Finding proper...Conducting a Literature Search & Writing Review Paper, Part 2: Finding proper...
Conducting a Literature Search & Writing Review Paper, Part 2: Finding proper...
 
Journal ranking metrices new perspective in journal performance management
Journal ranking metrices   new perspective in journal performance managementJournal ranking metrices   new perspective in journal performance management
Journal ranking metrices new perspective in journal performance management
 
Research metrics Apr2013
Research metrics Apr2013Research metrics Apr2013
Research metrics Apr2013
 
Theoretical Framework and Hypothesis Development
Theoretical Framework and Hypothesis DevelopmentTheoretical Framework and Hypothesis Development
Theoretical Framework and Hypothesis Development
 
Cox 2016
Cox 2016Cox 2016
Cox 2016
 
Google Trends
Google TrendsGoogle Trends
Google Trends
 
Impact Factor and the Evaluation of Scientists - a book chapter by Nicola de ...
Impact Factor and the Evaluation of Scientists - a book chapter by Nicola de ...Impact Factor and the Evaluation of Scientists - a book chapter by Nicola de ...
Impact Factor and the Evaluation of Scientists - a book chapter by Nicola de ...
 
Citation analysis
Citation analysisCitation analysis
Citation analysis
 
International Journal of Humanities and Social Science Invention (IJHSSI)
International Journal of Humanities and Social Science Invention (IJHSSI)International Journal of Humanities and Social Science Invention (IJHSSI)
International Journal of Humanities and Social Science Invention (IJHSSI)
 
Trentin, Forza and Perin, 2015
Trentin, Forza and Perin, 2015Trentin, Forza and Perin, 2015
Trentin, Forza and Perin, 2015
 
What is bibliometrics and how does it work?
What is bibliometrics and how does it work?What is bibliometrics and how does it work?
What is bibliometrics and how does it work?
 

Viewers also liked

Presentatie 1+1=3
Presentatie 1+1=3Presentatie 1+1=3
Presentatie 1+1=3Docuzmc
 
Leerportaal praktijkverhalen
Leerportaal praktijkverhalenLeerportaal praktijkverhalen
Leerportaal praktijkverhalenDocuzmc
 
Leren leuk maken
Leren leuk makenLeren leuk maken
Leren leuk makenDocuzmc
 
Medeco college
Medeco collegeMedeco college
Medeco collegeDocuzmc
 
Leercoaching
LeercoachingLeercoaching
LeercoachingDocuzmc
 
E portfolio
E portfolioE portfolio
E portfolioDocuzmc
 
Rv Introduction
Rv IntroductionRv Introduction
Rv Introductiontpcrawford
 
E learningcontent kopen of ontwikkelen
E learningcontent kopen of ontwikkelenE learningcontent kopen of ontwikkelen
E learningcontent kopen of ontwikkelenDocuzmc
 

Viewers also liked (10)

Presentatie 1+1=3
Presentatie 1+1=3Presentatie 1+1=3
Presentatie 1+1=3
 
Leerportaal praktijkverhalen
Leerportaal praktijkverhalenLeerportaal praktijkverhalen
Leerportaal praktijkverhalen
 
Kertesz
KerteszKertesz
Kertesz
 
Leren leuk maken
Leren leuk makenLeren leuk maken
Leren leuk maken
 
Medeco college
Medeco collegeMedeco college
Medeco college
 
Leercoaching
LeercoachingLeercoaching
Leercoaching
 
E portfolio
E portfolioE portfolio
E portfolio
 
Rv Introduction
Rv IntroductionRv Introduction
Rv Introduction
 
E learningcontent kopen of ontwikkelen
E learningcontent kopen of ontwikkelenE learningcontent kopen of ontwikkelen
E learningcontent kopen of ontwikkelen
 
Success
SuccessSuccess
Success
 

Similar to Impact factors-the basics-cross_uksg

What is wrong with Journals' Impact Factor
What is wrong with Journals' Impact Factor What is wrong with Journals' Impact Factor
What is wrong with Journals' Impact Factor Ahmed-Refat Refat
 
Research workshop presentation unisa
Research workshop presentation unisaResearch workshop presentation unisa
Research workshop presentation unisaerasmus01
 
research methodology research methodology
research methodology research methodologyresearch methodology research methodology
research methodology research methodologyYassine Maleh, Ph.D.
 
Using Impact Factors in Research & Publication
Using Impact Factors in Research & PublicationUsing Impact Factors in Research & Publication
Using Impact Factors in Research & PublicationRebecca Kate Miller
 
Modified CiteScore metric for reducing the effect of self-citations
Modified CiteScore metric for reducing the effect of self-citationsModified CiteScore metric for reducing the effect of self-citations
Modified CiteScore metric for reducing the effect of self-citationsTELKOMNIKA JOURNAL
 
Research Metrics
Research Metrics Research Metrics
Research Metrics Naz Torabi
 
Basic Journal Terminology_2016
Basic Journal Terminology_2016Basic Journal Terminology_2016
Basic Journal Terminology_2016Atiqa khan
 
Journal ranking metrices new perspective in journal performance management
Journal ranking metrices   new perspective in journal performance managementJournal ranking metrices   new perspective in journal performance management
Journal ranking metrices new perspective in journal performance managementAboul Ella Hassanien
 
Scholarly impact metrics traditions
Scholarly impact metrics traditionsScholarly impact metrics traditions
Scholarly impact metrics traditionsntunmg
 
TheImpactFactorDefined.pdf
TheImpactFactorDefined.pdfTheImpactFactorDefined.pdf
TheImpactFactorDefined.pdfPankajGurjar23
 
Prof. sp singh.ph d.course work.2020-21.citation index, journal impact factor...
Prof. sp singh.ph d.course work.2020-21.citation index, journal impact factor...Prof. sp singh.ph d.course work.2020-21.citation index, journal impact factor...
Prof. sp singh.ph d.course work.2020-21.citation index, journal impact factor...Saurashtra University
 
Journal and author impact measures Assessing your impact (h-index and beyond)
Journal and author impact measures Assessing your impact (h-index and beyond)Journal and author impact measures Assessing your impact (h-index and beyond)
Journal and author impact measures Assessing your impact (h-index and beyond)Aboul Ella Hassanien
 
JournalPublication101_ItsAJungleOutThere.pdf
JournalPublication101_ItsAJungleOutThere.pdfJournalPublication101_ItsAJungleOutThere.pdf
JournalPublication101_ItsAJungleOutThere.pdfssuserf7dad3
 
MedicReS Conference 2017 Istanbul - Journal Metrics: The Impact Factor and Al...
MedicReS Conference 2017 Istanbul - Journal Metrics: The Impact Factor and Al...MedicReS Conference 2017 Istanbul - Journal Metrics: The Impact Factor and Al...
MedicReS Conference 2017 Istanbul - Journal Metrics: The Impact Factor and Al...MedicReS
 
Elsevier - MedicReS World Congress 2011
Elsevier - MedicReS World Congress 2011Elsevier - MedicReS World Congress 2011
Elsevier - MedicReS World Congress 2011MedicReS
 
WoS 3 Journal Citation reports
WoS 3 Journal Citation reportsWoS 3 Journal Citation reports
WoS 3 Journal Citation reportsEISLibrarian
 
Thompson reuters metrics and selecting journals
Thompson reuters metrics and selecting journalsThompson reuters metrics and selecting journals
Thompson reuters metrics and selecting journalsInternet Medical Society
 

Similar to Impact factors-the basics-cross_uksg (20)

What is wrong with Journals' Impact Factor
What is wrong with Journals' Impact Factor What is wrong with Journals' Impact Factor
What is wrong with Journals' Impact Factor
 
Impact factor of a Journal – A Mini Review
Impact factor of a Journal – A Mini ReviewImpact factor of a Journal – A Mini Review
Impact factor of a Journal – A Mini Review
 
Research workshop presentation unisa
Research workshop presentation unisaResearch workshop presentation unisa
Research workshop presentation unisa
 
research methodology research methodology
research methodology research methodologyresearch methodology research methodology
research methodology research methodology
 
Research_Methodology_L2_CBB.pptx
Research_Methodology_L2_CBB.pptxResearch_Methodology_L2_CBB.pptx
Research_Methodology_L2_CBB.pptx
 
Using Impact Factors in Research & Publication
Using Impact Factors in Research & PublicationUsing Impact Factors in Research & Publication
Using Impact Factors in Research & Publication
 
Modified CiteScore metric for reducing the effect of self-citations
Modified CiteScore metric for reducing the effect of self-citationsModified CiteScore metric for reducing the effect of self-citations
Modified CiteScore metric for reducing the effect of self-citations
 
Research Metrics
Research Metrics Research Metrics
Research Metrics
 
Basic Journal Terminology_2016
Basic Journal Terminology_2016Basic Journal Terminology_2016
Basic Journal Terminology_2016
 
Journal ranking metrices new perspective in journal performance management
Journal ranking metrices   new perspective in journal performance managementJournal ranking metrices   new perspective in journal performance management
Journal ranking metrices new perspective in journal performance management
 
SPM_Metrics_WhitePaper_3
SPM_Metrics_WhitePaper_3SPM_Metrics_WhitePaper_3
SPM_Metrics_WhitePaper_3
 
Scholarly impact metrics traditions
Scholarly impact metrics traditionsScholarly impact metrics traditions
Scholarly impact metrics traditions
 
TheImpactFactorDefined.pdf
TheImpactFactorDefined.pdfTheImpactFactorDefined.pdf
TheImpactFactorDefined.pdf
 
Prof. sp singh.ph d.course work.2020-21.citation index, journal impact factor...
Prof. sp singh.ph d.course work.2020-21.citation index, journal impact factor...Prof. sp singh.ph d.course work.2020-21.citation index, journal impact factor...
Prof. sp singh.ph d.course work.2020-21.citation index, journal impact factor...
 
Journal and author impact measures Assessing your impact (h-index and beyond)
Journal and author impact measures Assessing your impact (h-index and beyond)Journal and author impact measures Assessing your impact (h-index and beyond)
Journal and author impact measures Assessing your impact (h-index and beyond)
 
JournalPublication101_ItsAJungleOutThere.pdf
JournalPublication101_ItsAJungleOutThere.pdfJournalPublication101_ItsAJungleOutThere.pdf
JournalPublication101_ItsAJungleOutThere.pdf
 
MedicReS Conference 2017 Istanbul - Journal Metrics: The Impact Factor and Al...
MedicReS Conference 2017 Istanbul - Journal Metrics: The Impact Factor and Al...MedicReS Conference 2017 Istanbul - Journal Metrics: The Impact Factor and Al...
MedicReS Conference 2017 Istanbul - Journal Metrics: The Impact Factor and Al...
 
Elsevier - MedicReS World Congress 2011
Elsevier - MedicReS World Congress 2011Elsevier - MedicReS World Congress 2011
Elsevier - MedicReS World Congress 2011
 
WoS 3 Journal Citation reports
WoS 3 Journal Citation reportsWoS 3 Journal Citation reports
WoS 3 Journal Citation reports
 
Thompson reuters metrics and selecting journals
Thompson reuters metrics and selecting journalsThompson reuters metrics and selecting journals
Thompson reuters metrics and selecting journals
 

More from Docuzmc

Zicht op bekwaamheid, al toetsend leert men
Zicht op bekwaamheid, al toetsend leert menZicht op bekwaamheid, al toetsend leert men
Zicht op bekwaamheid, al toetsend leert menDocuzmc
 
Presentatie themasessie businesscase
Presentatie themasessie businesscasePresentatie themasessie businesscase
Presentatie themasessie businesscaseDocuzmc
 
Praktijkverhaal uit het erasmus mc
Praktijkverhaal uit het erasmus mcPraktijkverhaal uit het erasmus mc
Praktijkverhaal uit het erasmus mcDocuzmc
 
Permanente educatie
Permanente educatiePermanente educatie
Permanente educatieDocuzmc
 
Next page
Next pageNext page
Next pageDocuzmc
 
New spring
New springNew spring
New springDocuzmc
 
Learning solutions
Learning solutionsLearning solutions
Learning solutionsDocuzmc
 
Learning guide
Learning guideLearning guide
Learning guideDocuzmc
 
Impact factors-the basics-cross_uksg
Impact factors-the basics-cross_uksgImpact factors-the basics-cross_uksg
Impact factors-the basics-cross_uksgDocuzmc
 
Foutenxref
FoutenxrefFoutenxref
FoutenxrefDocuzmc
 
E portfolio
E portfolioE portfolio
E portfolioDocuzmc
 
E learningcontent kopen of ontwikkelen
E learningcontent kopen of ontwikkelenE learningcontent kopen of ontwikkelen
E learningcontent kopen of ontwikkelenDocuzmc
 
Content ontwikkelen
Content ontwikkelenContent ontwikkelen
Content ontwikkelenDocuzmc
 
Checklist zelf maken of kopen
Checklist zelf maken of kopenChecklist zelf maken of kopen
Checklist zelf maken of kopenDocuzmc
 
Bakker mbi 2001-39-40(2)
Bakker mbi 2001-39-40(2)Bakker mbi 2001-39-40(2)
Bakker mbi 2001-39-40(2)Docuzmc
 
Artikel tvz elp0001cor
Artikel tvz elp0001corArtikel tvz elp0001cor
Artikel tvz elp0001corDocuzmc
 
Content ontwikkelen
Content ontwikkelenContent ontwikkelen
Content ontwikkelenDocuzmc
 
Checklist zelf maken of kopen
Checklist zelf maken of kopenChecklist zelf maken of kopen
Checklist zelf maken of kopenDocuzmc
 

More from Docuzmc (20)

Zicht op bekwaamheid, al toetsend leert men
Zicht op bekwaamheid, al toetsend leert menZicht op bekwaamheid, al toetsend leert men
Zicht op bekwaamheid, al toetsend leert men
 
Presentatie themasessie businesscase
Presentatie themasessie businesscasePresentatie themasessie businesscase
Presentatie themasessie businesscase
 
Praktijkverhaal uit het erasmus mc
Praktijkverhaal uit het erasmus mcPraktijkverhaal uit het erasmus mc
Praktijkverhaal uit het erasmus mc
 
Permanente educatie
Permanente educatiePermanente educatie
Permanente educatie
 
Next page
Next pageNext page
Next page
 
New spring
New springNew spring
New spring
 
Learning solutions
Learning solutionsLearning solutions
Learning solutions
 
Learning guide
Learning guideLearning guide
Learning guide
 
Impact factors-the basics-cross_uksg
Impact factors-the basics-cross_uksgImpact factors-the basics-cross_uksg
Impact factors-the basics-cross_uksg
 
Foutenxref
FoutenxrefFoutenxref
Foutenxref
 
E portfolio
E portfolioE portfolio
E portfolio
 
E learningcontent kopen of ontwikkelen
E learningcontent kopen of ontwikkelenE learningcontent kopen of ontwikkelen
E learningcontent kopen of ontwikkelen
 
Edugidz
EdugidzEdugidz
Edugidz
 
Content ontwikkelen
Content ontwikkelenContent ontwikkelen
Content ontwikkelen
 
Checklist zelf maken of kopen
Checklist zelf maken of kopenChecklist zelf maken of kopen
Checklist zelf maken of kopen
 
Bakker mbi 2001-39-40(2)
Bakker mbi 2001-39-40(2)Bakker mbi 2001-39-40(2)
Bakker mbi 2001-39-40(2)
 
Artikel tvz elp0001cor
Artikel tvz elp0001corArtikel tvz elp0001cor
Artikel tvz elp0001cor
 
Edugidz
EdugidzEdugidz
Edugidz
 
Content ontwikkelen
Content ontwikkelenContent ontwikkelen
Content ontwikkelen
 
Checklist zelf maken of kopen
Checklist zelf maken of kopenChecklist zelf maken of kopen
Checklist zelf maken of kopen
 

Recently uploaded

Paris 2024 Olympic Geographies - an activity
Paris 2024 Olympic Geographies - an activityParis 2024 Olympic Geographies - an activity
Paris 2024 Olympic Geographies - an activityGeoBlogs
 
BASLIQ CURRENT LOOKBOOK LOOKBOOK(1) (1).pdf
BASLIQ CURRENT LOOKBOOK  LOOKBOOK(1) (1).pdfBASLIQ CURRENT LOOKBOOK  LOOKBOOK(1) (1).pdf
BASLIQ CURRENT LOOKBOOK LOOKBOOK(1) (1).pdfSoniaTolstoy
 
Hybridoma Technology ( Production , Purification , and Application )
Hybridoma Technology  ( Production , Purification , and Application  ) Hybridoma Technology  ( Production , Purification , and Application  )
Hybridoma Technology ( Production , Purification , and Application ) Sakshi Ghasle
 
Class 11 Legal Studies Ch-1 Concept of State .pdf
Class 11 Legal Studies Ch-1 Concept of State .pdfClass 11 Legal Studies Ch-1 Concept of State .pdf
Class 11 Legal Studies Ch-1 Concept of State .pdfakmcokerachita
 
CARE OF CHILD IN INCUBATOR..........pptx
CARE OF CHILD IN INCUBATOR..........pptxCARE OF CHILD IN INCUBATOR..........pptx
CARE OF CHILD IN INCUBATOR..........pptxGaneshChakor2
 
SOCIAL AND HISTORICAL CONTEXT - LFTVD.pptx
SOCIAL AND HISTORICAL CONTEXT - LFTVD.pptxSOCIAL AND HISTORICAL CONTEXT - LFTVD.pptx
SOCIAL AND HISTORICAL CONTEXT - LFTVD.pptxiammrhaywood
 
The basics of sentences session 2pptx copy.pptx
The basics of sentences session 2pptx copy.pptxThe basics of sentences session 2pptx copy.pptx
The basics of sentences session 2pptx copy.pptxheathfieldcps1
 
Interactive Powerpoint_How to Master effective communication
Interactive Powerpoint_How to Master effective communicationInteractive Powerpoint_How to Master effective communication
Interactive Powerpoint_How to Master effective communicationnomboosow
 
URLs and Routing in the Odoo 17 Website App
URLs and Routing in the Odoo 17 Website AppURLs and Routing in the Odoo 17 Website App
URLs and Routing in the Odoo 17 Website AppCeline George
 
Contemporary philippine arts from the regions_PPT_Module_12 [Autosaved] (1).pptx
Contemporary philippine arts from the regions_PPT_Module_12 [Autosaved] (1).pptxContemporary philippine arts from the regions_PPT_Module_12 [Autosaved] (1).pptx
Contemporary philippine arts from the regions_PPT_Module_12 [Autosaved] (1).pptxRoyAbrique
 
Introduction to AI in Higher Education_draft.pptx
Introduction to AI in Higher Education_draft.pptxIntroduction to AI in Higher Education_draft.pptx
Introduction to AI in Higher Education_draft.pptxpboyjonauth
 
Mastering the Unannounced Regulatory Inspection
Mastering the Unannounced Regulatory InspectionMastering the Unannounced Regulatory Inspection
Mastering the Unannounced Regulatory InspectionSafetyChain Software
 
Solving Puzzles Benefits Everyone (English).pptx
Solving Puzzles Benefits Everyone (English).pptxSolving Puzzles Benefits Everyone (English).pptx
Solving Puzzles Benefits Everyone (English).pptxOH TEIK BIN
 
Enzyme, Pharmaceutical Aids, Miscellaneous Last Part of Chapter no 5th.pdf
Enzyme, Pharmaceutical Aids, Miscellaneous Last Part of Chapter no 5th.pdfEnzyme, Pharmaceutical Aids, Miscellaneous Last Part of Chapter no 5th.pdf
Enzyme, Pharmaceutical Aids, Miscellaneous Last Part of Chapter no 5th.pdfSumit Tiwari
 
_Math 4-Q4 Week 5.pptx Steps in Collecting Data
_Math 4-Q4 Week 5.pptx Steps in Collecting Data_Math 4-Q4 Week 5.pptx Steps in Collecting Data
_Math 4-Q4 Week 5.pptx Steps in Collecting DataJhengPantaleon
 
Organic Name Reactions for the students and aspirants of Chemistry12th.pptx
Organic Name Reactions  for the students and aspirants of Chemistry12th.pptxOrganic Name Reactions  for the students and aspirants of Chemistry12th.pptx
Organic Name Reactions for the students and aspirants of Chemistry12th.pptxVS Mahajan Coaching Centre
 
Introduction to ArtificiaI Intelligence in Higher Education
Introduction to ArtificiaI Intelligence in Higher EducationIntroduction to ArtificiaI Intelligence in Higher Education
Introduction to ArtificiaI Intelligence in Higher Educationpboyjonauth
 
How to Make a Pirate ship Primary Education.pptx
How to Make a Pirate ship Primary Education.pptxHow to Make a Pirate ship Primary Education.pptx
How to Make a Pirate ship Primary Education.pptxmanuelaromero2013
 
KSHARA STURA .pptx---KSHARA KARMA THERAPY (CAUSTIC THERAPY)————IMP.OF KSHARA ...
KSHARA STURA .pptx---KSHARA KARMA THERAPY (CAUSTIC THERAPY)————IMP.OF KSHARA ...KSHARA STURA .pptx---KSHARA KARMA THERAPY (CAUSTIC THERAPY)————IMP.OF KSHARA ...
KSHARA STURA .pptx---KSHARA KARMA THERAPY (CAUSTIC THERAPY)————IMP.OF KSHARA ...M56BOOKSTORE PRODUCT/SERVICE
 

Recently uploaded (20)

Paris 2024 Olympic Geographies - an activity
Paris 2024 Olympic Geographies - an activityParis 2024 Olympic Geographies - an activity
Paris 2024 Olympic Geographies - an activity
 
BASLIQ CURRENT LOOKBOOK LOOKBOOK(1) (1).pdf
BASLIQ CURRENT LOOKBOOK  LOOKBOOK(1) (1).pdfBASLIQ CURRENT LOOKBOOK  LOOKBOOK(1) (1).pdf
BASLIQ CURRENT LOOKBOOK LOOKBOOK(1) (1).pdf
 
Hybridoma Technology ( Production , Purification , and Application )
Hybridoma Technology  ( Production , Purification , and Application  ) Hybridoma Technology  ( Production , Purification , and Application  )
Hybridoma Technology ( Production , Purification , and Application )
 
Class 11 Legal Studies Ch-1 Concept of State .pdf
Class 11 Legal Studies Ch-1 Concept of State .pdfClass 11 Legal Studies Ch-1 Concept of State .pdf
Class 11 Legal Studies Ch-1 Concept of State .pdf
 
CARE OF CHILD IN INCUBATOR..........pptx
CARE OF CHILD IN INCUBATOR..........pptxCARE OF CHILD IN INCUBATOR..........pptx
CARE OF CHILD IN INCUBATOR..........pptx
 
SOCIAL AND HISTORICAL CONTEXT - LFTVD.pptx
SOCIAL AND HISTORICAL CONTEXT - LFTVD.pptxSOCIAL AND HISTORICAL CONTEXT - LFTVD.pptx
SOCIAL AND HISTORICAL CONTEXT - LFTVD.pptx
 
The basics of sentences session 2pptx copy.pptx
The basics of sentences session 2pptx copy.pptxThe basics of sentences session 2pptx copy.pptx
The basics of sentences session 2pptx copy.pptx
 
Interactive Powerpoint_How to Master effective communication
Interactive Powerpoint_How to Master effective communicationInteractive Powerpoint_How to Master effective communication
Interactive Powerpoint_How to Master effective communication
 
URLs and Routing in the Odoo 17 Website App
URLs and Routing in the Odoo 17 Website AppURLs and Routing in the Odoo 17 Website App
URLs and Routing in the Odoo 17 Website App
 
Contemporary philippine arts from the regions_PPT_Module_12 [Autosaved] (1).pptx
Contemporary philippine arts from the regions_PPT_Module_12 [Autosaved] (1).pptxContemporary philippine arts from the regions_PPT_Module_12 [Autosaved] (1).pptx
Contemporary philippine arts from the regions_PPT_Module_12 [Autosaved] (1).pptx
 
Introduction to AI in Higher Education_draft.pptx
Introduction to AI in Higher Education_draft.pptxIntroduction to AI in Higher Education_draft.pptx
Introduction to AI in Higher Education_draft.pptx
 
Mastering the Unannounced Regulatory Inspection
Mastering the Unannounced Regulatory InspectionMastering the Unannounced Regulatory Inspection
Mastering the Unannounced Regulatory Inspection
 
Solving Puzzles Benefits Everyone (English).pptx
Solving Puzzles Benefits Everyone (English).pptxSolving Puzzles Benefits Everyone (English).pptx
Solving Puzzles Benefits Everyone (English).pptx
 
Enzyme, Pharmaceutical Aids, Miscellaneous Last Part of Chapter no 5th.pdf
Enzyme, Pharmaceutical Aids, Miscellaneous Last Part of Chapter no 5th.pdfEnzyme, Pharmaceutical Aids, Miscellaneous Last Part of Chapter no 5th.pdf
Enzyme, Pharmaceutical Aids, Miscellaneous Last Part of Chapter no 5th.pdf
 
_Math 4-Q4 Week 5.pptx Steps in Collecting Data
_Math 4-Q4 Week 5.pptx Steps in Collecting Data_Math 4-Q4 Week 5.pptx Steps in Collecting Data
_Math 4-Q4 Week 5.pptx Steps in Collecting Data
 
Código Creativo y Arte de Software | Unidad 1
Código Creativo y Arte de Software | Unidad 1Código Creativo y Arte de Software | Unidad 1
Código Creativo y Arte de Software | Unidad 1
 
Organic Name Reactions for the students and aspirants of Chemistry12th.pptx
Organic Name Reactions  for the students and aspirants of Chemistry12th.pptxOrganic Name Reactions  for the students and aspirants of Chemistry12th.pptx
Organic Name Reactions for the students and aspirants of Chemistry12th.pptx
 
Introduction to ArtificiaI Intelligence in Higher Education
Introduction to ArtificiaI Intelligence in Higher EducationIntroduction to ArtificiaI Intelligence in Higher Education
Introduction to ArtificiaI Intelligence in Higher Education
 
How to Make a Pirate ship Primary Education.pptx
How to Make a Pirate ship Primary Education.pptxHow to Make a Pirate ship Primary Education.pptx
How to Make a Pirate ship Primary Education.pptx
 
KSHARA STURA .pptx---KSHARA KARMA THERAPY (CAUSTIC THERAPY)————IMP.OF KSHARA ...
KSHARA STURA .pptx---KSHARA KARMA THERAPY (CAUSTIC THERAPY)————IMP.OF KSHARA ...KSHARA STURA .pptx---KSHARA KARMA THERAPY (CAUSTIC THERAPY)————IMP.OF KSHARA ...
KSHARA STURA .pptx---KSHARA KARMA THERAPY (CAUSTIC THERAPY)————IMP.OF KSHARA ...
 

Impact factors-the basics-cross_uksg

  • 1. The E-Resources Management Handbook Jo Cross Impact factors – the basics Impact factors – the basics JO CROSS Market Research Manager Taylor & Francis The E-Resources Management Handbook – UKSG This chapter is designed to be an introduction to impact factors and how they are calculated. It goes on to look at some of the major issues that need to be consid- ered when evaluating journal impact factors.The chapter considers implications of the cause and effect of subject differences in impact factors and different article types such as news items, editorials and review articles.The paper also considers the skewed distribution of citations to articles within a journal and the relationship between journal size and impact factor changes between years. What are impact factors? At the simplest level, journal impact factors give the average number of citations to articles in a particular journal; essentially, the average number of times that articles in a journal are referenced by other articles. Impact factors were conceptualized by Eugene Garfield and Irving H Sher in the 1960s as an aid to evaluating journals for inclusion in Current Contents® and the Science Citation Index® 1, 2. An average citation measure was needed to account for the effects of the size and age of a journal on the total number of citations it receives. Older and larger journals will generally receive more citations because they have larger bodies of previously published articles available to be cited. Calculating an impact factor requires a denominator (the total number of articles published) and a numerator (the total number of citations to those articles). A time period, or ‘window,’ needs to be defined for both of these variables. The publication window is the period during which the articles included in the calculation were published. The citation window is the period during which citations to these articles were counted. Today, the term ‘impact factor’ most commonly refers to figures calculated and published by Thomson Reuters each year in the Science and Social Sciences Editions of the Journal Citation Reports (JCR). Thomson had acquired ISI and all its products in 1992 and merged with Reuters in 2008 to form Thomson Reuters. These figures give a two-year impact factor and use very specific publication and citation windows. The citation window here is the impact factor year, and the publication window refers to the two previous years. Therefore, the 2007 JCR impact factors (released in 2008) were calculated as follows: number of citations in 2007 to articles published in 2005 and 2006 in Journal X number of articles published in 2005 and 2006 in Journal X For example, the 2007 impact factor for Advances in Physics was calculated as follows: Citations in 2007 to articles published in Advances in Physics in 2005 = 115 Citations in 2007 to articles published in Advances in Physics in 2006 = 86 Total citations received in 2007 to articles published in 2005 and 2006 = 201 Number of articles published in Advances in Physics in 2005 = 12 Number of articles published in Advances in Physics in 2006 = 9 Total number of articles published in 2005 and 2006 = 21 1
  • 2. Impact factors – the basics Jo Cross The E-Resources Management Handbook citations in 2007 to articles published in 2005 and 2006 2007 impact factor = number of articles published in 2005 and 2006 201 2007 impact factor for Advances in Physics = = 9.571 21 For the rest of this article ‘impact factor’ will refer to the two-year JCR impact factor unless stated otherwise. The use of the JCR model has the following implications: ■ each article published is included in the denominator for two impact factor years (the two years after the year of publication). Thus, an article published in 2005 will be included in both the 2006 and 2007 impact factors ■ citations received in the year of publication or in the third year after publication or later will not count towards any impact factor calculation. Impact factors have been adopted for use as measures of journal quality based on the premise that: “the value of information is determined by those who use it” 3, the idea being that the value of a journal can be measured by the number of times its use is formalized in the form of a citation. Thomson Reuters has suggested that impact factors can be useful tools for the management of library journal collections. There are, however, several issues associated with the use of impact factors as measures of quality and it is important to understand these before utilizing impact factor data in any decision-making process. The rest of this chapter will look in some depth at many of these issues. Subject variation in impact factors The average number of citations to articles during the two years after publication varies considerably across different subject fields. This leads to impact factors of very different magnitudes between fields, as illustrated in Figure 1. The impact factors plotted here are calculated by counting the number of citations in the current year to articles published by all journals in the category in the two previous years then dividing this by the total number of these articles. Thus, these figures represent the average number of times an article in the field has been cited: the impact factor of the entire category. JCR category Category aggregate impact factor Figure 1. Impact factors for 15 categories from the 2007 JCRs 2
  • 3. The E-Resources Management Handbook Jo Cross Impact factors – the basics The 15 categories shown in Figure 1 are from a very wide range of fields from both the Science and Social Sciences Editions of the JCR. However, even within a more closely-related group of subject categories, there can be high variation in impact factors. This is illustrated in Figure 2, which shows the category impact factors for nine sub-fields within physics. JCR category Category aggregate impact factor Figure 2. Impact factors for nine physics categories from the 2007 JCR Science Edition What causes subject variation in impact factors? Subject variations in impact factor are due to both different levels and patterns of citation activity between journals in different fields. Figure 3 shows the general magnitude of citation levels after publication for six subject categories. As shown here, there are major differences in the number of citations to articles in each Figure 3. Subject variation in citation levels after publication 3
  • 4. Impact factors – the basics Jo Cross The E-Resources Management Handbook of the different subject areas, with those in cell biology, for example, receiving many more citations at all points after publication than those in economics or maths. One possible reason for higher citation levels in some fields is variation in the average number of authors per article. There is some evidence that highly-cited articles tend to have more authors4 and that subject fields with more authors per paper tend to have higher impact factors5. This is probably due to the tendency of authors to cite their own work and that of their research team. Varying publication behaviours in different subject fields also contribute to differing levels of citations; for example, in many of the social sciences greater use is made of books as a method of dissemination than in the hard sciences. This means that a relatively high proportion of references from journal articles in these fields go to books6, reducing the total number of inter-journal citations. Equally, many of the citations in these fields may come from references within books and these are mostly not captured by Thomson Reuters7,8. In engineering a similar effect occurs with many citations going to material published in conference proceedings rather than in traditional journals9. Applied fields also differ from basic research fields in terms of the total number of citations. Journals in applied fields are more likely to reference journals in related basic research fields than other applied journals. There is no comparable flow of citations back from the basic research journals. Thus, basic research fields tend to receive more citations than related applied fields and, therefore, have higher impact factors. For example, journals in basic medicine fields generally have higher impact factors than those in clinical medicine fields10. We can also see from Figure 2 that the applied physics category has a relatively low impact factor compared to most of the other physics categories. A difference in the level of coverage by Thomson Reuters across subject fields is another major contributor to varying magnitudes of citation activity as measured by the JCR11. Citation data in the JCR comes only from publications that are indexed by Thomson Reuters. Figure 4, which is based on data from Ulrich’s Periodicals Directory, illustrates the different levels of coverage of journals by Thomson Reuters across broad fields. Science subjects are in blue and social science and humanities subjects in yellow. * Does not include titles only listed in the Arts & Humanities Citation Index Figure 4. Percentage of active, refereed, academic/scholarly titles covered in the JCR by subject, according to Ulrichs (June 2008) The source list for citations in the JCR is slightly broader than the journals covered within, additionally incorporating any citations from titles covered in the Arts & Humanities Citation Index, ISI Proceedings and the Biosis database. However, these additional sources do not compensate for the different levels of coverage across fields. 4
  • 5. The E-Resources Management Handbook Jo Cross Impact factors – the basics In subject fields with lower coverage, a higher proportion of citations from the field will not be captured in the JCR data set and this will lead to lower recorded citation levels. Figure 4 illustrates generally low coverage in social science fields and this is likely to be a contributing factor towards lower recorded citation levels and therefore lower impact factors in the social sciences JCR. In addition to different levels of recorded citation activity between fields, different citation patterns also affect the magnitude of impact factors. Figure 5 shows the percentage of lifetime citations received by year since publication for the same six subject categories. As mentioned earlier, only citations received in the two calendar years after publication count towards an impact factor. These citations are those that fall within the impact factor window as shown in blue in Figure 5. Figure 5. Subject variation in citation distributions Figure 5 clearly illustrates that the proportion of citations falling within the impact factor window varies considerably between subject areas. Approximately 22% of lifetime citations to cell biology articles fall within this window compared to only around 8% of citations to articles in economics or maths. This compounds the difference in impact factors between these fields since cell biology articles not only receive more citations in total, but a higher proportion of these contribute towards impact factors. Why a two-year impact factor? As mentioned earlier, impact factors were originally devised to help with journal selection for inclusion in Current Contents products. At the time of the inception of impact factors, the primary fields of focus for Current Contents were fields related to molecular biology and biochemistry12. In these fields, 25% of citations received in a particular year were accounted for by articles published in that year and the two previous years13. Thus, using a measure that only included citations to recent articles was considered appropriate in this context. A similar pattern of citations can still be seen in these and other fast-moving fields, as illustrated by the pattern of citations (the ‘citation curve’) for cell biology in Figure 5. However, since the citation curve is clearly not the same for all fields, many commentators have argued for the publication of more long-term impact measures that would take into consideration a greater proportion of lifetime citations for slower- moving fields14, 15. Thomson Reuters justifies its continued publication of two-year impact factors on the basis of two main characteristics of this particular metric: it is both current and responsive16. Using citations in the current 5
  • 6. Impact factors – the basics Jo Cross The E-Resources Management Handbook year (where ‘current year’ refers to the impact factor year rather than the year of JCR publication, which is the year after) and articles in the two previous years ensures that JCR impact factors are highly sensitive to recent changes in citation activity. For example, a journal’s JCR impact factor will respond to papers or topical issues that receive an abnormally high number of citations, but will not be skewed for more than two years. Using a longer publication window would dilute these effects but would include them for a longer period. Thomson Reuters considers this sensitivity to be one of the strengths of the JCR impact factor. However, it could also be considered a weakness since it means that several years of impact factors need to be considered to gauge the general impact of a title. Another advantage of the JCR impact factor is that it only requires three years’ worth of data (two publication years and one citation year) to calculate. Alternative metrics that have been suggested, such as five- or seven-year impact factors, would take over twice as long to produce. Considering the importance that has been, rightly or wrongly, assigned to impact factors, this extended delay could be highly detrimental to new journals trying to establish themselves. Currently, the two-year measure continues to be the only official impact factor published in the annual JCR. Thomson Reuters, however, does acknowledge that a longer-term impact measure may be more appropriate in some fields and recent communications with Thomson Reuters’ staff suggest that a five- year measure may be included in a forthcoming update to the 2007 JCR. In the meantime, a couple of ways in which a five-year measure can be calculated from data available in the JCR have been suggested17,18. Extended impact measures for journals can also be calculated from data available in another Thomson Reuters product, the Journal Performance Indicators19. This product allows comparison to field-specific baselines. Consequences of subject variations in impact factors The high variation in average impact across different subject areas means that impact factors cannot be used to compare journals from different subject areas. This is why the journals covered by the JCR are classified into fairly narrow subject categories. It is only at this level that journals should be ranked according to their impact factors. Even within the JCR subject categories some journals will have a subject advantage over others, for example, where a subject category contains both basic research and applied journals – practice-based and educational journals often have particularly low impact factors compared to the basic research journals listed in the same categories. There can also be a subject advantage in categories which are multidisciplinary by nature, for example, social science journals such as the Journal of Sports Management and Journal of the Philosophy of Sport in the sports sciences categories tend to rank lower than the majority of the sports medicine titles in the same category. All these factors need to be considered when comparing journal rankings within a subject category. Subject variation in impact factors is also one of the reasons it is unwise to create an ‘average impact factor’ for a publisher’s entire list of journals. Now that many publishers offer ‘bulk sales deals’ it can be tempting to try and gauge the quality of such an offering by creating an average impact factor for the journals included in the deal. However, if subject differences mean that the impact factors of journals from different fields cannot be compared, then it follows that the data should not be combined either. This sort of publisher-wide averaging of impact factors will always favour publishers with strong life sciences programmes over those with stronger social science programmes. Since impact factors can vary even between quite closely related fields, as shown in Figure 2, averaging impact factors across even a single subject package is unlikely to give a fair view of the quality of the package. The same is true of trying to compare publishers on the basis of price per impact factor where journals from multiple JCR categories are included in the analysis, for example, the LISU report on ‘Trends in Scholarly Journal Publishing’, which combines such diverse categories as educational psychology and cell biology (which have 2007 category aggregate impact factors of 1.154 and 5.603, respectively) into one analysis on biomedical titles20. 6
  • 7. The E-Resources Management Handbook Jo Cross Impact factors – the basics Is every published item counted? Many journals publish non-substantive items such as news articles, editorials, letters to the editor and meeting abstracts, often referred to as ‘non-source items’. These items are usually never cited and, so that journals publishing this material are not unduly penalized, they are not counted in the article total (denominator) for JCR impact factor calculations. Although these ‘non-source items’ are rarely cited, there are exceptions and, interestingly, these citations do count towards the citation total (the numerator of the calculation). This discrepancy between what is counted in the two halves of the calculation arises due to the method used by the JCR division at Thomson Reuters to count citations to a journal. The system searches the reference lists of articles published in the impact factor year for journal titles and publication years only. Citations are not matched to individual published items and for that reason the system does not differentiate between citations to source items and those to non-source items. So, for example, in the reference below, the JCR would record a citation to the 2005 volume of Contemporary Physics but would not capture any more detailed information about the actual article that had been cited. BIER, M. (2005) Modelling processive motor proteins: moving on two legs in the microscopic realm. CONTEMPORARY PHYSICS 46: 4. Other departments at Thomson Reuters do match citation data at the individual article level and this information is used to compile products such as ISI Journal Performance Indicators (JPI) and Essential Science Indicators SM. The data used in the JCR, however, continues to be collected at the journal level. The consequence of this discrepancy is that journals publishing a large number of ‘non-source items’ (this is more common in some fields, such as medicine) or journals publishing particularly interesting ‘non-source items’ can have artificially inflated JCR impact factors. For these journals, citations are being counted in the numerator to articles that are not counted in the denominator. These citations can be considered to be ‘free’ citations. The number of non-source items published by particular journals can be found under the heading ‘Journal Source Data’ in the JCR. The number of ‘other items’ here refers to the number of non-source items. This does not, however, give an indication of the number of citations these articles have received. Review articles Review articles, i.e. articles that attempt to sum up the current state of research on a particular topic, are generally cited more often than primary research articles. This is because authors will often cite one review article rather than the many primary research articles it is based on. Therefore review journals, or journals that publish a significant amount of review content alongside their primary content, usually have higher impact factors than other journals in their field. For example, analysing data from the 2007 JCR shows that the aggregate 2007 impact factor for science journals publishing over 75% review articles is over 2.5 times higher than the figure for the remaining journals. Although the JCR lists journals from different subject areas separately to take account of subject variation in its impact factors, it does not list review journals separately from primary journals. Therefore review journals and journals containing a high proportion of review content are often ranked amongst the highest journals in their fields. For instance, the top three journals in the 2007 toxicology category are review journals and the fourth ranked journal publishes over 25% review articles. The JCR also includes figures on the number of review articles published by each journal that it covers in the ‘Journal Source Data’ section. It is important to consider the proportion of review content when comparing the impact factors of different journals. The variance in citation rates to different types of journals and journals with a different mix of articles is another reason why it is unwise to calculate average impact factors across publisher lists. Publishers with a large list of review journals will generally fare better in such comparisons. 7
  • 8. Impact factors – the basics Jo Cross The E-Resources Management Handbook Skewed distribution of citations Impact factors are designed to be “a measure of the frequency with which the ‘average article’ in a journal has been cited in a particular year” 21. However, the distribution of citations to articles within a journal is generally highly skewed with a minority of articles receiving the majority of citations especially within the narrow impact factor windows22,23,24. Figure 6. Distribution of citations in 2007 to articles published in 2005 and 2006 for a journal with an impact factor of 4.651 This type of skew is clearly illustrated in Figure 6, which shows the distribution of citations in 2007 to articles published in 2005 and 2006 for a journal with an impact factor (mean number of citations) of 4.651. In this case over 80% of articles have less than the mean number of citations, while over 40% have zero citations within this window. Here the mean is particularly skewed by one article which received 73 citations. What this means is that the impact factor often does not actually give a good indication of the frequency with which the ‘average article’ has been cited. There have been calls for Thomson Reuters to produce a median-based average for journals along with the mean25 but this would not be possible without a change in the way the data is collected for the JCR. Data is currently collected at the journal level (see Is Every Published Item Counted?) above and therefore measures which rely on distribution data such as medians cannot be calculated from the current data set. Journal size and impact factor variability Impact factors can be highly variable from year to year, however, it is important not to read too much into subtle changes in these figures, especially in smaller journals. Impact factors can be thought of as the mean number of citations to a biased sample of articles from the population of all articles in that field26. Statistically, smaller samples will have greater sampling errors than larger ones; that is, the mean values delivered by repeated sampling will be more variable. If we envisage impact factors as repeated samples from the same population of articles, then we would expect the impact factors of smaller journals to be more variable, year on year, than those of larger journals. Figure 7 shows the median change in JCR impact factor (either up or down) between 2006 and 2007, for all journals in both JCR editions, grouped by journal size. This clearly illustrates that smaller journals have more variable impact factors, on average, than larger ones. 8
  • 9. The E-Resources Management Handbook Jo Cross Impact factors – the basics Figure 7. Median change in impact factor between 2006 and 2007 by journal size Another way to look at this is to consider that a very small change in the total number of citations to a journal that publishes relatively few articles a year will lead to quite a high percentage change in the impact factor between years. This is especially true when we look at journals that have relatively low impact factors to start with. For example, it only takes two extra citations to a journal with an impact factor of 0.500 which publishes 20 articles a year (and so would have an impact factor denominator of 40) to increase its score to 0.550, a 10% increase. Compare this to a much larger journal publishing 100 articles a year with an impact factor of 4.000. This title would need to gain an extra 80 citations to see a 10% increase to 4.400. It is important to bear this caveat in mind when evaluating any changes in JCR impact factor between two years. If a journal is very small, then a relatively large change in impact factor (or a consistent increase or decrease over several years) is required to demonstrate that there has been an underlying change in the population from which the journal draws its articles. In addition to averaging impact factors across a list, it can be tempting to calculate the mean percentage increase of a group of titles in an attempt to gauge the improvement of the list as a whole. However, the high variability in impact factor is one reason to avoid this approach. In the theoretical examples given above, both journals see an increase of 10% for very different changes in the actual number of citations received between the two years. Both these changes would be given exactly the same weight in a simple average of the percentage changes in impact factors across a list. There is also a definite increase bias in such a calculation. Table 1 illustrates how increases are given a much higher weight in mean percentage change calculations. Suppose that two theoretical journals both publish 20 articles per year, giving both titles an impact factor denominator of 40 (2 x 20), and that one title gains six citations and the other loses six. The average absolute change in impact factor is zero but the mean percentage change is +45% because the increase in citations leads to a 150% increase in impact factor compared to only a 65% decrease for the loss of citations. This is an extreme and hypothetical example, but the principle holds across all increases and decreases. It is worth bearing in mind that the highest possible percentage decrease for a journal is –100%, but there Citations IF year 1 Citations IF year 2 Absolute Change % Change year 1 year 2 in IF in IF Journal A 4 0.100 10 0.250 +0.150 +150% Journal B 10 0.250 4 0.001 –0.150 –65% Average Change 0 +45% Table 1. Illustration of the increase bias in mean percentage change calculations 9
  • 10. Impact factors – the basics Jo Cross The E-Resources Management Handbook is no limit to how high a percentage increase can be. In fact there are four journals in the 2007 JCR which have seen an impact factor increase of over 1000% compared to the 2006 figures. What this all means is that simple mean percentage increases across a list can be highly skewed by small journals which have seen a high percentage change in impact factor due to only a small, and quite possibly random, change in the number of citations received. This skew is even greater when the change is an increase. Further information This chapter has covered some of the basic principles that should be considered when using the JCR impact factors. It is not intended to be a completely comprehensive look at the myriad issues that surround the many different ways in which this ubiquitous measure is used. Those interested in these issues may wish to follow some of the references. Data sources/acknowledgements Data and charts included with kind permission of Thomson Reuters and ProQuest LLC. Data sources for individual charts are also as follows: ■ Figures 1,2,3,5 and 7 – Journal Citation Reports®. Copyright © 2008 Thomson Reuters ■ Figure 4 – Ulrichsweb.com™. Copyright © 2008 ProQuest LLC. All rights reserved. ■ Figure 6 – Web of Science®. Copyright © 2008 Thomson Reuters. References 1. The Thomson Scientific impact factor, Thomson Reuters essay. This essay was originally published in the Current Contents print editions June 20, 1994, when Thomson Scientific was known as The Institute for Scientific Information® (ISI®): http:/ thomsonreuters.com/business_units/scientific/free/essays/impactfactor/ (Accessed 5 January 2009) / 2. Garfield, E, Long term Vs. short-term journal impact: does it matter? The Scientist, 1998, 2(3) 10–12. http:/ www.garfield.library.upenn.edu/commentaries/tsv12(03)p10y19980202.pdf (Accessed 5 January 2009) / 3. History of citation indexing, Thomson Reuters essay: http:/ thomsonreuters.com/business_units/scientific/free/essays/history/ (Accessed 5 January 2009) / 4. Aksnes, D W, Characteristics of highly cited papers, Research Evaluation, 2003, 12(3) 159–170. 5. Amin, M and Mabe M, Impact factors: use and abuse, Perspectives in Publishing, 2000, 1. http:/ www.elsevier.com/framework_editors/pdfs/Perspectives1.pdf (Accessed 5 January 2009) / 6. Garfield, E, On the literature of the social sciences and the usage and effectiveness of the Social Sciences Citation Index. Current Contents, 1976, 34 5–10. http:/ www.garfield.library.upenn.edu/essays/v2p550y1974-76.pdf (Accessed 5 January 2009) / 7. Line, M B, Social science information – the poor relation. INSPEL 1999 33(3) 131–136. http:/ www.ifla.org/VII/d2/inspel/99-3libm.pdf (Accessed 5 January 2009) / 8. Harzing, A-W, & van der Wal, R, Google Scholar as a new source for citation analysis?, Ethics in Science and Environmental Politics, 2008, 8 (1) 62–71. http:/ www.harzing.com/download/gsdemo.pdf (Accessed 5 January 2009) / 9. Harzing, A-W, & van der Wal, R, ref. 8 10. Seglen, P O, Why the impact factor of journals should not be used for evaluating research, BMJ, 1997, 314 497. 10
  • 11. The E-Resources Management Handbook Jo Cross Impact factors – the basics 11. Althouse, B M et al, Differences in impact factor across fields and over time, Department of Economics, UCSB. Departmental Working Papers (Paper 2008-4-23), 2008. http:/ repositories.cdlib.org/ucsbecon/dwp/2008-4-23 (Accessed 5 January 2009) / 12. Garfield, E, The use of journal impact factors and citation analysis for evaluation of science. Paper presented at the 41st Annual Meeting of the Council of Biology Editors, Salt Lake City, UT, May 4, 1998 – April 17, 1998. http:/ www.garfield.library.upenn.edu/papers/eval_of_science_CBE(Utah).html (Accessed 5 January 2009) / 13. Garfield, E, The meaning of the impact factor, International Journal of Clinical and Health Psychology, 2003, 3(2) 363–369. http:/ www.garfield.library.upenn.edu/papers/meaningofif2003.pdf (Accessed 5 January 2009) / 14. Garfield, E, ref. 2 15. Garfield, E, ref. 12 16. Althouse, B M, ref. 11 17. The Thomson Scientific impact factor, Thomson Reuters essay, ref. 1 18. How to calculate a five-year impact factor- JCR Online Help Section: http:/ admin-apps.isiknowledge.com/JCR/help/h_fiveyr_if.htm (Accessed 5 January 2009) / 19. Pringle, J, Trends in the use of ISI citation databases for evaluation, Learned Publishing, 2008, 21 85–91. http:/ dx.doi.org/10.1087/095315108X288901 (Accessed 5 January 2009) / 20. White, S and Creaser, C, Trends in Scholarly Journal Prices 2000-2006, (LISU Occasional Paper No. 37), 2007 http:/ www.lboro.ac.uk/departments/ls/lisu/pages/publications/oup2.html (Accessed 5 January 2009) / 21. The Thomson Scientific impact factor, Thomson Reuters essay, ref. 1 22. Seglen, P O, ref. 10 23. Editorial, Not-so-deep impact, Nature, 2005, 435, 1003–1004. http:/ www.nature.com/nature/journal/v435/n7045/full/4351003b.html (Accessed 5 January 2009) / 24. Alder, R, Ewing, J and Taylor, P, Citation statistics: A report from the International Mathematical Union (IMU) in cooperation with the International Council of Industrial and Applied Mathematics (ICIAM) and the Institute of Mathematical Statistics, 2008: http:/ www.mathunion.org/fileadmin/IMU/Report/CitationStatistics.pdf (Accessed 5 January 2009) / 25. Rossner, M, Van Epps, H and Hill, E, Show me the data, Journal of Cell Biology, 2007, 179(6), 1091–1092. http:/ cb.rupress.org/cgi/doi/10.1083/jcb.200711140 (Accessed 5 January 2009) / 26. Amin, M and Mabe, M, ref. 5 © Jo Cross ■ Jo Cross Market Research Manager Taylor & Francis 4 Park Square Milton Park Abingdon OX14 4RN E-mail: jo.cross@tandf.co.uk 11
  • 12. Impact factors – the basics Jo Cross The E-Resources Management Handbook Biographical note Jo graduated from Oxford University with a BA (Hons) in Experimental Psychology. She started her career in academic journal publishing at Elsevier where she worked in various roles including author support, journal management (Editorial) and as a Publishing Information Manager. Jo moved to Taylor & Francis in 2004 to set up and run the Market Research Department. Studying and analysing citation and impact factor data has been a large component of Jo’s role since she became a Publishing Information Manager in 2002. In 2007 she ran a briefing session on Impact Factors at the annual UKSG conference. To view more chapters from The E-Resources Management Handbook, published by UKSG, click here: http://www.uksg.org/serials/handbook.asp 12