Download to read offline


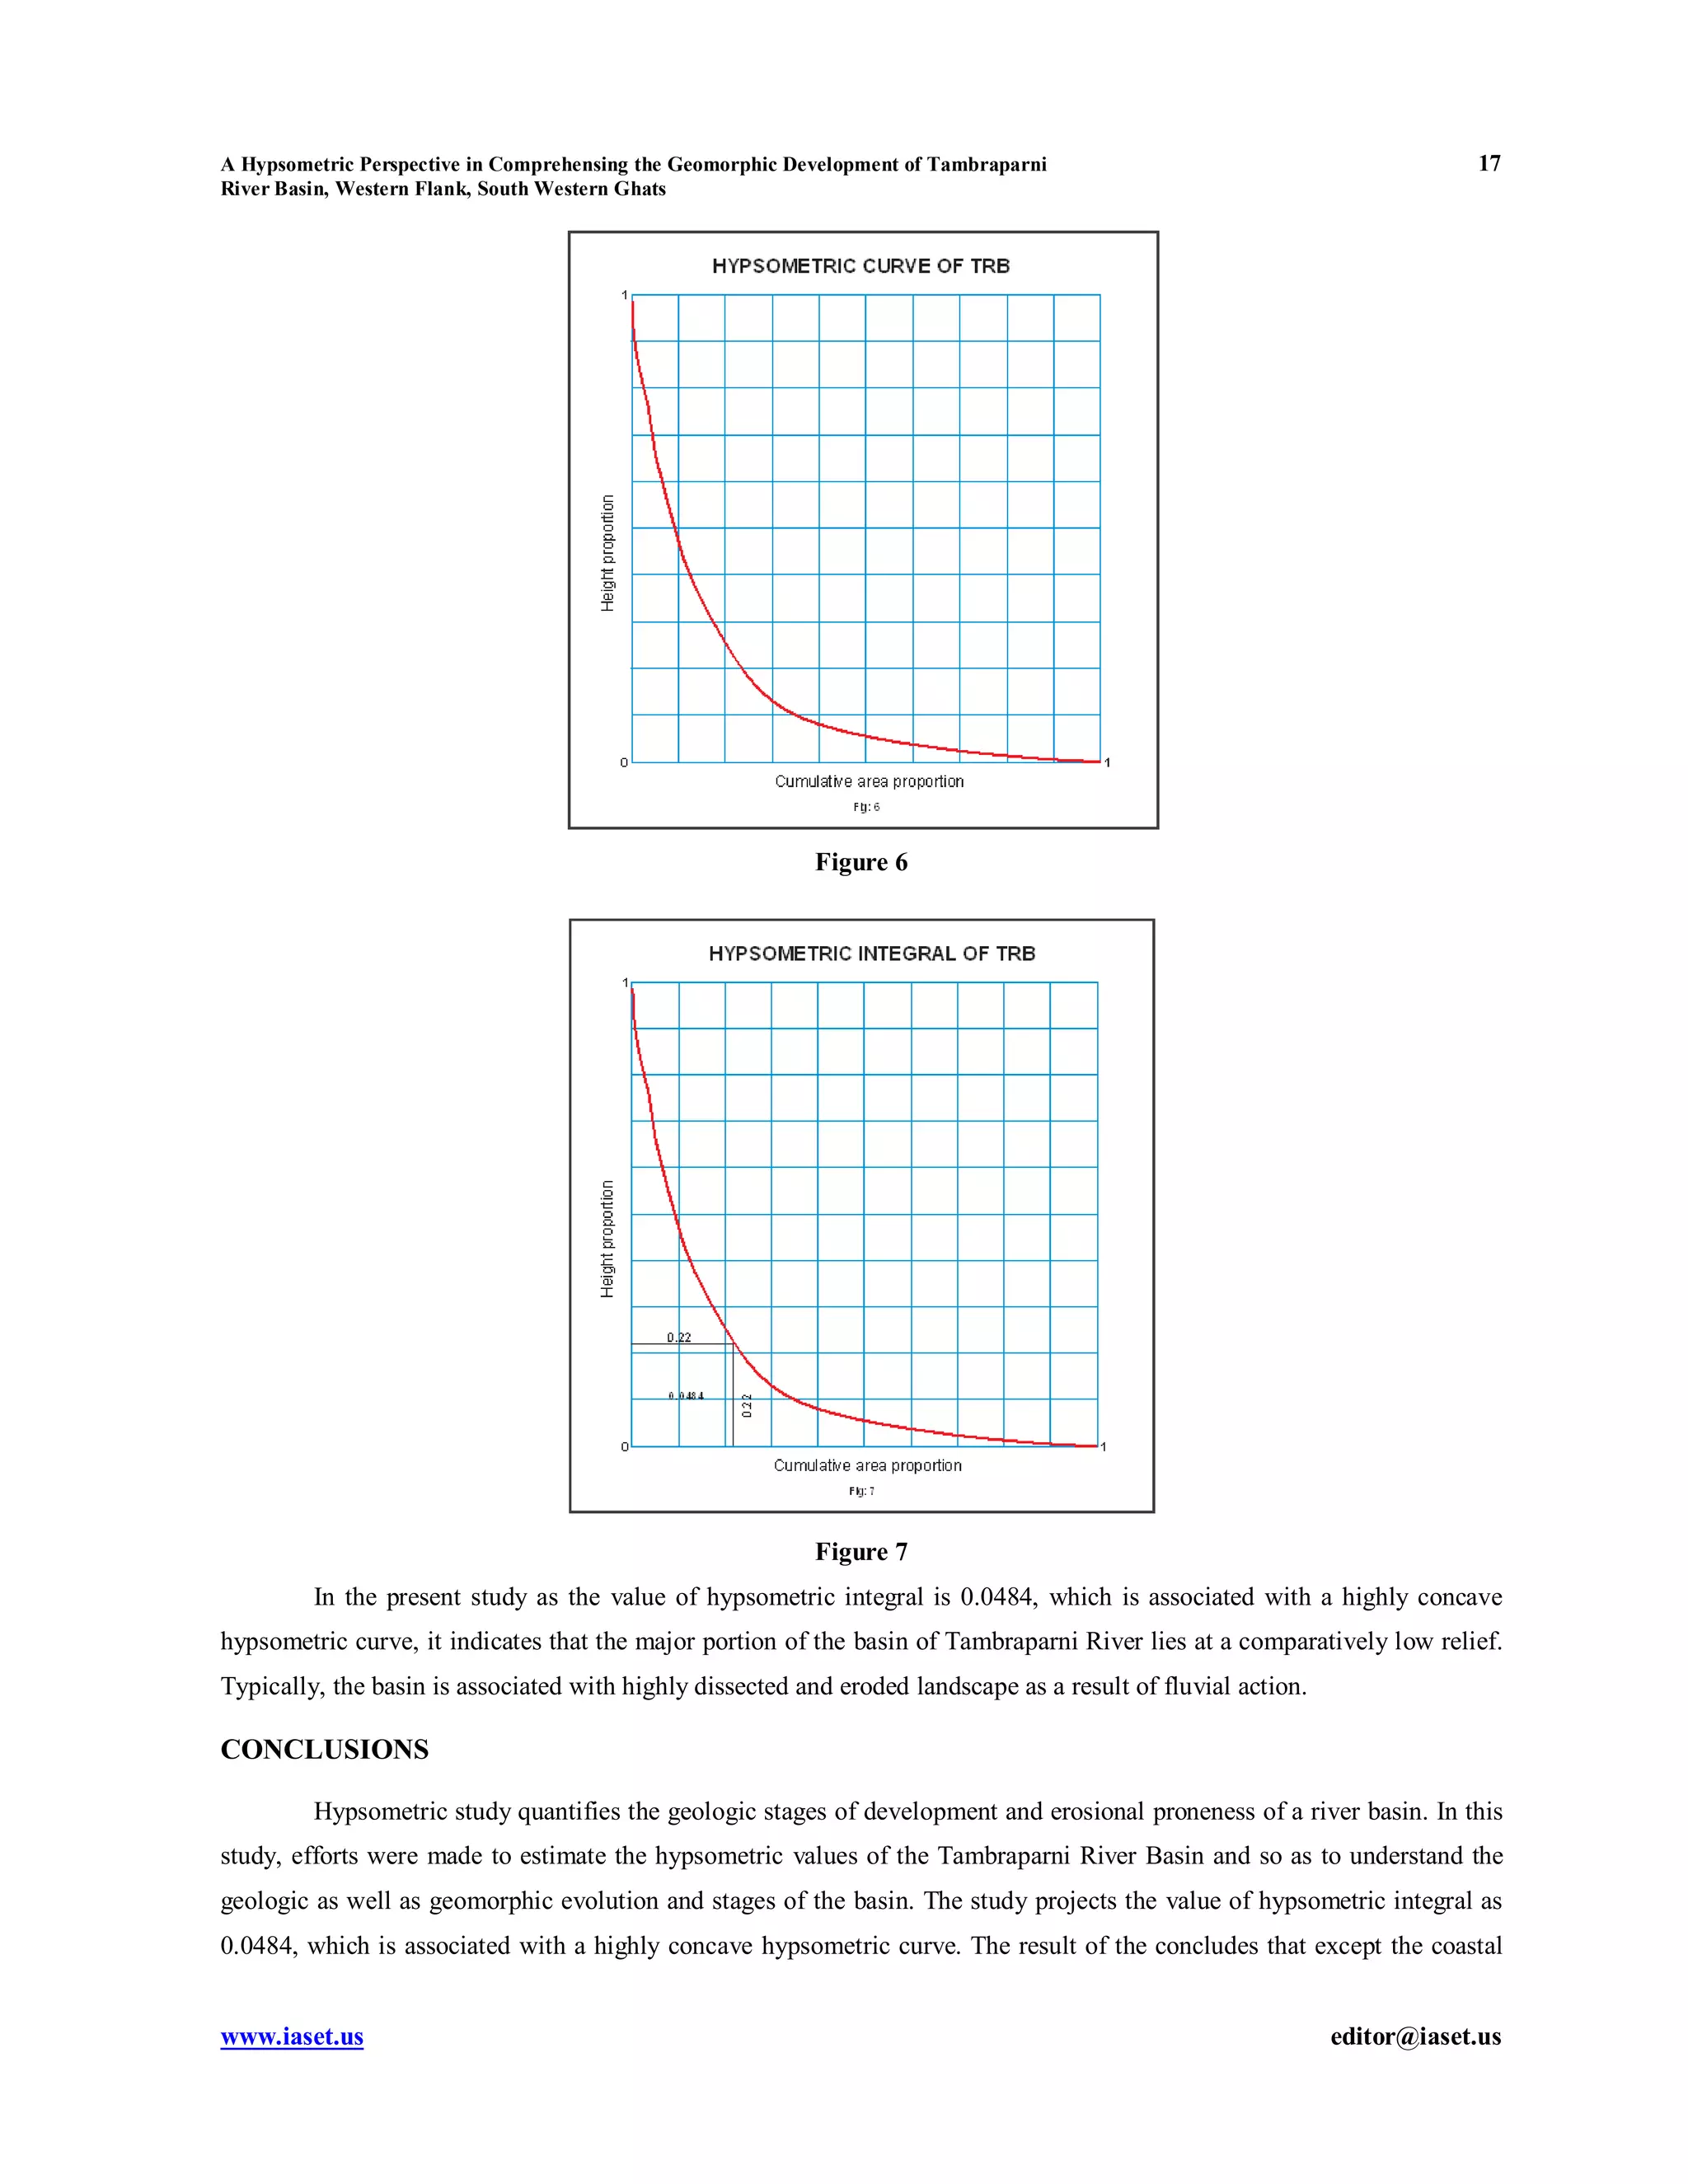


This document discusses a study of the hypsometric analysis of the Tambraparni River Basin located in southern India. The study aims to use hypsometric values and curves to understand the geologic and geomorphic evolution of the basin. The hypsometric integral value of 0.0484 indicates that most of the basin has a relatively low relief, associated with a highly dissected and eroded landscape due to fluvial action. GIS software was used to analyze elevation data and generate hypsometric curves to study the geomorphic development stages of the basin over time.