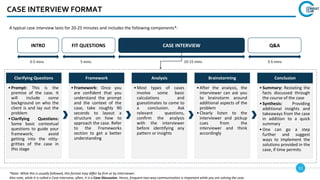
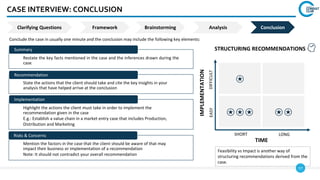
Here is a typical format for a case interview:
1. Intro (3-5 mins): The interviewer provides context on the client and outlines the problem statement.
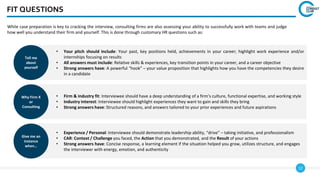
2. Fit Questions (5 mins): The interviewer asks some basic questions to understand your approach and guide your framework without diving into case details.
3. Case Interview (10-15 mins): You present your framework, analyze the case, generate insights and recommendations through a discussion with the interviewer.
4. Q&A (3-5 mins): The interviewer wraps up with any final questions and gets your overall thoughts on the case and experience.
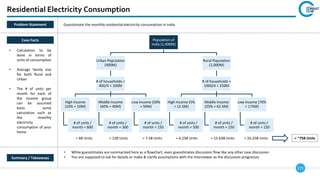
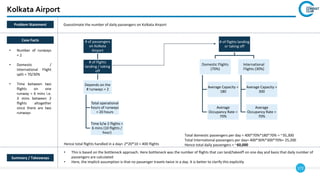
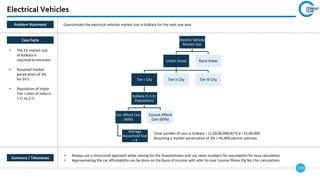
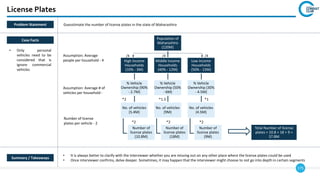
The key aspects are understanding the problem clearly, structuring your analysis systematically,


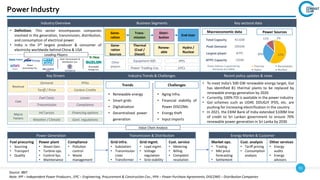


![174
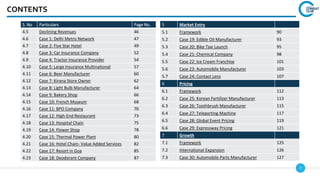
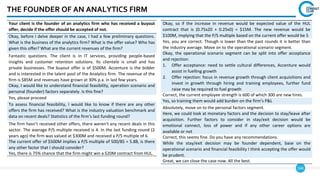
Fast Food Chain
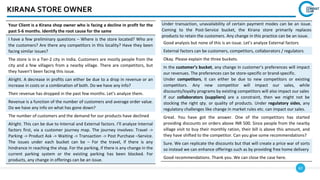
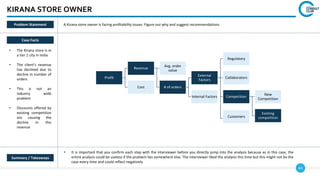
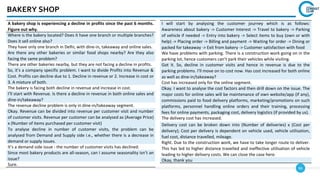
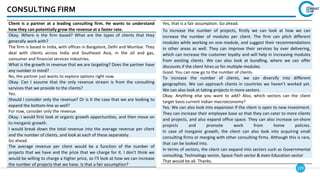
Summary / Takeaways
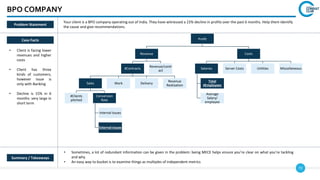
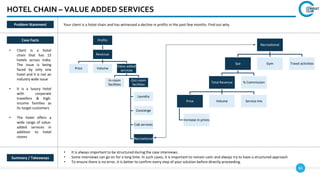
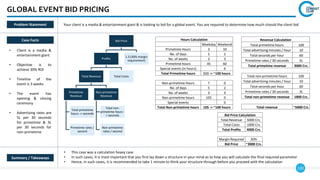
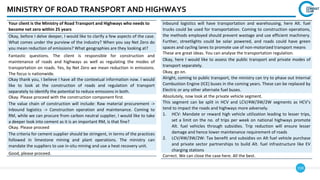
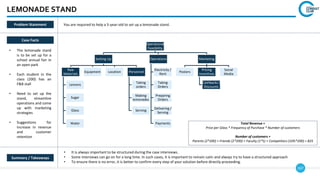
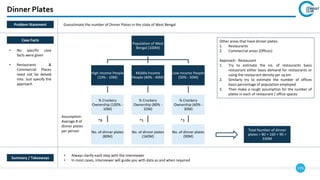
• A similar mathematical approach can be taken to estimate the total revenues via Takeaway and Delivery business
• For Delivery / Takeaway orders, you can include factors such as average order value, any special discounts / cashbacks offered, number of orders in a
hour basis demand
Case Facts
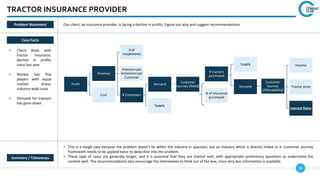
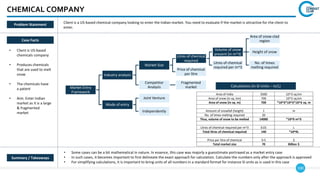
• Focus on Dine-In
orders only
Summary / Takeaways
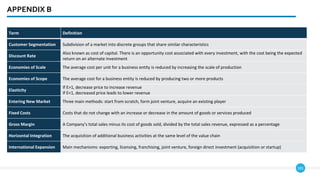
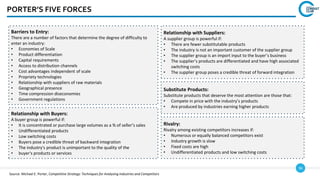
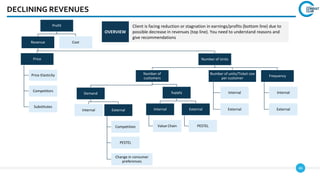
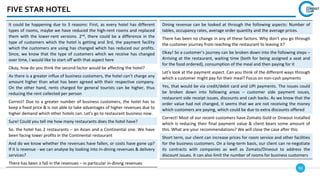
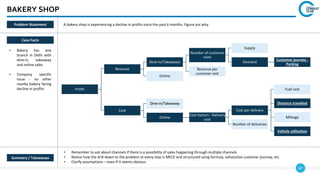
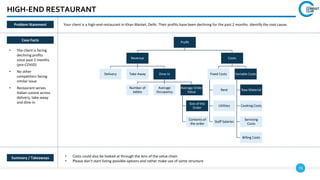
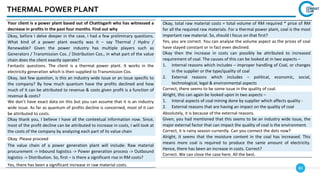
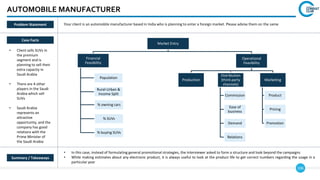
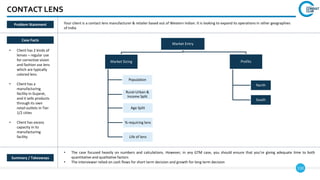
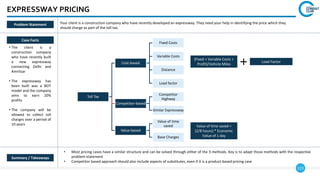
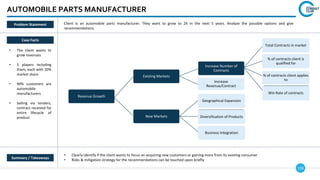
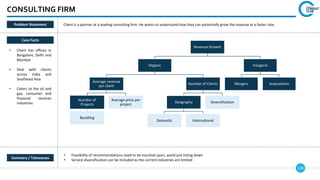
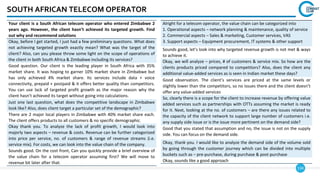
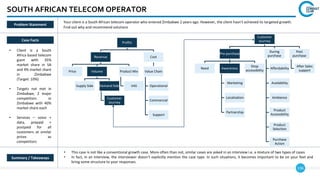
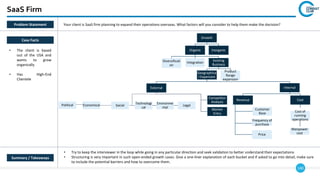
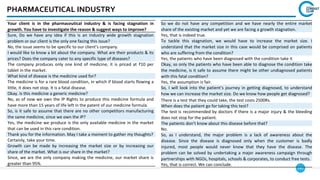
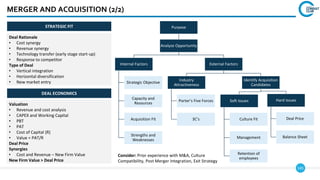
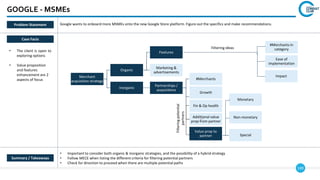
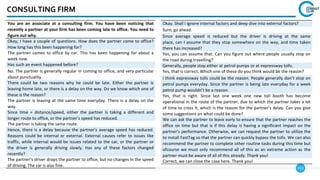
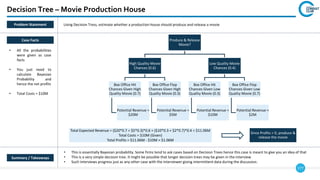
Problem Statement Guesstimate the daily revenue of a typical fast-food chain in Kolkata
Total Revenue
Average Price # of items sold
Dine-In
Takeaway
Delivery
# of items sold
in Dine-In
# of operational
hours
Capacity (# of
seats)
Average
occupancy
# of items per
person
/ Average time a
seat is occupied
Average Price ₹100
Operational Hours 12
Capacity 50
Average Occupancy 70%
# of items per person 2
/ Average time a seat is occupied* 30 mins = 0.5 hours
Total Daily Revenue ₹1.68L
*The average time every person eats at a fast food restaurant =30
min, therefore 2 (60min/30min) people occupying a seat per hour]](https://image.slidesharecdn.com/iimcalcuttacasebook2023-24-231028175258-ad6d8536/85/IIM-Calcutta-CaseBook-2023-24-pdf-174-320.jpg)

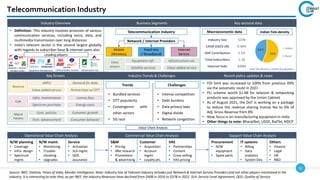
![180
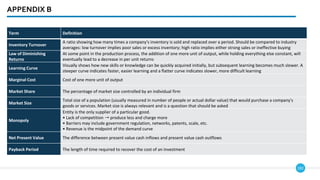
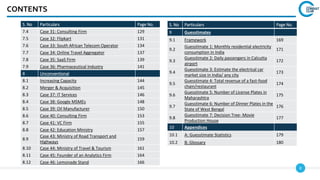
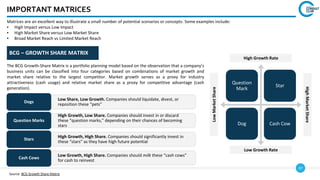
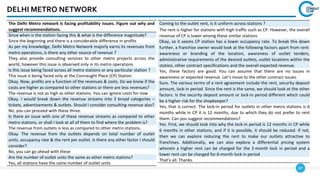
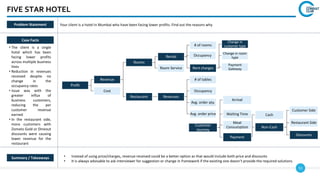
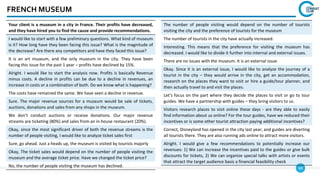
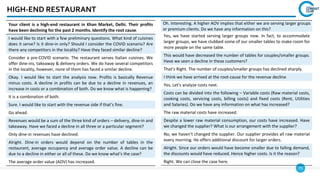
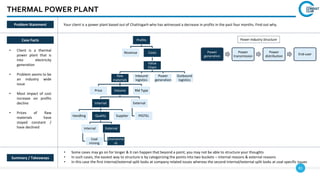
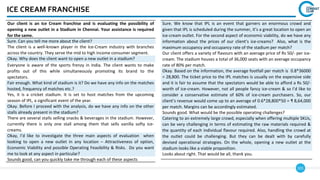
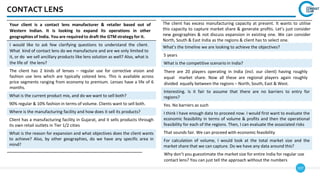
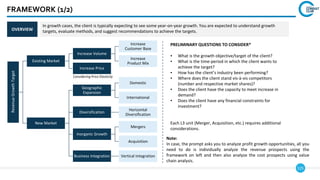
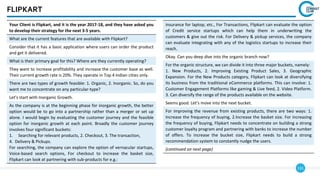
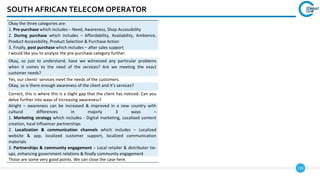
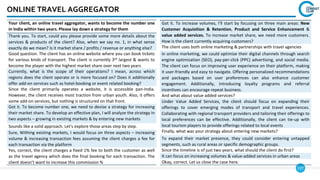
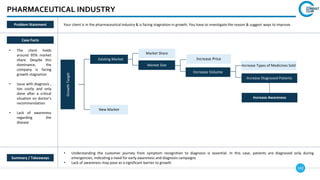
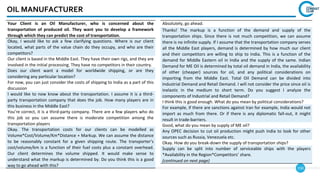
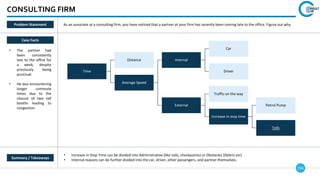
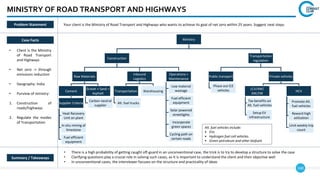
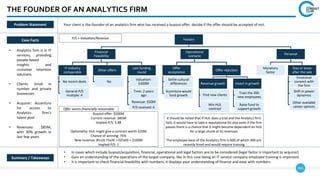
APPENDIX B
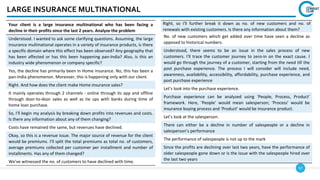
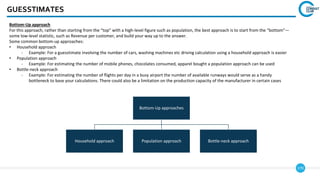
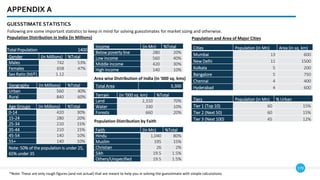
GLOSSARY Following are definitions to some key terms often used during case analysis
Term Definition
Adverse Selection
Situation in which an individual’s demand for insurance is aligned to their risk of loss (i.e. people with the highest expected
value will buy insurance) and the insurer cannot account for this correlation in the price
Arbitrage
The purchase of securities on one market for immediate resale on another market in order to profit from a price
discrepancy
Break-Even Total amount of revenue needed to offset the sum of a firm's costs. Implies that the firm's profit will be $0
CAGR
Compound Annual Growth Rate:
[(Ending Value/Beginning Value)^(1/n)]-1, n=no. of years
Capacity
The maximum level of output of goods and/or services that a given system can potentially produce over a set period of
time
Competitive Advantage
When a firm is able to deliver benefits equal to competitors but at a lower cost OR able to deliver greater benefits than
competitors
Consumer Surplus
Economic gain achieved when consumers purchase a product for a price less than their willingness to pay
Consumer Surplus = Willingness to Pay - Price
Contribution Margin C=P-V, where P is unit price, and V is variable cost per unit
Core Competencies The activities that a firm does well to create competitive advantage](https://image.slidesharecdn.com/iimcalcuttacasebook2023-24-231028175258-ad6d8536/85/IIM-Calcutta-CaseBook-2023-24-pdf-180-320.jpg)