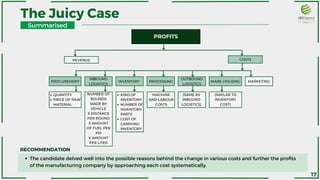
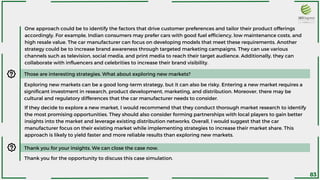
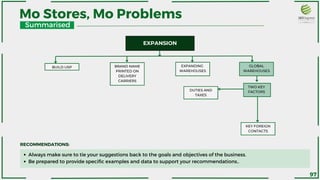
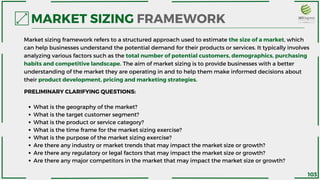
Here are a few tips based on your interviews:
1. Slow down and take your time. It's easy to get nervous and rush through cases, but interviews want to see your thoughtful process. Pause and think before answering questions.
2. Ask clarifying questions. Make sure you fully understand the context before analyzing. Asking questions shows good case skills.
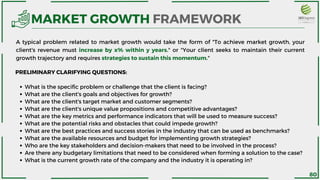
3. Use frameworks. Having a structured approach like the profitability framework helps stay organized and not miss any key factors. Customize the framework as needed for each case.
4. Quantify your recommendations. Interviews love it when you attach numbers to show impact. Even rough estimates are better than no numbers at all.
5. Practice out


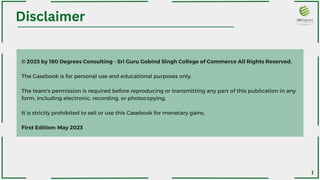


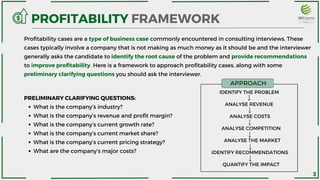


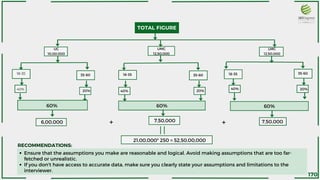
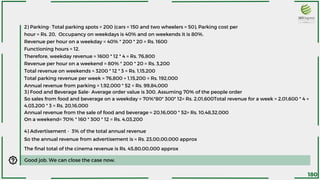
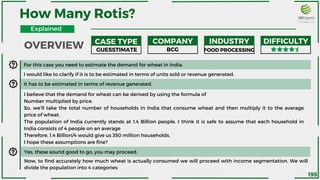
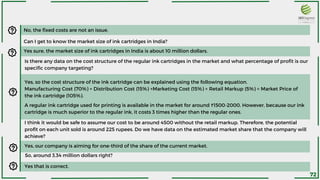
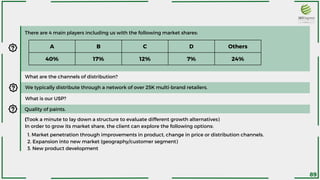
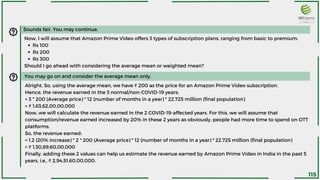
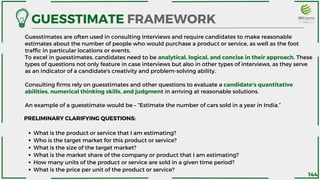
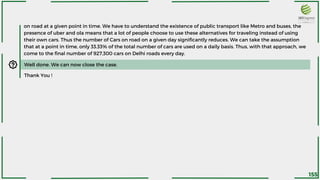
![Cool. So I will consider Monday, Tuesday, Wednesday, and Thursday to be non-peak days and Friday, Saturday, and
Sunday as peak days.
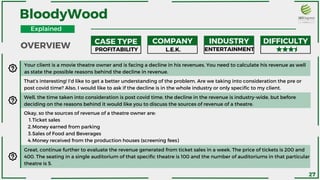
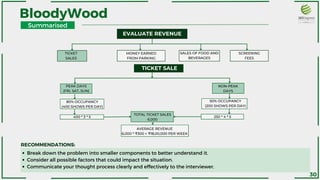
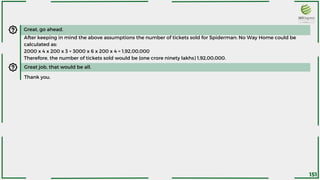
The total seating in the theatre is 500, and the average ticket price is 300 [(200 + 400)/ 2]
As per my belief, during non-peak days, the theatre would occupy 50% occupancy and during peak days, it will
occupy 80% occupancy.
Number of tickets sold in non peak days = 50 * 500 / 100 = 250 * 4 = 1,000
Number of tickets sold in peak days = 80 * 500 / 100 = 400 * 3 = 1,200
Total tickets sold in a week for a show= 1,200
Revenue from ticket sales for a show = 1,200 * ₹300 = ₹3,60,000
Considering the average number of shows to be 5, the average sales would be = 3,60,000 * 5 = ₹18,00,000
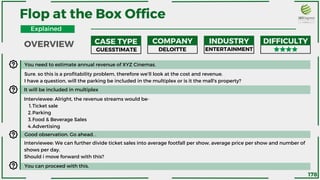
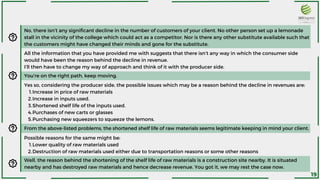
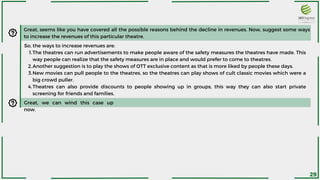
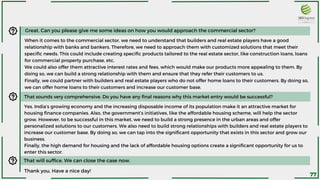
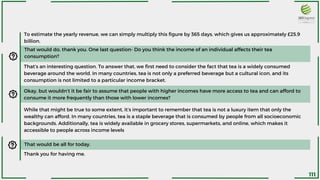
Well, you have quite accurately decoded the revenue from ticket sales. Since the time we are considering is post covid,
what could be the possible reasons for the same?
As the time is post covid, the reason behind the fall would be a decline in ticket sales due to covid concerns. Also, just
after the covid, the movies weren’t ready to be played at the theatres so that is also an issue. A lot of people have
shifted to OTT platforms to watch movies, this is also a reason behind the decline in sales.
A part of the revenue of theatre comes from production houses as well, as the production houses have chosen OTT
platforms to air their movies, the have stopped paying the theatre broadcasting fees, this again is a reason for the
decline in the revenues.
Another reason for the same could be that the pockets of people have been pinched up as well as a decline in the
popularity of movies, so people don’t prefer going to theatres now.
28](https://image.slidesharecdn.com/180dcsggscccaseclosed1-combinedorganized-v2-finalised-230620151707-c3c8eabd/85/180DCSGGSCC_CaseClosed-1-combined_organized-v2-finalised-pdf-43-320.jpg)


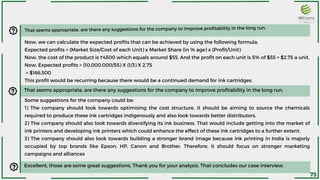


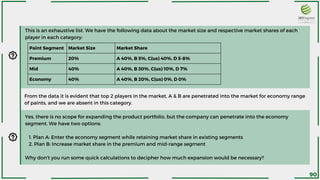


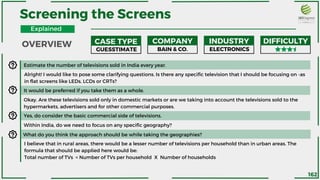
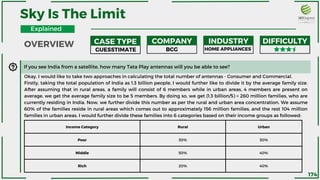
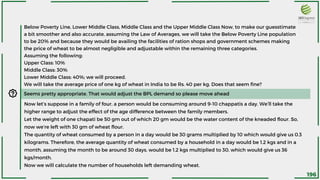
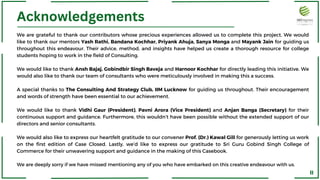
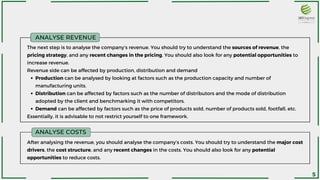
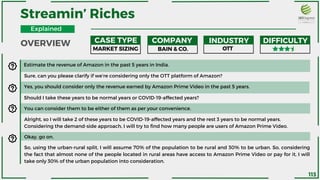
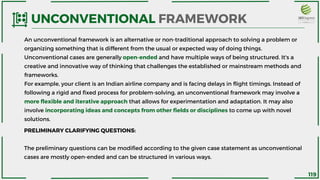
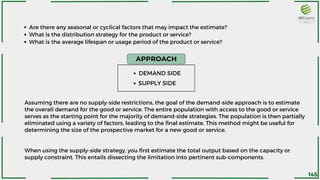
![CASE TYPE COMPANY INDUSTRY DIFFICULTY
MARKET SIZING EY BEVERAGE
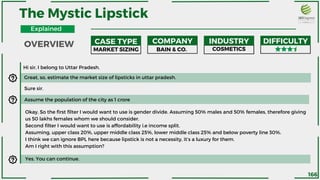
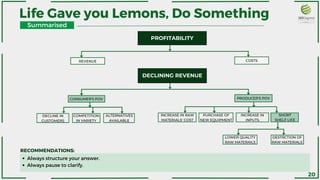
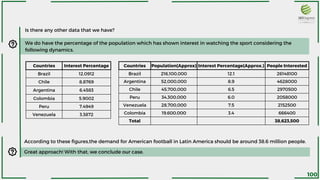
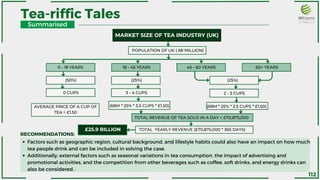
Can you estimate the market size (revenue) of a tea manufacturer in the UK in a year? Assume the population of the
UK to be around 68 million people.
Sure, I can give it a shot.
Firstly, I would like to divide the population into age groups to get a better understanding of the potential tea-
drinking market. Let’s assume that people aged 0-18 (50%) do not drink tea at all. For people aged 18-45 (25%), I will
estimate that they drink 3-4 cups of tea per day.
Finally, for people aged 45-60 and 60+ (25% collectively), let’s assume they drink 2-3 cups per day.
That sounds reasonable. What’s next?
We need to estimate the average price of a cup of tea. According to my assumption, the average price of a cup of tea
in the UK is around £1.50.
To estimate the revenue of a single day, we can use the following formula:
[(68 million x 50%) x 0 cups) + (68 million x 25% x 3.5 cups x £1.50) + (68 million x 25% x 2.5 cups x £1.50)] =
£70,875,000.
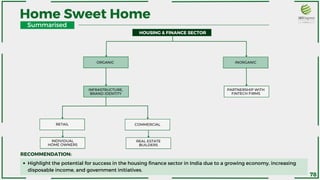
Tea-riffic Tales
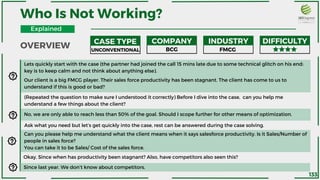
OVERVIEW
Explained
110](https://image.slidesharecdn.com/180dcsggscccaseclosed1-combinedorganized-v2-finalised-230620151707-c3c8eabd/85/180DCSGGSCC_CaseClosed-1-combined_organized-v2-finalised-pdf-125-320.jpg)
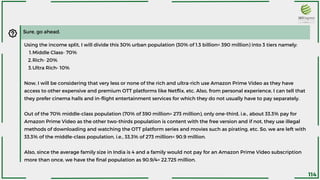


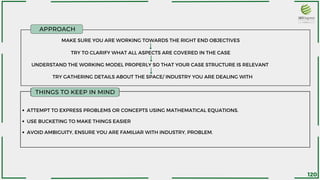


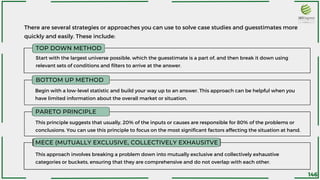


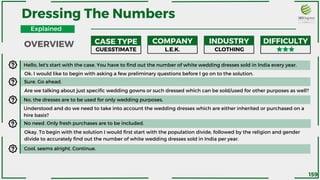
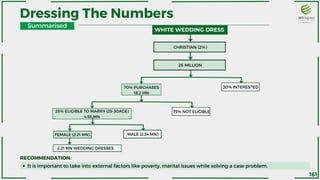
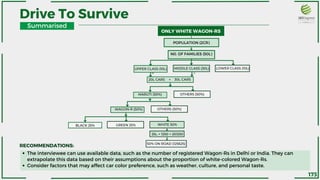
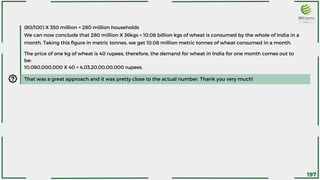
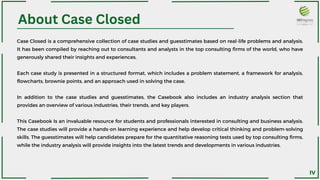
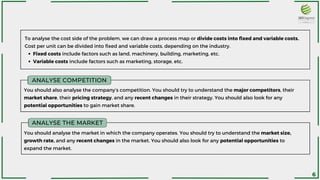
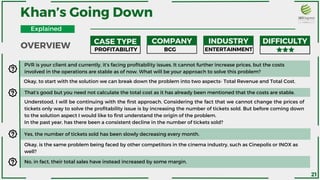
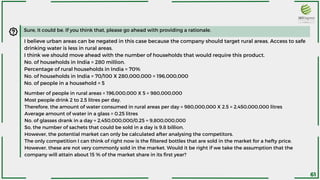
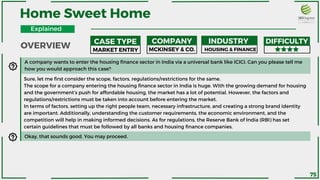
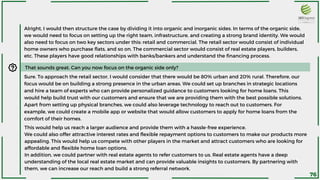
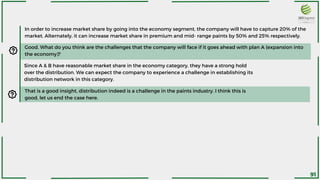
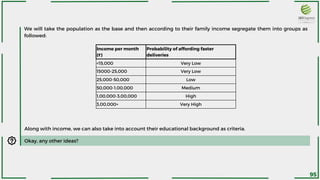
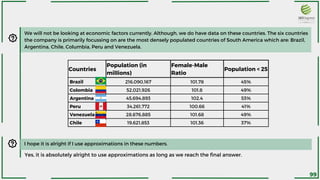
![Assuming that of the total population in India, 2% of the population belongs to the Christian religion and follows the
traditions of their culture. With this, we get 2% of 1.3 billion which is equivalent to 26 million people. Considering the
fact that a certain proportion of these people would not purchase the white wedding gown due to reasons like
poverty, not having a traditional marriage, not wanting to marry, or having inherited dresses, we can take the
assumption that only 70% of these people will have the necessary resources and conditions to go ahead with a
traditional Christian wedding. Through this, we come to approximately 18.2 million people. Now taking into account
that the majority of the people who would be getting married will fall in the age bracket of 20-30. So we can get 25%
of 18.2 million people which will roughly come out to be 4.55 million. Now marriage is dependent on the female
population and India has an average sex ratio of 950 in 1000 males. Calculating by this approach [0.95/ ( 1+0.95 )] * 4.55
million, we get 2.21 million.
160](https://image.slidesharecdn.com/180dcsggscccaseclosed1-combinedorganized-v2-finalised-230620151707-c3c8eabd/85/180DCSGGSCC_CaseClosed-1-combined_organized-v2-finalised-pdf-175-320.jpg)