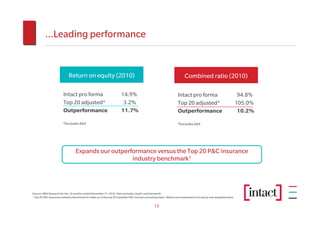
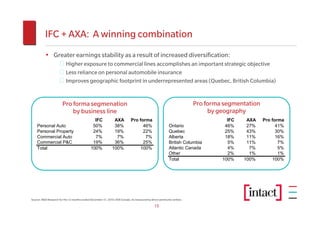
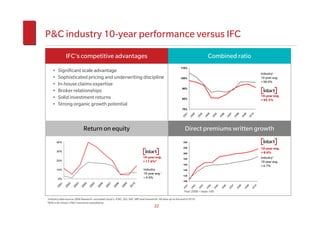
Intact Financial Corporation (TSX: IFC)
Investor Presentation
September 2011
Canada’s leader in auto, home and business insurance

                                  Who we are1                                                  Distinct brands

      •   Largest P&C insurer in Canada
      •   $6.5 billion in direct premiums written
      •   #1 in Ontario, Quebec, Alberta, Nova Scotia
      •   $12.3 billion cash and invested assets
      •   Proven industry consolidator


                              Scale advantage                                             Industry outperformer
     2010 Direct premiums written2
     ($ billions)                                      Top five insurers
                     $6.5                              represent 42.9%             10-year performance –         IFC
                                                         of the market             IFC vs. P&C industry2   outperformance
                                 $3.3

                                              $2.4        $2.4        $2.3          Premium growth               1.8 pts

                                                                                    Combined ratio3              3.8 pts
                  Intact1      Aviva          TD          RSA         Co-
                                                                   operators
  Market
                   16.5%        8.4%         6.1%         6.0%         5.9%
                                                                                    Return on equity4            7.7 pts
  share


1 Pro forma acquisition of AXA Canada
2 Industry data  source: MSA Research excluding Lloyd’s, ICBC, SGI, SAF,
  MPI and Genworth. All data as at the end of 2010.                            2
3 Combined ratio includes the market yield adjustment (MYA)
4 ROE is for Intact’s P&C insurance subsidiaries
Consistent industry outperformance


Significant                 Sophisticated               In-house claims                  Broker                    Multi-channel           Proven
scale                       pricing and                 expertise                        relationships             distribution            acquisition
advantage                   underwriting                                                                                                   strategy


                2010 combined ratios                                                            Five-year average loss ratios
                                                                                                                       Industry            Intact
      107%                                                                                80%
                       105.0%                                                                   75.1%
                                                     Cdn. P&C                                                         69.7%       71.0%
                                                  industry average                        70%              68.6%
      102%                                           = 101.0%
                                                                                                                                          60.3%
                                                                                          60%
                                                                                                                                                    55.1%

       97%                              96.3%
                                                                                          50%
                                                         94.8%

                                                                                          40%
       92%
                       Top 20*
                      (average)                           + AXA
                                                                                          30%
                                                        Pro forma                                   Auto             Personal Property    Commercial P&C


Industry data source: MSA Research excluding Lloyd’s, ICBC, SGI, SAF, MPI and Genworth
Data in both charts is for the year ended December 31, 2010
Includes market yield adjustment (MYA)
* Top 20 excludes Lloyd’s, Genworth, AXA, and IFC


                                                                                   3
We continued to outperform the industry in H1-2011
                   Operating highlights:                                                                     Comparison with Canadian P&C
                     Q2-2011 results                                                                             industry1 benchmark
                                                                                                                                     +AXA   Top 20
• Net operating income per share of $0.87,                                                            102%

                                                                                                                                            100.4%
     despite $0.84 in losses from natural                                                             99%
     catastrophes
                                                                                                                96.7%

• Q2 combined ratio of 97.0% driven by                                                                96%
                                                                                                                             94.9%
     very strong underwriting results from our
     auto businesses                                                                                  93%

                                                                                                                Combined ratio (including MYA)
• DPW growth of 2% in personal lines                                                                   25%


     reflects slower growth in our direct                                                              20%     18.9%
                                                                                                                              20.0%

     businesses, notably in Ontario, while                                                             15%
     commercial lines grew 5% year-over-year
                                                                                                       10%

• Return on equity of 17.3% and operating                                                               5%
                                                                                                                                              6.2%


     ROE of 13.6% for the last 12 months, with                                                          0%
     an 11% increase in book value per share                                                                            Return on equity
                                                                                                        5%
                                                                                                                               4.5%

                                                                                                        4%                                    3.6%

                                                                                                        3%      2.7%


                                                                                                        2%


                                                                                                        1%
1. Industry data source: MSA Research, excluding Lloyd’s, Genworth, AXA and Intact, H1-2011 results
                                                                                                        0%
                                                                                                                  Direct premiums written growth
                                                                                     4                                  (including FA pools)
Q2-2011 Financial highlights

(in $ millions, except as otherwise noted)
                                             Q2-2011    Q2-2010    Change     YTD-2011      YTD-2010        Change

 Direct premiums written                       $1,354     $1,318       3%       $2,297         $2,232              3%

 Net underwriting income                         $33        $66      (50)%          $91           $135          (33)%

 Combined ratio                                97.0%      93.7%     3.3 pts      95.8%          93.5%          2.3 pts

 Net operating income                                                (16)%                       $1.98
 per share (in dollars)                         $0.87      $1.04                  $1.78                        (10)%

 Earnings per share                                                   (8)%        $2.54          $2.40             6%
 (in dollars)                                   $1.12      $1.22

 Trailing 12-month
 operating ROE                                 13.6%        n/a        n/a

• Underwriting performance was good but combined ratio was 3.3 points weaker than Q2-2010 as strong core underwriting
  in our auto businesses and continued favourable prior year claims development (largely driven by industry pools) were
  more than offset by significantly higher catastrophe losses.
• Operating ROE of 13.6% (ROE of 17.3%) with an 11% increase in book value per share to $26.89
• Growth in direct premiums written at 3% year-over-year


                                                              5
Strong financial position and excess capital
                         Strong balance sheet                $12.3 billion in cash and invested assets1
     • Excess capital of $758 million, based on 170%
       MCT, of which ~$400 million will be used to
       finance the acquisition of AXA Canada                                               Loans      Cash and short
                                                                         Common             3%        term notes 3%
     • As at the end of Q2-2011, the debt to total                        shares
       capital ratio was 14.4%. Although this will rise                    10%
       due to the AXA Canada acquisition, we intend to
       reduce the ratio to a level of 20% within 2 years.
     • Solid ratings from A.M. Best, Moody’s and DBRS
                                                             Preferred
     • Adequate claims reserves evidenced by                  shares
       consistent favourable development                       12%


           High-quality investment portfolio
     • Approx. 99.2% of bonds are rated A or better
     • 79.9% of preferred shares are highly-rated as                                                                   Fixed income
                                                                                                                           72%
       P1 or P2
     • $75 million in net investment income and
       market-based yield of 4.2% in Q2-2011                 Note: Invested asset mix is net of hedging positions

All figures as of June 30, 2011 unless otherwise noted
1 Pro forma acquisition of AXA Canada


                                                         6
12-month industry outlook

 We remain well-positioned to continue outperforming the Canadian P&C
            insurance industry in the current environment
                      • Industry premiums likely to increase at a similar rate as in 2010, with mid-
 Premium growth         single digit growth in personal auto (driven by ON), upper single digit
                        growth in personal property (reflecting impact of water related losses and
                        more frequent and/or severe storms) and low single digit growth in
                        commercial lines
                      • As a result of IFC’s disciplined pricing strategy, we are well-positioned to
                        grow organically as market pricing becomes more rational
                      • Capital markets remain volatile, as economic data (particularly outside of
 Capital markets        Canada) raise questions about the sustainability of global recovery. Low
                        interest rates continue to pressure investment yields which could influence
                        higher premiums across the industry
                      • Capital requirements are not expected to negatively impact IFC to the same
                        degree as the overall P&C insurance industry, given the composition of our
                        investment portfolio and the nature of our claims liabilities
                      • The industry’s ROE was approximately 7%, both in 2010 and in the first half
 Return on equity       of 2011. Although the combined ratio may improve, we believe this would be
                        largely offset by a reduction in the level of investment income. Consequently,
                        we do not expect material improvement in ROEs in the near term
                      • We strongly believe IFC is likely to outperform
                        the industry’s ROE by at least 500 basis points                            in
                        the next 12 months


                                     7
Four distinct avenues for growth

  Benefit from firming market conditions                             Develop existing platforms

 Personal lines                                                               • Continue to expand support to
 • Industry premiums remain inadequate in ON auto                               our broker partners
 • Home insurance premiums also on the rise
                                                                              • Expand and grow belairdirect
 Commercial lines                                                               and GP Car and Home
 • Evidence of price firming in the past year
 • Opportunity to gain share in mid-market                                    • Transform BrokerLink by
                                                                                leveraging scale

     Consolidate Canadian P&C market                            Expand beyond existing markets
 Capital                                                  Principles
 • Strong financial position                              • Financial guideposts: long-term customer growth, IRR>20%
                                                          • Stepped approach with limited near-term capital outlay
 Strategy                                                 • Build growth pipeline with meaningful impact in 5+ years
 • Grow areas where IFC has a competitive advantage       Strategy
 Opportunities                                            • Enter new market in auto insurance by leveraging strengths:
                                                            1) pricing, 2) claims and 3) online expertise
 • Global capital requirements becoming more stringent
                                                          Opportunities
 • Industry underwriting results remain challenged        • Emerging markets or unsophisticated targets in mature
 • Continued difficulties in global capital markets         markets

                                                      8
Conclusion: Intact Financial

Disciplined pricing, underwriting, investment and capital management
have positioned us well for the future

 •   Largest P&C insurance company in Canada
 •   Consistent track record of industry outperformance
 •   Strong financial position
 •   Excellent long-term earnings power
 •   Organic growth platforms easily expandable
 •   AXA Canada acquisition on-track to close in the fall


                                      9
IFC’s acquisition of AXA Canada:
Building a world-class P&C insurer
Acquisition of AXA Canada:
Building a world-class P&C insurer
                          Strong strategic fit                                                                  Financially compelling
• Strengthens IFC’s premiums by over 40%                                                       • Management estimates IRR1 of 20%
• Bolsters our risk selection and claims management                                            • Acquisition is accretive to NOIPS2,3 in 2012; annual
  capabilities                                                                                   accretion of 15% expected in the mid-term3
• Capitalizes on a unique opportunity to combine two                                           • Operational synergies in excess of $100 million (after-tax)
  best-in-class operators                                                                        expected annually
• Accelerates IFC’s growth profile with industry-leading                                       • Strong annual cash flows from operating earnings
  underwriting performance
• Bolsters proprietary distribution


         Numerous diversification benefits                                                              Solid financial position maintained

• Strengthens commercial lines offering, presence                                              • Improves our ability to outperform the P&C insurance
  and expertise                                                                                  industry’s ROE by at least 500 bps per year
• Expands geographic footprint                                                                 • Accretive to book value per share
• Enhances strength of multi-channel distribution                                              • Optimal deployment of our excess capital
• Greater stability of earnings                                                                • Capital ratio remains strong with MCT of 200%
• Increases bench strength of executive team

1 Internal Rate of Return, based on equity returns.
2 NOIPS = net operating income per share. A non-IFRS measure. Accretion based on consensus estimate of $4.78.
3 Excluding non-recurring restructuring costs.


                                                                                     11
Leading position…
                                                                Top 10 Canadian P&C insurance
                                   6.5
                                                              companies by 2010 direct premiums
                                                                       written ($ billions)


                                                  3.3


                                                                 2.4            2.4            2.3
                                                                                                               2.0            2.0            1.9
                                                                                                                                                            1.7        1.6


                               PF Intact +       Aviva          TD              RSA       Co-operators        AXA        Wawanesa       State Farm     Economical   Desjardins
                                  AXA                        Assurance

              Rank                  1              2             3              4              5               6              7              8              9           10
              Share              16.5%            8.4%          6.1%            6.0%           5.9%           5.1%            5.1%           5.0%           4.3%       4.2%


                    Segmentation and claims management capabilities enhanced by increased scale
Source: MSA Research for the 12 months ended December 31, 2010. Each insurers’ market share listed above includes all subsidiary entities consolidated under the
parent company. Data excludes Lloyd’s, ICBC, SGI, SAF, MPI and Genworth. RSA includes GCAN.

                                                                                             12
…Leading performance


                            Return on equity (2010)                                                                      Combined ratio (2010)

                        Intact pro forma                              14.9%                                         Intact pro forma                                 94.8%
                        Top 20 adjusted*                               3.2%                                         Top 20 adjusted*                                105.0%
                        Outperformance                                11.7%                                         Outperformance                                   10.2%
                        *Excludes AXA                                                                               *Excludes AXA


                                  Expands our outperformance versus the Top 20 P&C insurance
                                                     industry benchmark1


Source: MSA Research for the 12 months ended December 31, 2010. Data excludes Lloyd’s and Genworth.
1 Top 20 P&C insurance industry benchmark is made up of the top 20 Canadian P&C insurers excluding Intact. Metrics are measured on an equity size-weighted basis.


                                                                                                 13
AXA Canada: Expanding our expertise
             − Offers a range of P&C and Life & Health insurance products through its relationships with
                    1,300 insurance brokers and 2,700 independent insurance advisors
             − The sixth largest P&C insurer in Canada with a 5.1% share in 2010
             − Strong presence in provinces of Quebec, Ontario and British Columbia
             − Significant expertise in commercial lines

                            2010 P&C DPW by class of insurance                                                                      2010 P&C DPW by geography
                                                                                                                                         Atlantic Canada Other2
                                                      Other 1               Personal auto
                        Commerical auto                                                                                                         7%        1%      Quebec
                                                       7%                       38%                                            Alberta
                               7%                                                                                                                                  43%
                     Liability                                                                                                  11%
                      12%
                                                                                                                 British Columbia
                                                                                                                        11%


        Commercial property
             18%                                                Personal property                                                         Ontario
                                                                     19%                                                                   27%


                                                 Total 2010 P&C Direct premiums written = $2.0 billion

1 Other (7%) includes Surety (3%), Marine (2%), Boiler (1%), Aircraft (0.3%), A&S (0.3%), and Fidelity (0.2%).
2 Other (1%) includes the Prairies (1.0%) and the Territories (0.3%).

Source: MSA Research for the 12 months ended December 31, 2010; AXA Canada.
                                                                                                      14
IFC + AXA: A winning combination
          • Greater earnings stability as a result of increased diversification:
                     ‒ Higher exposure to commercial lines accomplishes an important strategic objective
                     ‒ Less reliance on personal automobile insurance
                     ‒ Improves geographic footprint in underrepresented areas (Quebec, British Columbia)


                       Pro forma segmenation                                                                          Pro forma segmentation
                           by business line                                                                                by geography
                                               IFC            AXA          Pro forma                                             IFC    AXA    Pro forma
    Personal Auto                             50%             38%                46%                    Ontario                 46%     27%          41%
    Personal Property                         24%             19%                22%                    Quebec                  25%     43%          30%
    Commercial Auto                            7%              7%                 7%                    Alberta                 18%     11%          16%
    Commercial P&C                            19%             36%                25%                    British Columbia         5%     11%           7%
    Total                                    100%            100%              100%                     Atlantic Canada          4%      7%           5%
                                                                                                        Other                    2%      1%           1%
                                                                                                        Total                  100%    100%        100%


Source: MSA Research for the 12 months ended December 31, 2010; AXA Canada. As measured by direct premiums written.

                                                                                             15
IFC + AXA: Building a world-class P&C insurer
Strong strategic fit: combining sophisticated underwriting and claims
management, while enhancing our multi-channel distribution
• Increased scale advantage bolsters our risk selection and claims management capabilities
• Enhanced commercial lines mid-market offering, presence and expertise
• Expanded geographic footprint in underrepresented areas
• Improved ability to outperform the P&C insurance industry’s ROE by 500 bps per year

Unique opportunity to combine two best-in-class operators in a
financially compelling manner
• Estimated internal rate of return of 20%
• Expected annual accretion to operating earnings per share of 15% in the mid-term
• Operational synergies in excess of $100 million (after-tax) expected annually


                                          16
AXA Canada: acquisition on-track

• Integration planning process initiated immediately following the
  announcement
• Numerous task forces established, comprised of employees from both IFC
  and AXA, charged with:
    − Reviewing activities, processes and systems of both companies
    − Identifying potential synergies
    − Developing appropriate action plans
• Acquisition expected to close in the fall, once all regulatory approvals are
  received
• Targeting to begin the integration of AXA business on our platform before
  year-end


                                    17
AXA Canada: acquisition financing in place
               Original structure                              $1,300 million financing
Funding from excess capital            $500 million
Proceeds from subscription receipts    $800 million
Acquisition credit facilities         $1,300 million     Term loan                        $300 million
                                      $2,600 million     Preferred shares                 $500 million
                                                         10-yr medium-term notes          $300 million
                                                         50-yr notes private placement    $100 million
             After over allotment                         Completed                      $1,200 million
Funding from excess capital             $377 million
Proceeds from subscription receipts (1) $923 million                   Remaining
Acquisition credit facilities          $1,300 million
                                                         Medium-term notes          up to $100 million
                                       $2,600 million


 (1) Net of underwriters commission


                                                    18
Appendices
P&C insurance is a $40 billion market in Canada

                         3% of GDP in Canada                                              Industry DPW by line of business
                                                                                            Home                           Commercial
  • Fragmented market1:                                                                   insurance,                       P&C, 26.6%
                                                                                            19.0%
       •Top five represent 43%, versus bank/lifeco
        markets which are closer to 65-75%
       •IFC is largest player with 16.5% market share,                                                                               Commercial
        versus largest bank/lifeco with 22-25%                                                                                       other, 8.4%
        market share
       •P&C insurance shares the same regulator as
        the banks and lifecos                                                                  Automobile,
                                                                                                 46.0%
  • Barriers to entry: scale, regulation,
    manufacturing capability, market knowledge
                                                                                          Industry – premiums by province
  • Home and commercial insurance rates
    unregulated; personal auto rates regulated in
                                                                                                                      Alberta, 16%
    some provinces                                                                          Quebec, 17%
                                                                                                                                        British
  • Capital is regulated nationally by OSFI                                                                                          Columbia, 9%
  • Brokers continue to own commercial lines and a                                                                                       Eastern
    large share of personal lines in Canada; direct-to-                                                                                Provinces &
    consumer channel is growing (distribution =                                                                                        Territories,
                                                                                                                                           7%
    brokers 67% and direct 33%)
  • 30-year return on equity for the industry is                                                                                Prairies, 3%
    approximately 10%                                                                                  Ontario, 48%

1 Pro forma IFC’s acquisition of AXA Canada

Industry data source: MSA Research excluding Lloyd’s, ICBC, SAF, SGI, MPI and Genworth.
OSFI = Office of the Superintendent of Financial Institutions Canada                 20
Data as at the end of 2010.
Economic uncertainties will affect industry profitability

• Slow global recovery with significant               The Canadian P&C industry can no longer
    downside risks                                        count on high investment income
•   Continued volatility in financial,
    currency and commodity markets              14%
•   Financial systems still somewhat            12%
    vulnerable to downside shocks               10%
•   Uncertainties will put pressure on          8%
                                                                                                   P&C Industry
                                                                                                   profitability
    financial institutions’ capital             6%           3-5 year
    worldwide                                                Government of
                                                4%
•   Interest rates to remain low for the                     Canada bond yield
                                                2%
    next 18 to 24 months
                                                0%
•   A drop of 1% in investment income is              1989       1992       1995     1998   2001    2004    2007   2010
    equivalent to a 2 to 3 point increase in    Source: Insurance Bureau of Canada
    the combined ratio


                                           21
P&C industry 10-year performance versus IFC
                IFC’s competitive advantages                                                                                           Combined ratio
                                                                                                            115%
    •    Significant scale advantage                                                                                                                                                           Industry1
    •    Sophisticated pricing and underwriting discipline                                                  105%                                                                               10-year avg.
                                                                                                                                                                                               = 99.0%
    •    In-house claims expertise
                                                                                                             95%
    •    Broker relationships
                                                                                                                                                                                               10-year avg.
    •    Solid investment returns                                                                            85%                                                                               = 95.3%
    •    Strong organic growth potential
                                                                                                             75%


                                                                                                              01

                                                                                                                      02

                                                                                                                              03

                                                                                                                                      04

                                                                                                                                              05

                                                                                                                                                      06

                                                                                                                                                               07

                                                                                                                                                                       08

                                                                                                                                                                               09

                                                                                                                                                                                       10
                                                                                                             20

                                                                                                                     20

                                                                                                                             20

                                                                                                                                     20

                                                                                                                                             20

                                                                                                                                                     20

                                                                                                                                                              20

                                                                                                                                                                    20

                                                                                                                                                                            20

                                                                                                                                                                                    20
                               Return on equity                                                                Direct premiums written growth
        40%                                                                                                   240

                                                                                                              220                                                                              10-year avg.
        30%                                                                                                                                                                                    = 8.6%
                                                                                                              200
                                                                              10-year avg.                    180                                                                              Industry1
        20%                                                                   = 17.6%2                                                                                                         10-year avg.
                                                                                                              160
                                                                                                                                                                                               = 6.7%
        10%                                                                   Industry                        140
                                                                              10-year avg.1
                                                                                                              120
         0%                                                                   = 9.9%
                                                                                                              100
          1

                 2

                        3

                               4

                                      5

                                             6

                                                    7

                                                           8

                                                                  9

                                                                         0
           0

                  0

                         0

                                0

                                       0

                                              0

                                                     0

                                                            0

                                                                   0

                                                                          1


                                                                                                                01


                                                                                                                        02


                                                                                                                                03


                                                                                                                                        04


                                                                                                                                                05


                                                                                                                                                         06


                                                                                                                                                                  07


                                                                                                                                                                          08


                                                                                                                                                                                  09


                                                                                                                                                                                          10
        20

               20

                      20

                             20

                                    20

                                           20

                                                  20

                                                         20

                                                                20

                                                                       20


                                                                                                             20


                                                                                                                     20


                                                                                                                             20


                                                                                                                                     20


                                                                                                                                             20


                                                                                                                                                      20


                                                                                                                                                               20


                                                                                                                                                                       20


                                                                                                                                                                               20


                                                                                                                                                                                       20
                                                                                                              Year 2000 = base 100

1Industry data source: MSA Research. excluded Lloyd’s, ICBC, SGI, SAF, MPI and Genworth. All data up to the end of 2010.
2ROE is for Intact’s P&C insurance subsidiaries

                                                                                      22
Historical financials
                                              IFRS                   Canadian GAAP
(in $ millions, except as otherwise noted)
                                              2010      2009         2008     2007      2006
Income statement highlights
Direct written premiums                       $4,498        $4,275   $4,146   $4,109   $3,994
Underwriting income                              194           54      117      189      404
Net operating income                             402          282      361      457      531
Net operating income per share (in dollars)     3.50         2.35      2.96     3.61     3.97
Balance sheet highlights
Total investments                             $8,653        $8,057   $6,605   $7,231   $7,353
Debt                                             496          398         -        -        -
Total shareholders' equity (excl. AOCI)        2,686        3,047     3,079    3,290   3,421
Performance metrics
Loss ratio                                     65.4%        70.0%    68.2%    66.2%    59.1%
Expense ratio                                  30.0%        28.7%    28.9%    29.0%    30.3%
Combined ratio                                 95.4%        98.7%    97.1%    95.2%    89.4%
Net operating ROE (excl. AOCI)                 15.0%         9.2%     11.3%    13.6%   16.8%
Debt / Capital                                 14.3%        11.8%         -        -        -
Combined ratios by line of business
Personal auto                                  98.1%        94.9%    95.9%    94.5%    87.3%
Personal property                              96.5%    109.0%       113.6%   102.2%   100.0%
Commercial auto                                86.0%        79.8%    87.2%    93.7%    86.9%
Commercial P&C                                 90.7%    104.1%       85.3%    90.1%    85.2%


                                                       23
Strategic capital management
• Strong capital base has allowed us to pursue
  our growth objectives while returning capital
  to shareholders                                                        Quarterly dividend
                 Capital priorities                                                                                  8.8%
                                                                                                          6.3%
                                                                                              3.2%
   • Acquisitions                                      0.40
                                                                                  14.8%                               $0.370
                                                                                                            $0.340
   • Dividends                                         0.35              8.0%
                                                                                          $0.310   $0.320
                                                       0.30   53.8%
   • Share buybacks                                                     $0.250
                                                                                 $0.270
                                                       0.25

                                                       0.20
           Share buyback history                              $0.1625
                                                       0.15

                                                       0.10
   • 2011 – Board authorized renewal
                                                       0.05
     of NCIB for an additional 5%
                                                        -
   • 2010* – Repurchased 9.7 million                           2005     2006     2007     2008     2009      2010     2011
     shares for a total of $433 million
   • 2008 – Repurchased 4.6 million
     shares for a total of $176 million
   • 2007 – Completed a $500 million
     Substantial Issuer Bid
   * Feb. 22, 2010 – Feb. 21, 2011


                                                  24
Cash and invested assets

                                            Asset class

      Fixed income                                     Preferred shares

      Corporate                         34.3%           Perpetual and callable floating             50.3%
      Federal government and agency     28.2%           and reset
      Cdn. Provincial and municipal     28.2%           Fixed perpetual                             32.5%
      Supranational and foreign           7.2%          Fixed callable                              17.2%
      ABS/MBS                             2.0%          TOTAL                                        100%
      Private placements                  0.1%
      TOTAL                              100%          Quality:                                 100% Canadian
                                                       Approx. 79.9% rated P1 or P2
       Canadian                          89%
       United States                      1%
       Int’l (excl. U.S.)                10%          Common shares
       TOTAL                            100%


   Quality: 99.2% of bonds rated A or better          High-quality, dividend paying Canadian    100% Canadian
                                                      companies. Objective is to capture non-
                                                      taxable dividend income


As of June 30, 2011

                                                 25
Long-term track record of prudent reserving practices


                                              Rate of claims reserve development
• Quarterly and annual                        (favourable prior year development as a % of opening reserves)
    fluctuations in reserve
                                         9%
    development are normal                                7.9%
                                         8%


• 2005/2006 reserve development          7%


    was unusually high due to the        6%
                                                                   4.9%                               4.8%
    favourable effects of certain auto   5%
                                                                                    4.0%
    insurance reforms introduced         4%
                                                 3.3%                                        3.2%
                                                                           2.9%
    during that time period              3%

                                         2%

• This reflects our preference to        1%

    take a conservative approach to      0%

    managing claims reserves                     2004     2005     2006     2007    2008     2009     2010


                                                         Historical long-term average has
                                                             been 3% to 4% per year


                                         26
Experienced and united leadership team

                                                                                     Years In   Years With
                                                                                     Industry      IFC

 Brindamour, Charles      President & CEO                                              18          18
 Beaulieu, Martin         SVP, Personal Lines                                          23          23
 Black, Susan             SVP, Chief HR Officer                                         3           3
 Blair, Alan              SVP, Atlantic Canada                                         27          27
 Coull-Cicchini, Debbie   SVP, Ontario                                                  6           6
 Désilets, Claude         Chief Risk Officer                                           29          21
 Gagnon, Louis            President, Intact Insurance                                  18           4
 Garneau, Denis           SVP, Quebec                                                  22          8
 Guénette, Françoise      SVP, Corporate & Legal Services                              22          13
 Guertin, Denis           President, Direct to Consumers Distribution                  26          26
 Hindle, Byron            SVP, Commercial Lines                                        32          10
 Iles, Derek              SVP, Western Canada                                          38          20
 Lincoln, David           SVP, Corporate Audit Services (Canada)                       32          14
 Ott, Jack                SVP, Chief Information Officer                               29          14
 Pontbriand, Marc         Executive Vice President                                     13          13
 Provost, Marc            SVP & Managing Director IIM and Chief Investment Officer     27          13
 Tullis, Mark             Chief Financial Officer                                      32          12
 Weightman, Peter         President, BrokerLink                                        24          24


                                                  27
Investor Relations contact information
Dennis Westfall
Director, Investor Relations
Phone: 416.341.1464 ext 45122 Cell: 416.797.7828
Email: Dennis.Westfall@intact.net


Email: ir@intact.net
Phone: 416. 941.5336 or 1.866.778.0774 (toll-free within North America)
Fax: 416.941.0006
www.intactfc.com/Investor Relations


                                          28
Forward-looking statements and disclaimer
Certain of the statements included in this presentation about the Company’s current and future plans, expectations and intentions, results, levels of
activity, performance, goals or achievements or any other future events or developments constitute forward-looking statements. The words “may”,
“will”, “would”, “should”, “could”, “expects”, “plans”, “intends”, “trends”, “indications"," anticipates”, “believes”, “estimates”, “predicts”, “likely”,
“potential” or the negative or other variations of these words or other similar or comparable words or phrases, are intended to identify forward-looking
statements. Forward-looking statements are based on estimates and assumptions made by management based on management’s experience and
perception of historical trends, current conditions and expected future developments, as well as other factors that management believes are
appropriate in the circumstances. Many factors could cause the Company’s actual results, performance or achievements or future events or
developments to differ materially from those expressed or implied by the forward-looking statements, including, without limitation, the following
factors: the Company’s ability to implement its strategy or operate its business as management currently expects; its ability to accurately assess the
risks associated with the insurance policies that the Company writes; unfavourable capital market developments or other factors which may affect the
Company’s investments and funding obligations under its pension plans; the cyclical nature of the P&C insurance industry; management’s ability to
accurately predict future claims frequency; government regulations designed to protect policyholders and creditors rather than investors; litigation and
regulatory actions; periodic negative publicity regarding the insurance industry; intense competition; the Company’s reliance on brokers and third
parties to sell its products to clients; the Company’s ability to successfully pursue its acquisition strategy; the Company’s ability to execute its business
strategy; the terms and conditions of, and regulatory approvals relating to, the Acquisition of AXA Canada by the company (the “Acquisition”); timing
for completion of the Acquisition; synergies arising from, and the Company’s integration plans relating to the Acquisition; the Company’s financing
plans for the Acquisition; management's estimates and expectations in relation to resulting accretion, internal rate of return and debt to capital position
at closing of the Acquisition and thereafter, as applicable; various other actions to be taken or requirements to be met in connection with the Acquisition
and integrating the Company and AXA Canada after completion of the Acquisition; the Company’s participation in the Facility Association (a mandatory
pooling arrangement among all industry participants) and similar mandated risk-sharing pools; terrorist attacks and ensuing events; the occurrence of
catastrophic events; the Company’s ability to maintain its financial strength ratings; the Company’s ability to alleviate risk through reinsurance; the
Company’s ability to successfully manage credit risk (including credit risk related to the financial health of reinsurers); the Company’s reliance on
information technology and telecommunications systems; the Company’s dependence on key employees; general economic, financial and political
conditions; the Company’s dependence on the results of operations of its subsidiaries; the volatility of the stock market and other factors affecting the
Company’s share price; and future sales of a substantial number of its common shares.


                                                                        29
Forward-looking statements and disclaimer
All of the forward-looking statements included in this presentation are qualified by these cautionary statements and those made in the “Risk
Management” section of our MD&A for the year ended December 31, 2010. These factors are not intended to represent a complete list of the factors
that could affect the Company. These factors should, however, be considered carefully. Although the forward-looking statements are based upon what
management believes to be reasonable assumptions, the Company cannot assure investors that actual results will be consistent with these forward
looking statements. When relying on forward-looking statements to make decisions, investors should ensure the preceding information is carefully
considered. Undue reliance should not be placed on forward-looking statements made herein. The Company and management have no intention and
undertake no obligation to update or revise any forward-looking statements, whether as a result of new information, future events or otherwise, except
as required by law.

Important Notes:

 All references to direct premiums written in this document exclude industry pools, unless otherwise noted.

 All references to “excess capital” in this document include excess capital in the P&C insurance subsidiaries at 170% minimum capital test (“MCT”)
plus liquid assets in the holding company, unless otherwise noted.

 Catastrophe claims are any one claim, or group of claims, equal to or greater than $5.0 million, related to a single event.

 All underwriting results and related ratios exclude the Market Yield Adjustment (“MYA”), except if noted otherwise.

Disclaimer
The Company uses both International Financial Reporting Standards (“IFRS”) and certain non-IFRS measures to assess performance. Non-IFRS
measures do not have any standardized meaning prescribed by IFRS and are unlikely to be comparable to any similar measures presented by other
companies. Management of Intact Financial Corporation analyzes performance based on underwriting ratios such as combined, general expenses and
claims ratios as well as other performance measures such as return on equity (“ROE”) and operating return on equity. These measures and other
insurance related terms are defined in the Company’s glossary available on the Intact Financial Corporation web site at www.intactfc.net in the
“Investor Relations” section. Additional information about Intact Financial Corporation, including the Annual Information Form, may be found online on
SEDAR at www.sedar.com.


                                                                        30

IFC Investor Presentation Sept 19, 2011

  • 1.
    Intact Financial Corporation(TSX: IFC) Investor Presentation September 2011
  • 2.
    Canada’s leader inauto, home and business insurance Who we are1 Distinct brands • Largest P&C insurer in Canada • $6.5 billion in direct premiums written • #1 in Ontario, Quebec, Alberta, Nova Scotia • $12.3 billion cash and invested assets • Proven industry consolidator Scale advantage Industry outperformer 2010 Direct premiums written2 ($ billions) Top five insurers $6.5 represent 42.9% 10-year performance – IFC of the market IFC vs. P&C industry2 outperformance $3.3 $2.4 $2.4 $2.3 Premium growth 1.8 pts Combined ratio3 3.8 pts Intact1 Aviva TD RSA Co- operators Market 16.5% 8.4% 6.1% 6.0% 5.9% Return on equity4 7.7 pts share 1 Pro forma acquisition of AXA Canada 2 Industry data source: MSA Research excluding Lloyd’s, ICBC, SGI, SAF, MPI and Genworth. All data as at the end of 2010. 2 3 Combined ratio includes the market yield adjustment (MYA) 4 ROE is for Intact’s P&C insurance subsidiaries
  • 3.
    Consistent industry outperformance Significant Sophisticated In-house claims Broker Multi-channel Proven scale pricing and expertise relationships distribution acquisition advantage underwriting strategy 2010 combined ratios Five-year average loss ratios Industry Intact 107% 80% 105.0% 75.1% Cdn. P&C 69.7% 71.0% industry average 70% 68.6% 102% = 101.0% 60.3% 60% 55.1% 97% 96.3% 50% 94.8% 40% 92% Top 20* (average) + AXA 30% Pro forma Auto Personal Property Commercial P&C Industry data source: MSA Research excluding Lloyd’s, ICBC, SGI, SAF, MPI and Genworth Data in both charts is for the year ended December 31, 2010 Includes market yield adjustment (MYA) * Top 20 excludes Lloyd’s, Genworth, AXA, and IFC 3
  • 4.
    We continued tooutperform the industry in H1-2011 Operating highlights: Comparison with Canadian P&C Q2-2011 results industry1 benchmark +AXA Top 20 • Net operating income per share of $0.87, 102% 100.4% despite $0.84 in losses from natural 99% catastrophes 96.7% • Q2 combined ratio of 97.0% driven by 96% 94.9% very strong underwriting results from our auto businesses 93% Combined ratio (including MYA) • DPW growth of 2% in personal lines 25% reflects slower growth in our direct 20% 18.9% 20.0% businesses, notably in Ontario, while 15% commercial lines grew 5% year-over-year 10% • Return on equity of 17.3% and operating 5% 6.2% ROE of 13.6% for the last 12 months, with 0% an 11% increase in book value per share Return on equity 5% 4.5% 4% 3.6% 3% 2.7% 2% 1% 1. Industry data source: MSA Research, excluding Lloyd’s, Genworth, AXA and Intact, H1-2011 results 0% Direct premiums written growth 4 (including FA pools)
  • 5.
    Q2-2011 Financial highlights (in$ millions, except as otherwise noted) Q2-2011 Q2-2010 Change YTD-2011 YTD-2010 Change Direct premiums written $1,354 $1,318 3% $2,297 $2,232 3% Net underwriting income $33 $66 (50)% $91 $135 (33)% Combined ratio 97.0% 93.7% 3.3 pts 95.8% 93.5% 2.3 pts Net operating income (16)% $1.98 per share (in dollars) $0.87 $1.04 $1.78 (10)% Earnings per share (8)% $2.54 $2.40 6% (in dollars) $1.12 $1.22 Trailing 12-month operating ROE 13.6% n/a n/a • Underwriting performance was good but combined ratio was 3.3 points weaker than Q2-2010 as strong core underwriting in our auto businesses and continued favourable prior year claims development (largely driven by industry pools) were more than offset by significantly higher catastrophe losses. • Operating ROE of 13.6% (ROE of 17.3%) with an 11% increase in book value per share to $26.89 • Growth in direct premiums written at 3% year-over-year 5
  • 6.
    Strong financial positionand excess capital Strong balance sheet $12.3 billion in cash and invested assets1 • Excess capital of $758 million, based on 170% MCT, of which ~$400 million will be used to finance the acquisition of AXA Canada Loans Cash and short Common 3% term notes 3% • As at the end of Q2-2011, the debt to total shares capital ratio was 14.4%. Although this will rise 10% due to the AXA Canada acquisition, we intend to reduce the ratio to a level of 20% within 2 years. • Solid ratings from A.M. Best, Moody’s and DBRS Preferred • Adequate claims reserves evidenced by shares consistent favourable development 12% High-quality investment portfolio • Approx. 99.2% of bonds are rated A or better • 79.9% of preferred shares are highly-rated as Fixed income 72% P1 or P2 • $75 million in net investment income and market-based yield of 4.2% in Q2-2011 Note: Invested asset mix is net of hedging positions All figures as of June 30, 2011 unless otherwise noted 1 Pro forma acquisition of AXA Canada 6
  • 7.
    12-month industry outlook We remain well-positioned to continue outperforming the Canadian P&C insurance industry in the current environment • Industry premiums likely to increase at a similar rate as in 2010, with mid- Premium growth single digit growth in personal auto (driven by ON), upper single digit growth in personal property (reflecting impact of water related losses and more frequent and/or severe storms) and low single digit growth in commercial lines • As a result of IFC’s disciplined pricing strategy, we are well-positioned to grow organically as market pricing becomes more rational • Capital markets remain volatile, as economic data (particularly outside of Capital markets Canada) raise questions about the sustainability of global recovery. Low interest rates continue to pressure investment yields which could influence higher premiums across the industry • Capital requirements are not expected to negatively impact IFC to the same degree as the overall P&C insurance industry, given the composition of our investment portfolio and the nature of our claims liabilities • The industry’s ROE was approximately 7%, both in 2010 and in the first half Return on equity of 2011. Although the combined ratio may improve, we believe this would be largely offset by a reduction in the level of investment income. Consequently, we do not expect material improvement in ROEs in the near term • We strongly believe IFC is likely to outperform the industry’s ROE by at least 500 basis points in the next 12 months 7
  • 8.
    Four distinct avenuesfor growth Benefit from firming market conditions Develop existing platforms Personal lines • Continue to expand support to • Industry premiums remain inadequate in ON auto our broker partners • Home insurance premiums also on the rise • Expand and grow belairdirect Commercial lines and GP Car and Home • Evidence of price firming in the past year • Opportunity to gain share in mid-market • Transform BrokerLink by leveraging scale Consolidate Canadian P&C market Expand beyond existing markets Capital Principles • Strong financial position • Financial guideposts: long-term customer growth, IRR>20% • Stepped approach with limited near-term capital outlay Strategy • Build growth pipeline with meaningful impact in 5+ years • Grow areas where IFC has a competitive advantage Strategy Opportunities • Enter new market in auto insurance by leveraging strengths: 1) pricing, 2) claims and 3) online expertise • Global capital requirements becoming more stringent Opportunities • Industry underwriting results remain challenged • Emerging markets or unsophisticated targets in mature • Continued difficulties in global capital markets markets 8
  • 9.
    Conclusion: Intact Financial Disciplinedpricing, underwriting, investment and capital management have positioned us well for the future • Largest P&C insurance company in Canada • Consistent track record of industry outperformance • Strong financial position • Excellent long-term earnings power • Organic growth platforms easily expandable • AXA Canada acquisition on-track to close in the fall 9
  • 10.
    IFC’s acquisition ofAXA Canada: Building a world-class P&C insurer
  • 11.
    Acquisition of AXACanada: Building a world-class P&C insurer Strong strategic fit Financially compelling • Strengthens IFC’s premiums by over 40% • Management estimates IRR1 of 20% • Bolsters our risk selection and claims management • Acquisition is accretive to NOIPS2,3 in 2012; annual capabilities accretion of 15% expected in the mid-term3 • Capitalizes on a unique opportunity to combine two • Operational synergies in excess of $100 million (after-tax) best-in-class operators expected annually • Accelerates IFC’s growth profile with industry-leading • Strong annual cash flows from operating earnings underwriting performance • Bolsters proprietary distribution Numerous diversification benefits Solid financial position maintained • Strengthens commercial lines offering, presence • Improves our ability to outperform the P&C insurance and expertise industry’s ROE by at least 500 bps per year • Expands geographic footprint • Accretive to book value per share • Enhances strength of multi-channel distribution • Optimal deployment of our excess capital • Greater stability of earnings • Capital ratio remains strong with MCT of 200% • Increases bench strength of executive team 1 Internal Rate of Return, based on equity returns. 2 NOIPS = net operating income per share. A non-IFRS measure. Accretion based on consensus estimate of $4.78. 3 Excluding non-recurring restructuring costs. 11
  • 12.
    Leading position… Top 10 Canadian P&C insurance 6.5 companies by 2010 direct premiums written ($ billions) 3.3 2.4 2.4 2.3 2.0 2.0 1.9 1.7 1.6 PF Intact + Aviva TD RSA Co-operators AXA Wawanesa State Farm Economical Desjardins AXA Assurance Rank 1 2 3 4 5 6 7 8 9 10 Share 16.5% 8.4% 6.1% 6.0% 5.9% 5.1% 5.1% 5.0% 4.3% 4.2% Segmentation and claims management capabilities enhanced by increased scale Source: MSA Research for the 12 months ended December 31, 2010. Each insurers’ market share listed above includes all subsidiary entities consolidated under the parent company. Data excludes Lloyd’s, ICBC, SGI, SAF, MPI and Genworth. RSA includes GCAN. 12
  • 13.
    …Leading performance Return on equity (2010) Combined ratio (2010) Intact pro forma 14.9% Intact pro forma 94.8% Top 20 adjusted* 3.2% Top 20 adjusted* 105.0% Outperformance 11.7% Outperformance 10.2% *Excludes AXA *Excludes AXA Expands our outperformance versus the Top 20 P&C insurance industry benchmark1 Source: MSA Research for the 12 months ended December 31, 2010. Data excludes Lloyd’s and Genworth. 1 Top 20 P&C insurance industry benchmark is made up of the top 20 Canadian P&C insurers excluding Intact. Metrics are measured on an equity size-weighted basis. 13
  • 14.
    AXA Canada: Expandingour expertise − Offers a range of P&C and Life & Health insurance products through its relationships with 1,300 insurance brokers and 2,700 independent insurance advisors − The sixth largest P&C insurer in Canada with a 5.1% share in 2010 − Strong presence in provinces of Quebec, Ontario and British Columbia − Significant expertise in commercial lines 2010 P&C DPW by class of insurance 2010 P&C DPW by geography Atlantic Canada Other2 Other 1 Personal auto Commerical auto 7% 1% Quebec 7% 38% Alberta 7% 43% Liability 11% 12% British Columbia 11% Commercial property 18% Personal property Ontario 19% 27% Total 2010 P&C Direct premiums written = $2.0 billion 1 Other (7%) includes Surety (3%), Marine (2%), Boiler (1%), Aircraft (0.3%), A&S (0.3%), and Fidelity (0.2%). 2 Other (1%) includes the Prairies (1.0%) and the Territories (0.3%). Source: MSA Research for the 12 months ended December 31, 2010; AXA Canada. 14
  • 15.
    IFC + AXA:A winning combination • Greater earnings stability as a result of increased diversification: ‒ Higher exposure to commercial lines accomplishes an important strategic objective ‒ Less reliance on personal automobile insurance ‒ Improves geographic footprint in underrepresented areas (Quebec, British Columbia) Pro forma segmenation Pro forma segmentation by business line by geography IFC AXA Pro forma IFC AXA Pro forma Personal Auto 50% 38% 46% Ontario 46% 27% 41% Personal Property 24% 19% 22% Quebec 25% 43% 30% Commercial Auto 7% 7% 7% Alberta 18% 11% 16% Commercial P&C 19% 36% 25% British Columbia 5% 11% 7% Total 100% 100% 100% Atlantic Canada 4% 7% 5% Other 2% 1% 1% Total 100% 100% 100% Source: MSA Research for the 12 months ended December 31, 2010; AXA Canada. As measured by direct premiums written. 15
  • 16.
    IFC + AXA:Building a world-class P&C insurer Strong strategic fit: combining sophisticated underwriting and claims management, while enhancing our multi-channel distribution • Increased scale advantage bolsters our risk selection and claims management capabilities • Enhanced commercial lines mid-market offering, presence and expertise • Expanded geographic footprint in underrepresented areas • Improved ability to outperform the P&C insurance industry’s ROE by 500 bps per year Unique opportunity to combine two best-in-class operators in a financially compelling manner • Estimated internal rate of return of 20% • Expected annual accretion to operating earnings per share of 15% in the mid-term • Operational synergies in excess of $100 million (after-tax) expected annually 16
  • 17.
    AXA Canada: acquisitionon-track • Integration planning process initiated immediately following the announcement • Numerous task forces established, comprised of employees from both IFC and AXA, charged with: − Reviewing activities, processes and systems of both companies − Identifying potential synergies − Developing appropriate action plans • Acquisition expected to close in the fall, once all regulatory approvals are received • Targeting to begin the integration of AXA business on our platform before year-end 17
  • 18.
    AXA Canada: acquisitionfinancing in place Original structure $1,300 million financing Funding from excess capital $500 million Proceeds from subscription receipts $800 million Acquisition credit facilities $1,300 million Term loan $300 million $2,600 million Preferred shares $500 million 10-yr medium-term notes $300 million 50-yr notes private placement $100 million After over allotment Completed $1,200 million Funding from excess capital $377 million Proceeds from subscription receipts (1) $923 million Remaining Acquisition credit facilities $1,300 million Medium-term notes up to $100 million $2,600 million (1) Net of underwriters commission 18
  • 19.
  • 20.
    P&C insurance isa $40 billion market in Canada 3% of GDP in Canada Industry DPW by line of business Home Commercial • Fragmented market1: insurance, P&C, 26.6% 19.0% •Top five represent 43%, versus bank/lifeco markets which are closer to 65-75% •IFC is largest player with 16.5% market share, Commercial versus largest bank/lifeco with 22-25% other, 8.4% market share •P&C insurance shares the same regulator as the banks and lifecos Automobile, 46.0% • Barriers to entry: scale, regulation, manufacturing capability, market knowledge Industry – premiums by province • Home and commercial insurance rates unregulated; personal auto rates regulated in Alberta, 16% some provinces Quebec, 17% British • Capital is regulated nationally by OSFI Columbia, 9% • Brokers continue to own commercial lines and a Eastern large share of personal lines in Canada; direct-to- Provinces & consumer channel is growing (distribution = Territories, 7% brokers 67% and direct 33%) • 30-year return on equity for the industry is Prairies, 3% approximately 10% Ontario, 48% 1 Pro forma IFC’s acquisition of AXA Canada Industry data source: MSA Research excluding Lloyd’s, ICBC, SAF, SGI, MPI and Genworth. OSFI = Office of the Superintendent of Financial Institutions Canada 20 Data as at the end of 2010.
  • 21.
    Economic uncertainties willaffect industry profitability • Slow global recovery with significant The Canadian P&C industry can no longer downside risks count on high investment income • Continued volatility in financial, currency and commodity markets 14% • Financial systems still somewhat 12% vulnerable to downside shocks 10% • Uncertainties will put pressure on 8% P&C Industry profitability financial institutions’ capital 6% 3-5 year worldwide Government of 4% • Interest rates to remain low for the Canada bond yield 2% next 18 to 24 months 0% • A drop of 1% in investment income is 1989 1992 1995 1998 2001 2004 2007 2010 equivalent to a 2 to 3 point increase in Source: Insurance Bureau of Canada the combined ratio 21
  • 22.
    P&C industry 10-yearperformance versus IFC IFC’s competitive advantages Combined ratio 115% • Significant scale advantage Industry1 • Sophisticated pricing and underwriting discipline 105% 10-year avg. = 99.0% • In-house claims expertise 95% • Broker relationships 10-year avg. • Solid investment returns 85% = 95.3% • Strong organic growth potential 75% 01 02 03 04 05 06 07 08 09 10 20 20 20 20 20 20 20 20 20 20 Return on equity Direct premiums written growth 40% 240 220 10-year avg. 30% = 8.6% 200 10-year avg. 180 Industry1 20% = 17.6%2 10-year avg. 160 = 6.7% 10% Industry 140 10-year avg.1 120 0% = 9.9% 100 1 2 3 4 5 6 7 8 9 0 0 0 0 0 0 0 0 0 0 1 01 02 03 04 05 06 07 08 09 10 20 20 20 20 20 20 20 20 20 20 20 20 20 20 20 20 20 20 20 20 Year 2000 = base 100 1Industry data source: MSA Research. excluded Lloyd’s, ICBC, SGI, SAF, MPI and Genworth. All data up to the end of 2010. 2ROE is for Intact’s P&C insurance subsidiaries 22
  • 23.
    Historical financials IFRS Canadian GAAP (in $ millions, except as otherwise noted) 2010 2009 2008 2007 2006 Income statement highlights Direct written premiums $4,498 $4,275 $4,146 $4,109 $3,994 Underwriting income 194 54 117 189 404 Net operating income 402 282 361 457 531 Net operating income per share (in dollars) 3.50 2.35 2.96 3.61 3.97 Balance sheet highlights Total investments $8,653 $8,057 $6,605 $7,231 $7,353 Debt 496 398 - - - Total shareholders' equity (excl. AOCI) 2,686 3,047 3,079 3,290 3,421 Performance metrics Loss ratio 65.4% 70.0% 68.2% 66.2% 59.1% Expense ratio 30.0% 28.7% 28.9% 29.0% 30.3% Combined ratio 95.4% 98.7% 97.1% 95.2% 89.4% Net operating ROE (excl. AOCI) 15.0% 9.2% 11.3% 13.6% 16.8% Debt / Capital 14.3% 11.8% - - - Combined ratios by line of business Personal auto 98.1% 94.9% 95.9% 94.5% 87.3% Personal property 96.5% 109.0% 113.6% 102.2% 100.0% Commercial auto 86.0% 79.8% 87.2% 93.7% 86.9% Commercial P&C 90.7% 104.1% 85.3% 90.1% 85.2% 23
  • 24.
    Strategic capital management •Strong capital base has allowed us to pursue our growth objectives while returning capital to shareholders Quarterly dividend Capital priorities 8.8% 6.3% 3.2% • Acquisitions 0.40 14.8% $0.370 $0.340 • Dividends 0.35 8.0% $0.310 $0.320 0.30 53.8% • Share buybacks $0.250 $0.270 0.25 0.20 Share buyback history $0.1625 0.15 0.10 • 2011 – Board authorized renewal 0.05 of NCIB for an additional 5% - • 2010* – Repurchased 9.7 million 2005 2006 2007 2008 2009 2010 2011 shares for a total of $433 million • 2008 – Repurchased 4.6 million shares for a total of $176 million • 2007 – Completed a $500 million Substantial Issuer Bid * Feb. 22, 2010 – Feb. 21, 2011 24
  • 25.
    Cash and investedassets Asset class Fixed income Preferred shares Corporate 34.3% Perpetual and callable floating 50.3% Federal government and agency 28.2% and reset Cdn. Provincial and municipal 28.2% Fixed perpetual 32.5% Supranational and foreign 7.2% Fixed callable 17.2% ABS/MBS 2.0% TOTAL 100% Private placements 0.1% TOTAL 100% Quality: 100% Canadian Approx. 79.9% rated P1 or P2 Canadian 89% United States 1% Int’l (excl. U.S.) 10% Common shares TOTAL 100% Quality: 99.2% of bonds rated A or better High-quality, dividend paying Canadian 100% Canadian companies. Objective is to capture non- taxable dividend income As of June 30, 2011 25
  • 26.
    Long-term track recordof prudent reserving practices Rate of claims reserve development • Quarterly and annual (favourable prior year development as a % of opening reserves) fluctuations in reserve 9% development are normal 7.9% 8% • 2005/2006 reserve development 7% was unusually high due to the 6% 4.9% 4.8% favourable effects of certain auto 5% 4.0% insurance reforms introduced 4% 3.3% 3.2% 2.9% during that time period 3% 2% • This reflects our preference to 1% take a conservative approach to 0% managing claims reserves 2004 2005 2006 2007 2008 2009 2010 Historical long-term average has been 3% to 4% per year 26
  • 27.
    Experienced and unitedleadership team Years In Years With Industry IFC Brindamour, Charles President & CEO 18 18 Beaulieu, Martin SVP, Personal Lines 23 23 Black, Susan SVP, Chief HR Officer 3 3 Blair, Alan SVP, Atlantic Canada 27 27 Coull-Cicchini, Debbie SVP, Ontario 6 6 Désilets, Claude Chief Risk Officer 29 21 Gagnon, Louis President, Intact Insurance 18 4 Garneau, Denis SVP, Quebec 22 8 Guénette, Françoise SVP, Corporate & Legal Services 22 13 Guertin, Denis President, Direct to Consumers Distribution 26 26 Hindle, Byron SVP, Commercial Lines 32 10 Iles, Derek SVP, Western Canada 38 20 Lincoln, David SVP, Corporate Audit Services (Canada) 32 14 Ott, Jack SVP, Chief Information Officer 29 14 Pontbriand, Marc Executive Vice President 13 13 Provost, Marc SVP & Managing Director IIM and Chief Investment Officer 27 13 Tullis, Mark Chief Financial Officer 32 12 Weightman, Peter President, BrokerLink 24 24 27
  • 28.
    Investor Relations contactinformation Dennis Westfall Director, Investor Relations Phone: 416.341.1464 ext 45122 Cell: 416.797.7828 Email: Dennis.Westfall@intact.net Email: ir@intact.net Phone: 416. 941.5336 or 1.866.778.0774 (toll-free within North America) Fax: 416.941.0006 www.intactfc.com/Investor Relations 28
  • 29.
    Forward-looking statements anddisclaimer Certain of the statements included in this presentation about the Company’s current and future plans, expectations and intentions, results, levels of activity, performance, goals or achievements or any other future events or developments constitute forward-looking statements. The words “may”, “will”, “would”, “should”, “could”, “expects”, “plans”, “intends”, “trends”, “indications"," anticipates”, “believes”, “estimates”, “predicts”, “likely”, “potential” or the negative or other variations of these words or other similar or comparable words or phrases, are intended to identify forward-looking statements. Forward-looking statements are based on estimates and assumptions made by management based on management’s experience and perception of historical trends, current conditions and expected future developments, as well as other factors that management believes are appropriate in the circumstances. Many factors could cause the Company’s actual results, performance or achievements or future events or developments to differ materially from those expressed or implied by the forward-looking statements, including, without limitation, the following factors: the Company’s ability to implement its strategy or operate its business as management currently expects; its ability to accurately assess the risks associated with the insurance policies that the Company writes; unfavourable capital market developments or other factors which may affect the Company’s investments and funding obligations under its pension plans; the cyclical nature of the P&C insurance industry; management’s ability to accurately predict future claims frequency; government regulations designed to protect policyholders and creditors rather than investors; litigation and regulatory actions; periodic negative publicity regarding the insurance industry; intense competition; the Company’s reliance on brokers and third parties to sell its products to clients; the Company’s ability to successfully pursue its acquisition strategy; the Company’s ability to execute its business strategy; the terms and conditions of, and regulatory approvals relating to, the Acquisition of AXA Canada by the company (the “Acquisition”); timing for completion of the Acquisition; synergies arising from, and the Company’s integration plans relating to the Acquisition; the Company’s financing plans for the Acquisition; management's estimates and expectations in relation to resulting accretion, internal rate of return and debt to capital position at closing of the Acquisition and thereafter, as applicable; various other actions to be taken or requirements to be met in connection with the Acquisition and integrating the Company and AXA Canada after completion of the Acquisition; the Company’s participation in the Facility Association (a mandatory pooling arrangement among all industry participants) and similar mandated risk-sharing pools; terrorist attacks and ensuing events; the occurrence of catastrophic events; the Company’s ability to maintain its financial strength ratings; the Company’s ability to alleviate risk through reinsurance; the Company’s ability to successfully manage credit risk (including credit risk related to the financial health of reinsurers); the Company’s reliance on information technology and telecommunications systems; the Company’s dependence on key employees; general economic, financial and political conditions; the Company’s dependence on the results of operations of its subsidiaries; the volatility of the stock market and other factors affecting the Company’s share price; and future sales of a substantial number of its common shares. 29
  • 30.
    Forward-looking statements anddisclaimer All of the forward-looking statements included in this presentation are qualified by these cautionary statements and those made in the “Risk Management” section of our MD&A for the year ended December 31, 2010. These factors are not intended to represent a complete list of the factors that could affect the Company. These factors should, however, be considered carefully. Although the forward-looking statements are based upon what management believes to be reasonable assumptions, the Company cannot assure investors that actual results will be consistent with these forward looking statements. When relying on forward-looking statements to make decisions, investors should ensure the preceding information is carefully considered. Undue reliance should not be placed on forward-looking statements made herein. The Company and management have no intention and undertake no obligation to update or revise any forward-looking statements, whether as a result of new information, future events or otherwise, except as required by law. Important Notes:  All references to direct premiums written in this document exclude industry pools, unless otherwise noted.  All references to “excess capital” in this document include excess capital in the P&C insurance subsidiaries at 170% minimum capital test (“MCT”) plus liquid assets in the holding company, unless otherwise noted.  Catastrophe claims are any one claim, or group of claims, equal to or greater than $5.0 million, related to a single event.  All underwriting results and related ratios exclude the Market Yield Adjustment (“MYA”), except if noted otherwise. Disclaimer The Company uses both International Financial Reporting Standards (“IFRS”) and certain non-IFRS measures to assess performance. Non-IFRS measures do not have any standardized meaning prescribed by IFRS and are unlikely to be comparable to any similar measures presented by other companies. Management of Intact Financial Corporation analyzes performance based on underwriting ratios such as combined, general expenses and claims ratios as well as other performance measures such as return on equity (“ROE”) and operating return on equity. These measures and other insurance related terms are defined in the Company’s glossary available on the Intact Financial Corporation web site at www.intactfc.net in the “Investor Relations” section. Additional information about Intact Financial Corporation, including the Annual Information Form, may be found online on SEDAR at www.sedar.com. 30