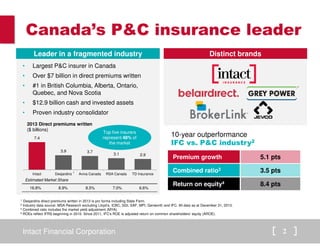
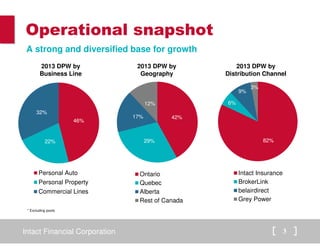
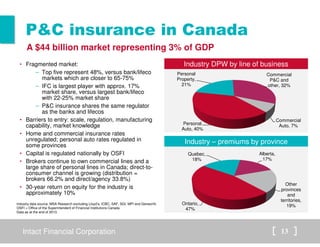
- Intact Financial Corporation is Canada's largest property and casualty insurer with over $7 billion in annual premiums and market leading positions in several Canadian provinces.
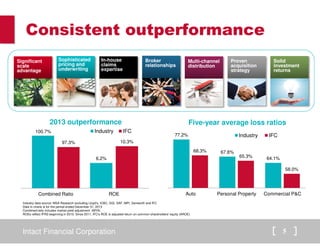
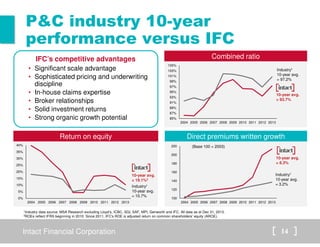
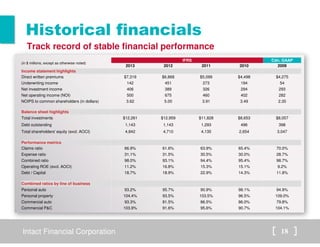
- Intact has consistently outperformed the industry on key metrics like premium growth, combined ratio, and return on equity over the past 10 years due to advantages in scale, underwriting, claims management, and investments.
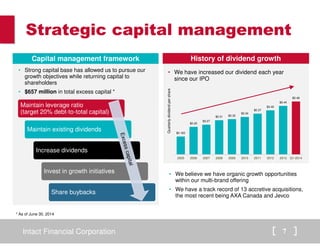
- Intact plans to continue beating industry ROE by 5 points annually through initiatives in pricing, claims management, organic growth, and capital deployment while reinvesting in the customer experience.