Download to read offline


![Background
Neighborhood-based methods
Therefore, many researchers used the approach of counting directly the number of
node immediate neighbors, which give degree centrality [2, 3].
***
Some researchers like [4] Consider community overlapping and network structure
toward identifying influential node in a network.
***
Burt el al. [5] used network constrain coefficient to measure the constraint imposed by
forming a structure hole.
6
6/13/2024
School of Software](https://image.slidesharecdn.com/ppt-240613082127-a624bb5b/85/Identifying-Most-Powerful-Node-In-Complex-Networks-A-Triangle-Graph-Decomposition-Approach-6-320.jpg)
![Background
Path-based methods
The node that can spread information faster is more important, which can be identified
by the path of propagation [6] such as betweenness centrality and Closeness
centrality.
***
Generally speaking node with largest Closeness centrality: has the strongest control
over the information flow. Meanwhile node with smallest closeness centrality is the
best for information flow.
***
In [7] Katz introduced a measure of centrality known as Katz centrality which
computed influence by taking into consideration the number of walks between a
pair of nodes.
7
6/13/2024
School of Software](https://image.slidesharecdn.com/ppt-240613082127-a624bb5b/85/Identifying-Most-Powerful-Node-In-Complex-Networks-A-Triangle-Graph-Decomposition-Approach-7-320.jpg)
![Background
Entropy-based methods
Information theory deals with the quantification of information and has been
successfully applied in a wide range of fields. [9]
Motivated by the original work owing to Shannon [9, 10], first studied the relations
between the topological properties of graphs and their information content and
introduced the concept of graph entropy.
8
6/13/2024
School of Software](https://image.slidesharecdn.com/ppt-240613082127-a624bb5b/85/Identifying-Most-Powerful-Node-In-Complex-Networks-A-Triangle-Graph-Decomposition-Approach-8-320.jpg)


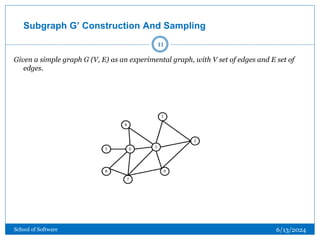
![Subgraph G’ Construction And Sampling
Let take node 1 and node 9 as example.
[a] [b]
Figure [a] represent the sub-graph constructed by node 1 and [b] represent sub-graph
constructed by node 9.
12
6/13/2024
School of Software](https://image.slidesharecdn.com/ppt-240613082127-a624bb5b/85/Identifying-Most-Powerful-Node-In-Complex-Networks-A-Triangle-Graph-Decomposition-Approach-12-320.jpg)


![Definition 1 : Node Entropy(PI)
[19] defined an information functional based on degree powers of graphs. In this
research, an approach is adopted [6] to get the tuple by using degree centrality. The
adopted equation below is an information functional based which reflect the degree
power of graph gives:
(6)
(7)
17
6/13/2024
School of Software](https://image.slidesharecdn.com/ppt-240613082127-a624bb5b/85/Identifying-Most-Powerful-Node-In-Complex-Networks-A-Triangle-Graph-Decomposition-Approach-17-320.jpg)
![Definition 3: Node Constraint(CC)
Assume that network subgraph of graph G is an undirected network with nodes and edges.
The edge between node vi and vj is eij. And it importance is defining [20] as:
Where
U- reflect the connection ability of edge eij. ki and kj are the degree of node vi and vj.
P- represents the number of triangle where edge eij is part of
The alternative index of edge eij is define as:
(10)
(11)
18
6/13/2024
School of Software](https://image.slidesharecdn.com/ppt-240613082127-a624bb5b/85/Identifying-Most-Powerful-Node-In-Complex-Networks-A-Triangle-Graph-Decomposition-Approach-18-320.jpg)
![Definition 3: Node Constraint(CC)
To calculate the constraint coefficient with respect to each relationship in the network graph. By
adopting Burt el al [4, 5] measure of structural holes. We can sum of each connection's constraints
Cij which is define as:
Pij is the proportion of edge weights from i to j which define as:
Where EIij measure the edge between i and j.
Assume there exists an indirect path , then the product of proportion of edge weights between i to q,
and q to j will be the total amount of indirect influence from i to j.
(12)
(13)
19
6/13/2024
School of Software](https://image.slidesharecdn.com/ppt-240613082127-a624bb5b/85/Identifying-Most-Powerful-Node-In-Complex-Networks-A-Triangle-Graph-Decomposition-Approach-19-320.jpg)


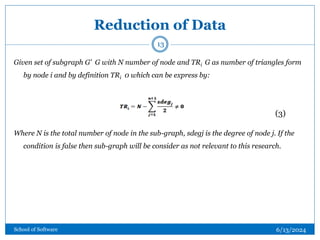
This research proposal aims to develop an improved method for identifying the most influential nodes in complex networks by decomposing graphs into subgraphs and utilizing various measures to rank node power. It incorporates entropy theory and examines relationships between nodes, specifically focusing on triangles formed in the network to establish influence and control. The findings suggest that a comprehensive approach combining multiple measures is more effective for understanding node importance and influence propagation.


![240729_Thuy_Labseminar[Substructure Aware Graph Neural Networks].pptx](https://cdn.slidesharecdn.com/ss_thumbnails/240729thuylabseminar-240806102643-9d729e23-thumbnail.jpg?width=640&height=640&fit=bounds)


![[IRTalks@The University of Glasgow] A Topology-aware Analysis of Graph Collab...](https://cdn.slidesharecdn.com/ss_thumbnails/irtalksdanielemalitesta-240213122149-51207659-thumbnail.jpg?width=640&height=640&fit=bounds)


![[DSC Europe 25] Nikola Vasiljevic - Player segmentation by combat playstyles ...](https://cdn.slidesharecdn.com/ss_thumbnails/mnvbf0yvrwaqsipzrrv3-2-nikola-vasiljevic-player-segmentation-by-playstyles-in-action-shooter-games-260114111931-b4d766cd-thumbnail.jpg?width=640&height=640&fit=bounds)

![[DSC Europe 25] Danilo Djukanovic - From Vibes to KPIs: Turning Culture Into ...](https://cdn.slidesharecdn.com/ss_thumbnails/inqestws5wf0cik2glgv-3-danilo-djukanovic-from-vibes-to-kpis-presentation-260114111931-dacff81f-thumbnail.jpg?width=640&height=640&fit=bounds)


![[DSC Europe 25] Elena Menshikova - AI-Powered Operational Excellence: Revolut...](https://cdn.slidesharecdn.com/ss_thumbnails/es6nholbqy3zaao2c2yd-2-elena-menshikova-data-ai-in-decision-making-260115093812-4fba8b38-thumbnail.jpg?width=640&height=640&fit=bounds)

![[DSC Europe 25] Ivica Milaric - The Future of Gaming and AI Tools.pptx](https://cdn.slidesharecdn.com/ss_thumbnails/tijgzsmgse2kj2y5pzzp-5-ivica-milaric-the-future-of-gaming-x-ai-tools-260114111931-87c2b3ac-thumbnail.jpg?width=640&height=640&fit=bounds)


![[DSC Europe 25] Ivan Lukovic & Marija Djukic - From Data to Value: Why Maturi...](https://cdn.slidesharecdn.com/ss_thumbnails/ahrfps8xr6knowwhacxh-1-ivan-marija-dsc-2025-ld-v1-presentation-260115093812-be21adfc-thumbnail.jpg?width=640&height=640&fit=bounds)