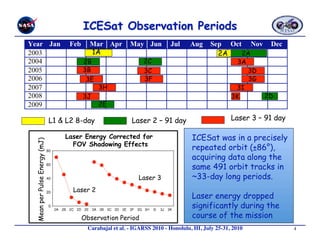
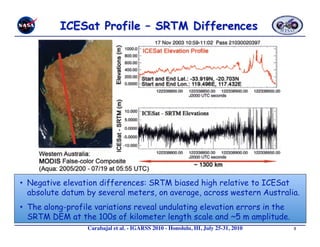
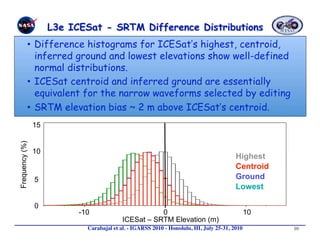
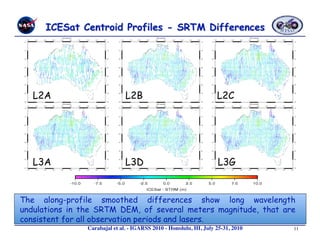
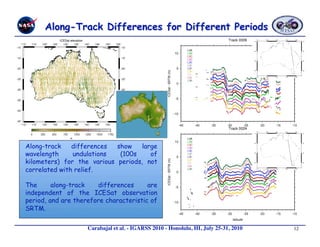
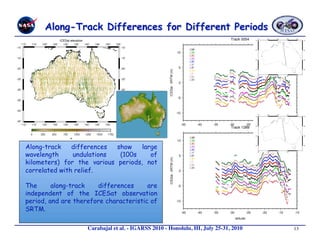
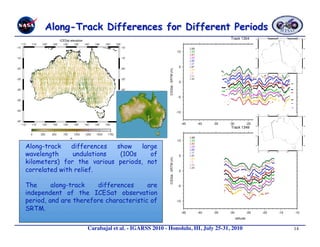
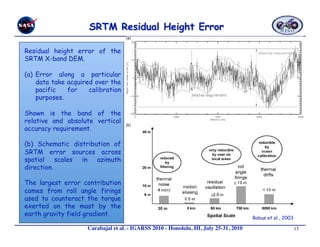
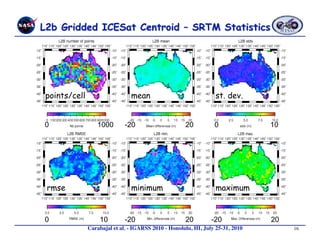
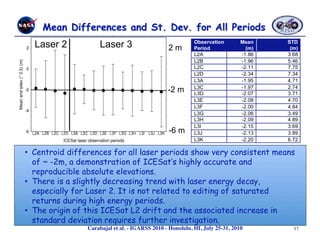
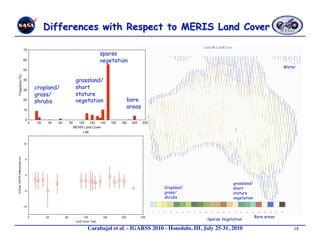
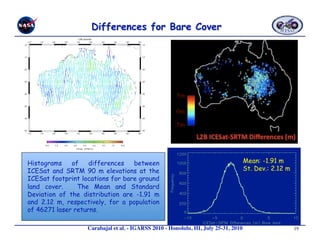
The document summarizes research analyzing differences between elevations measured by the ICESat satellite laser altimeter and the Shuttle Radar Topography Mission (SRTM) digital elevation model over Australia. The analysis found a mean elevation difference of approximately -2 meters, with SRTM biased high relative to ICESat. It also revealed undulating elevation errors in SRTM at the 100s of km scale. The differences were reproducible across ICESat observation periods, indicating they were characteristic of SRTM rather than ICESat.
Pixel Classification of SAR ice images using ANFIS-PSO Classifierijeei-iaes
Synthetic Aperture Radar (SAR) is playing a vital role in taking extremely high resolution radar images. It is greatly used to monitor the ice covered ocean regions. Sea monitoring is important for various purposes which includes global climate systems and ship navigation. Classification on the ice infested area gives important features which will be further useful for various monitoring process around the ice regions. Main objective of this paper is to classify the SAR ice image that helps in identifying the regions around the ice infested areas. In this paper three stages are considered in classification of SAR ice images. It starts with preprocessing in which the speckled SAR ice images are denoised using various speckle removal filters; comparison is made on all these filters to find the best filter in speckle removal. Second stage includes segmentation in which different regions are segmented using K-means and watershed segmentation algorithms; comparison is made between these two algorithms to find the best in segmenting SAR ice images. The last stage includes pixel based classification which identifies and classifies the segmented regions using various supervised learning classifiers. The algorithms includes Back propagation neural networks (BPN), Fuzzy Classifier, Adaptive Neuro Fuzzy Inference Classifier (ANFIS) classifier and proposed ANFIS with Particle Swarm Optimization (PSO) classifier; comparison is made on all these classifiers to propose which classifier is best suitable for classifying the SAR ice image. Various evaluation metrics are performed separately at all these three stages.
Discovery of rotational modulations in the planetary mass companion 2m1207b i...Sérgio Sacani
Rotational modulations of brown dwarfs have recently provided powerful constraints on the properties
of ultra-cool atmospheres, including longitudinal and vertical cloud structures and cloud evolution.
Furthermore, periodic light curves directly probe the rotational periods of ultra-cool objects. We
present here, for the first time, time-resolved high-precision photometric measurements of a planetarymass
companion, 2M1207b. We observed the binary system with HST/WFC3 in two bands and with
two spacecraft roll angles. Using point spread function-based photometry, we reach a nearly photonnoise
limited accuracy for both the primary and the secondary. While the primary is consistent with
a flat light curve, the secondary shows modulations that are clearly detected in the combined light
curve as well as in di↵erent subsets of the data. The amplitudes are 1.36% in the F125W and 0.78%
in the F160W filters, respectively. By fitting sine waves to the light curves, we find a consistent period
of 10.7+1.2
−0.6 hours and similar phases in both bands. The J- and H-band amplitude ratio of 2M1207b
is very similar to a field brown dwarf that has identical spectral type but di↵erent J-H color. Importantly,
our study also measures, for the first time, the rotation period for a directly imaged extra-solar
planetary-mass companion.
Developments and directions in 3D mapping of mineral systems using geophysicsRichard Lane
(See Geoscience Australia website - https://www.ga.gov.au/products/servlet/controller?event=GEOCAT_DETAILS&catno=70386 ). “Developments and directions in 3D mapping of mineral systems using geophysics” by Richard Lane (Geoscience Australia, richard.lane@ga.gov.au). Presented at “Science at the Surveys” (Melbourne, Victoria, Australia, 22 March 2010). The primary author would like to acknowledge the assistance of many people who have provided material and thoughts for this presentation, with special mention of Richard Chopping, Marina Costelloe, David Hutchinson, Nick Williams, and Lesley Wyborn. This presentation material will be included in a lecture that will be given in various South Pacific locations during 2011 as part of the Society of Exploration Geophysicists “Honorary Lecture Program” sponsored by Shell (http://www.seg.org/).
Carbon Stocks Estimation in South East Sulawesi Tropical Forest, Indonesia, u...ijceronline
This paper was aimed to estimate carbon stocks in South East Sulawesi tropical forest, Indonesia, using Polarimetric Interferometry Synthetic Aperture Radar (PolInSAR). Two coherence Synthetic Aperture Radar (SAR) images of ALOS PALSAR full-polarimetric were used in this research. The research method is forming Random Volume over Ground (RVoG) model from interferometric phase coherence of two Full-Polarimetric ALOS PALSAR which temporal baseline is 46 days. Due to temporal decorrelation, coherence optimization was conducted to produce image with optimum coherences. The result showed that the RVoG forest height and carbon stocks which obtained from height inversion has a positive correlation with ground measurement.
A 50000 solar_mass_black_hole_in_the_nucleous_of_rgg_118Sérgio Sacani
Astrônomos usando o Observatório de Raios-X Chandra da NASA e o Telescópio Clay de 6.5 metros no Chile, identificaram o menor buraco negro supermassivo já detectado no centro de uma galáxia. Esse objeto paradoxal poderia fornecer pistas sobre qual o tamanho de buracos negros formados juntos com suas galáxias hospedeiras a 13 bilhões de anos atrás, ou mais.
Os astrônomos estimam que esse buraco negro supermassivo tem cerca de 50000 vezes a massa do Sol. Isso é menos da metade do buraco negro anterior de menor massa encontrado no centro de uma galáxia.
O buraco negro está localizado no centro do disco da galáxia anã, chamada de RGG 118, localizada a cerca de 340 milhões de anos-luz de distância da Terra. A imagem principal desse post, foi feita pelo Sloan Digital Sky Survey e o detalhe mostra uma imagem feita pelo Chandra do centro da galáxia. A fonte pontual de raios-X, é produzida pelo gás quente que faz um movimento de redemoinho ao redor do buraco negro.
Os pesquisadores estimaram a massa do buraco negro estudando o movimento do gás frio perto do centro da galáxia, usando dados na luz visível obtidos pelo Telescópio Clay. Eles usaram os dados do Chandra para descobrir o brilho em raios-X do gás quente espiralando na direção do buraco negro. Eles encontraram que a força de empurrão da pressão da radiação desse gás quente é equivalente a cerca de 1% da força de puxão da gravidade interna, o que se ajusta bem com as propriedades de outros buracos negros supermassivos.
Anteriormente, uma relação tinha sido notada entre a massa dos buracos negros supermassivos e o intervalo de velocidades das estrelas no centro da galáxia hospedeira. Essa relação também é mantida para a RGG 118 e seu buraco negro.
O buraco negro na RGG 118 é cerca de 100 vezes menos massivo do que o buraco negro supermassivo encontrado no centro da Via Láctea. Ele é também cerca de 200000 vezes menos massivo do que o buraco negro mais massivo já encontrado no centro de outras galáxias.
Os astrônomos estão tentando entender a formação de buracos negros com bilhões de vezes a massa solar que têm sido detectados a menos de um bilhão de anos depois do Big Bang. O buraco negro na RGG 118 dá aos astrônomos uma oportunidade de estudar um buraco negro supermassivo, pequeno e próximo, pertencente à primeira geração de buracos negros que não são detectáveis pela nossa tecnologia atual.
Os astrônomos acreditam que buracos negros supermassivos podem se formar quando grandes nuvens de gás, com uma massa entre 10000 e 100000 vezes a massa do Sol, colapsa num buraco negro. Muitos desses buracos negros semeiam então fusões para formar buracos negros supermassivos ainda maiores. De maneira alternativa, um buraco negro supermassivo poderia surgir de uma estrela gigante, com cerca de 100 vezes a massa do Sol, que no final da sua vida, depois de consumir todo o seu combustível, colapsa e forma um buraco negro.
Os pesquisadore
IOSR Journal of Applied Physics (IOSR-JAP) is an open access international journal that provides rapid publication (within a month) of articles in all areas of physics and its applications. The journal welcomes publications of high quality papers on theoretical developments and practical applications in applied physics. Original research papers, state-of-the-art reviews, and high quality technical notes are invited for publications.
An Image Analysis Technique to Estimate the Porosity of Rock SamplesIJSRD
This paper discusses the possibilities of determining the porosities of different types of rocks using image analysis technique. Before the use of image analysis stereological research for analysis of porosity were conducted by traditional methods which were time consuming and lacked accuracy. The method proposed in this paper determines the porosity by computing the part of the whole sample for which the pores account. The steps involved in the above method are a series of contextual, non-context and morphological operations that are commonly used in image processing and analysis. The procedure was tested on thin sections of sandstone and limestone rock samples. The results were computed in the form of total porosity which includes all types porosities observed in rocks including isolated and connected porosities. The porosity obtained can also be called as visual porosity. Values obtained show that the method proposed can lead to satisfying results. Obtained porosity values can be used further to determine determine other properties like permeability which play a vital role in the study of diffusion in porous rocks.
Detection of magnetic_fields_in_both_b_type_components_of_epsilon_lupi_system...Sérgio Sacani
Uma equipe de astrônomos detectou um chamado campo magnético fóssil em ambos os componentes de um sistema estelar binário, chamado de Epsilon Lupi.
Epsilon Lupi, também conhecida como HD 136504, é uma estrela binária brilhante, localizada na constelação do hemisfério sul de Lupus.
O par de estrelas está localizado a aproximadamente 500 anos-luz de distância da Terra, e cada estrela tem entre 7 e 8 vezes a massa do Sol, e combinadas, elas têm cerca de 6000 vezes a luminosidade do Sol.
Os astrônomos sabem de muito tempo que a Epsilon Lupi é um sistema binário, mas não tinham ideia de que as duas estrelas pudessem possuir campos magnéticos.
“A origem do magnetismo entre estrelas massivas é um mistério e essa descoberta pode ajudar a trazer uma luz numa questão de por que essas estrelas possuem campos magnéticos”, disse Matt Shultz da Universidade de Queen no Canadá, e o principal autor do artigo aceito para publicação no Monthly Notices of the Royal Astronomical Society e que descreve a descoberta.
A giant galaxy in the young Universe with a massive ringSérgio Sacani
In the local (redshift z ≈ 0) Universe, collisional ring galaxies make up only ~0.01% of galaxies1 and are formed by head-on galactic collisions that trigger radially propagating density waves2–4. These striking systems provide key snapshots for dissecting galactic disks and are studied extensively in the local Universe5–9. However, not much is known about distant (z > 0.1) collisional rings10–14. Here we present a detailed study of a ring galaxy at a look-back time of 10.8 Gyr (z = 2.19). Compared with our Milky Way, this galaxy has a similar stellar mass, but has a stellar half-light radius that is 1.5–2.2 times larger and is forming stars 50 times faster. The extended, dif- fuse stellar light outside the star-forming ring, combined with a radial velocity on the ring and an intruder galaxy nearby, provides evidence for this galaxy hosting a collisional ring. If the ring is secularly evolved15,16, the implied large bar in a giant disk would be inconsistent with the current understand- ing of the earliest formation of barred spirals17–21. Contrary to previous predictions10–12, this work suggests that massive col- lisional rings were as rare 11 Gyr ago as they are today. Our discovery offers a unique pathway for studying density waves in young galaxies, as well as constraining the cosmic evolution of spiral disks and galaxy groups.
lithological discrimination of anorthosite using aster data in oddanchatram areaIJAEMSJORNAL
The present study applies with hyperspectral remote sensing techniques to map the lithology of the Oddanchatram anorthosite. The hyperspectral data were subjected to Principal Component Analysis (PCA), Independent Component Analysis (ICA) and Minimum Noise Fraction (MNF), Pixel Purity Index (PPI) and n-Dimensional Visualization for better lithology mapping. The proposed study area has various typical rock types. The PCA, ICA and MNF have been proposed best band combination for effectiveness of lithological mapping such as PCA (R: G: B=2:1:3), MNF (R: G: B=4:3:2) and ICA (R: G: B=3:1:2). The derived lithological map has compared with published geological map from Geological Survey of India and validated with field investigation. Therefore, ASTER data based lithological mapping are fast, cost-effective and more accurate.
For topographical mission, the airbrone LiDAR technology can collect a huge amount of data and a single survey can easily collect millions of x,y,z points on huge areas with an accuracy between 5 and 20 cm.
Products:
Digital Elevation Model (DEM)
Digital Terrain Model (DTM)
Slopes, contours, TINs, Rasters
Some applications :
Planimetric and slope mapping
Trees or houses height analysis
Images ortho-rectification
Terrain analysis3-D modeling
Floodplain mapping and planning
Disaster management
Coastal erosion
Forestry
Land use mapping and planning
Volumetric studies - 3-D modeling
Electrical lines / pipes corridor mapping
Geology analysis
3D viewing - Anaglyph
Sample :
COTONOU
DUAL-CHANNEL MODEL FOR SHALLOW WATER DEPTH RETRIEVAL FROM WORLDVIEW-3 IMAGERY...Luhur Moekti Prayogo
This research aims to estimate shallow water depth using Worldview 3 satellite imagery and dual-channel models in Karimunjawa waters, Central Java – Indonesia. To build dual-channel models, we used spectral data that had been validated in the field. Twenty-three depth data were recorded synchronous to the spectral data used in forming the semianalytical dual-channel models. Twelve models were tested using 633 depth data with a non-linear model using multiple polynomial regression analysis degrees 1 and 2. This research has shown that the proposed model has been confirmed to improve depth accuracy. Models using blue and green channels of Worldview 3 image result in good accuracies especially for estimating depths with interval from 5 to 20 meters with RMSE of 1,592 meters (5–10 meters), 2,099 meters (10–15 meters), and 1,239 meters (15–20 meters). The wavelengths of two channels have a low absorption rate to penetrate deeper waters than other wavelengths. The research also finds out that there are still models that meet the IHO standard criteria.
The Population of the Galactic Center Filaments: Position Angle Distribution ...Sérgio Sacani
We have examined the distribution of the position angle (PA) of the Galactic center filaments with lengths L > 66″ and
<66″ as well as their length distribution as a function of PA. We find bimodal PA distributions of the filaments, and
long and short populations of radio filaments. Our PA study shows the evidence for a distinct population of short
filaments with PA close to the Galactic plane. Mainly thermal, short-radio filaments (<66″) have PAs concentrated
close to the Galactic plane within 60° < PA < 120°. Remarkably, the short filament PAs are radial with respect to the
Galactic center at l < 0° and extend in the direction toward Sgr A*
. On a smaller scale, the prominent Sgr E H II
complex G358.7-0.0 provides a vivid example of the nearly radial distribution of short filaments. The bimodal PA
distribution suggests a different origin for two distinct filament populations. We argue that the alignment of the shortfilament population results from the ram pressure of a degree-scale outflow from Sgr A* that exceeds the internal
filament pressure, and aligns them along the Galactic plane. The ram pressure is estimated to be 2 × 106 cm−3 K at a
distance of 300 pc, requiring biconical mass outflow rate 10−4 Me yr−1 with an opening angle of ∼40°. This outflow
aligns not only the magnetized filaments along the Galactic plane but also accelerates thermal material associated with
embedded or partially embedded clouds. This places an estimate of ∼6 Myr as the age of the outflow.
In the first part of the talk, we will present a sensitivity analysis of a novel sea ice model. neXtSIM is a continuous Lagrangian numerical model that uses an elastobrittle rheology to simulate the ice response to external forces. The response of the model is evaluated in terms of simulated ice drift distances from its initial position and from the mean position of the ensemble. The simulated ice drift is decomposed into advective and diffusive parts that are characterized separately both spatially and temporally and compared to what is obtained with a free-drift model, i.e. when the ice rheology does not play any role. Overall the large-scale response of neXtSIM is correlated to the ice thickness and the wind velocity fields while the free-drift model response is mostly correlated to the wind velocity pattern only. The seasonal variability of the model sensitivity shows the role of the ice compactness and rheology at both local and Arctic scales. Indeed, the ice drift simulated by neXtSIM in summer is close to the free-drift model, while the more compact and solid ice pack is showing a significantly different mechanical and drift behavior in winter. In contrast of the free-drift model, neXtSIM reproduces the sea ice Lagrangian diffusion regimes as found from observed trajectories. The forecast capability of neXtSIM is also evaluated using a large set of real buoy’s trajectories. We found that neXtSIM performs better in simulating sea ice drift, both in terms of forecast error and as a tool to assist search-and-rescue operations. Adaptive meshes, as the one used in neXtSIM, are used to model a wide variety of physical phenomena. Some of these models, in particular those of sea ice movement, use a remeshing process to remove and insert mesh points at various points in their evolution. This represents a challenge in developing compatible data assimilation schemes, as the dimension of the state space we wish to estimate can change over time when these remeshings occur.
In the second part of the talk, we highlight the challenges that such a modeling framework represents for data assimilation setup. We then describe a remeshing scheme for an adaptive mesh in one dimension. The development of advanced data assimilation methods that are appropriate for such a moving and remeshed grid is presented. Finally we discuss the extension of these techniques to two-dimensional models, like neXtSIM.
NISAR
NISAR Solid Earth Sciences Algorithm Theoretical Basis and Validation Plan
NASA
National Aeronautics and Space Administration
NASA-ISRO Synthetic Aperture Radar (NISAR)
By
Dr. Pankaj Dhussa
WE2.L09 - ICESAT LIDAR AND GLOBAL DIGITAL ELEVATION MODELS: APPLICATIONS TO DESDYNI
1. Claudia C. Carabajal1,
David J. Harding2,
and Vijay P. Suchdeo1
1 Sigma Space Corp. @ NASA/GSFC – Planetary Geodynamics Laboratory
2NASA/GSFC - Planetary Geodynamics Laboratory
Carabajal et al. - IGARSS 2010 - Honolulu, HI, July 25-31, 2010
2. Globally-distributed Repeated Profiles
Geoscience Laser Altimeter System (GLAS)
Footprint: ~70 m (lasers 1 & 2), ~50 m (laser 3)
Along-track spacing: 170 m
Vertical Precision: 3 cm (flat surfaces)
Vertical Accuracy: ~10 cm (flat surfaces)
Horizontal Accuracy: < 6 m
Primary Objectives
Ice sheet elevation change
Sea ice thickness change
Secondary Objectives
Cloud and aerosol profiles
Geodetic land topography profiles
Forest canopy height sampling
Carabajal et al. - IGARSS 2010 - Honolulu, HI, July 25-31, 2010
2
3. • The high accuracy of the ICESat elevation measurements in
a consistent reference frame provides a unique, globally
distributed Ground Control Point (GCP) data set
Vertical Accuracy: 10 cm (flat surface) Horizontal Accuracy: < 6 m
• Three main applications of ICESat geodetic control are:
Independent assessment of the accuracy of DEMs
defining their random and systematic error characteristics.
Correction of systematic errors in DEMs
improving their utility scientific and applied purposes
including detection of elevation change
Use as ground control points in the production of DEMs
either by stereo photogrammetric or interferometric SAR techniques
Carabajal et al. - IGARSS 2010 - Honolulu, HI, July 25-31, 2010
4. 1A 2A 2A
2B 2C 3A
3B 3C 3D
3E 3F 3G
3H 3I
3J 3K 2D
2E
L1 & L2 8-day Laser 2 – 91 day Laser 3 – 91 day
Laser Energy Corrected for ICESat was in a precisely
Mean per Pulse Energy (mJ)
FOV Shadowing Effects
repeated orbit (±86°),
acquiring data along the
same 491 orbit tracks in
Laser 3 ~33-day long periods.
Laser 2
Laser energy dropped
significantly during the
Observation Period course of the mission
Carabajal et al. - IGARSS 2010 - Honolulu, HI, July 25-31, 2010
4
5. • ICESat Land/Canopy Product (GLA14), Release 31
GLAS waveform-derived elevations
highest detected signal
signal centroid (average)
inferred ground peak
lowest detected signal
Each Laser 2 and 3 month-long observation periods used separately
to assess reproducibility of the results
• SRTM Finished Product
DEM elevation interpolated to laser footprint location, provided on GLA14
geoid corrected to be in ICESat reference frame
Elevation standard deviation (relief) from 3 x 3 cells at footprint location
• ESA’s MERIS Globcover
Global land cover at 300 m resolution (Regional products)
51 land cover classes possible
Carabajal et al. - IGARSS 2010 - Honolulu, HI, July 25-31, 2010
5
6. After Harding & Carabajal, 2005.
Carabajal et al. - IGARSS 2010 - Honolulu, HI, July 25-31, 2010
6
7. Stringent editing applied to identify appropriate returns:
Low within-footprint slope and roughness
Vegetation absent or very low stature
Not impacted by measurement artifacts
• Surface returns not from cloud tops
ICESat - SRTM DEM elevations < 50 m
• Non-saturated returns
Saturation index ≤ 2
• Data acquired near nadir
Incidence angle ≤ 1°
• No potential range delay due to atmospheric forward scattering
When correction available, in the mm range
• No broadened returns from high relief or vegetation cover
Width ≥ 0.5 m and ≤ 5 m
Carabajal et al. - IGARSS 2010 - Honolulu, HI, July 25-31, 2010
7
8. • Negative elevation differences: SRTM biased high relative to ICESat
absolute datum by several meters, on average, across western Australia.
• The along-profile variations reveal undulating elevation errors in the
SRTM DEM at the 100s of kilometer length scale and ~5 m amplitude.
Carabajal et al. - IGARSS 2010 - Honolulu, HI, July 25-31, 2010
8
9. • We quantify differences between ICESat GCP’s and SRTM
along the ICESat ground tracks using a sliding 1 degree box-
car filter.
• We compute average 1 degree gridded ICESat-SRTM
elevation differences.
• We evaluate spatial patterns of mean elevation differences
(biases) and standard deviations (noise component).
• We do this using each ICESat observation period separately,
testing the reproducibility of ICESat elevation
measurements with different laser energies.
• We include topographic relief and land cover information to
establish empirical relationships between ICESat - SRTM
elevation differences with respect terrain characteristics.
Carabajal et al. - IGARSS 2010 - Honolulu, HI, July 25-31, 2010
9
10. • Difference histograms for ICESat’s highest, centroid,
inferred ground and lowest elevations show well-defined
normal distributions.
• ICESat centroid and inferred ground are essentially
equivalent for the narrow waveforms selected by editing
• SRTM elevation bias ~ 2 m above ICESat’s centroid.
15
Frequency (%)
10
Highest
Centroid
5 Ground
Lowest
0
-10 0 10
ICESat – SRTM Elevation (m)
Carabajal et al. - IGARSS 2010 - Honolulu, HI, July 25-31, 2010
10
11. L2A L2B L2C
L3A L3D L3G
The along-profile smoothed differences show long wavelength
undulations in the SRTM DEM, of several meters magnitude, that are
consistent for all observation periods and lasers.
Carabajal et al. - IGARSS 2010 - Honolulu, HI, July 25-31, 2010
11
12. Along-track differences show large
wavelength undulations (100s of
kilometers) for the various periods, not
correlated with relief.
The along-track differences are
independent of the ICESat observation
period, and are therefore characteristic of
SRTM.
Carabajal et al. - IGARSS 2010 - Honolulu, HI, July 25-31, 2010
12
13. Along-track differences show large
wavelength undulations (100s of
kilometers) for the various periods, not
correlated with relief.
The along-track differences are
independent of the ICESat observation
period, and are therefore characteristic of
SRTM.
Carabajal et al. - IGARSS 2010 - Honolulu, HI, July 25-31, 2010
13
14. Along-track differences show large
wavelength undulations (100s of
kilometers) for the various periods, not
correlated with relief.
The along-track differences are
independent of the ICESat observation
period, and are therefore characteristic of
SRTM.
Carabajal et al. - IGARSS 2010 - Honolulu, HI, July 25-31, 2010
14
15. Residual height error of the
SRTM X-band DEM.
(a) Error along a particular
data take acquired over the
pacific for calibration
purposes.
Shown is the band of the
relative and absolute vertical
accuracy requirement.
(b) Schematic distribution of
SRTM error sources across
spatial scales in azimuth
direction.
The largest error contribution
comes from roll angle firings
used to counteract the torque
exerted on the mast by the
earth gravity field gradient.
Rabus et al., 2003
Carabajal et al. - IGARSS 2010 - Honolulu, HI, July 25-31, 2010
15
16. points/cell mean st. dev.
0 1000 -20 20 0 10
rmse minimum maximum
0 10 -20 20 -20 20
Carabajal et al. - IGARSS 2010 - Honolulu, HI, July 25-31, 2010
16
17. Laser 2 Laser 3 2m
-2 m
-6 m
• Centroid differences for all laser periods show very consistent means
of ~ -2m, a demonstration of ICESat’s highly accurate and
reproducible absolute elevations.
• There is a slightly decreasing trend with laser energy decay,
especially for Laser 2. It is not related to editing of saturated
returns during high energy periods.
• The origin of this ICESat L2 drift and the associated increase in
standard deviation requires further investigation.
Carabajal et al. - IGARSS 2010 - Honolulu, HI, July 25-31, 2010
17
18. sparse
vegetation
Water
grassland/
cropland/ short
grass/ stature
shrubs vegetation bare
areas
grassland/
Cropland/ short
grass/ stature
shrubs vegetation
Bare areas
Sparse Vegetation
Carabajal et al. - IGARSS 2010 - Honolulu, HI, July 25-31, 2010
18
19. 5m
0m
-5m
Histograms of differences between Mean: -1.91 m
ICESat and SRTM 90 m elevations at the St. Dev.: 2.12 m
ICESat footprint locations for bare ground
land cover. The Mean and Standard
Deviation of the distribution are -1.91 m
and 2.12 m, respectively, for a population
of 46271 laser returns.
Carabajal et al. - IGARSS 2010 - Honolulu, HI, July 25-31, 2010
19
20. Narrow ICESat Waveforms
L2B (Feb.-Mar., 2003)
Waveforms with narrow
pulse-widths (0 to 5 m), are
consistent with low relief
surfaces having no or only
short-stature vegetation
cover, and are suitable for
use as ground elevation
Waveform Pulse Width (m)
5.0
control points.
4.5
4.0
Approximately 30%-35% of
the data acquired in North
3.5
America fits this criteria
≤3.0
(however, a large fraction
are at higher latitudes
where the ground track
spacing is smaller).
Carabajal et al. - IGARSS 2010 - Honolulu, HI, July 25-31, 2010
20
21. Identify narrow last peaks in broad waveforms that are likely
to be returns from the ground beneath the vegetation to
increase the number of global GCPs.
Use of last peaks as GCPs in vegetated terrain must be restricted to areas of
low topographic relief due to the complex merging of ground and canopy returns
in waveforms from areas moderate to steep relief. (Harding & Carabajal, 2005)
Carabajal et al. - IGARSS 2010 - Honolulu, HI, July 25-31, 2010
21
22. • Using careful editing of ICESat elevation data, we are developing a
Global Geodetic Control database for a variety of Solid Earth
applications.
• Edited data apply to locations of low relief and absent to short
stature vegetation cover (< a few meters).
• As an application of ICESat for Ground Control, we have performed a
comprehensive analysis of the spatial distribution and magnitude of
the ICESat - SRTM differences for Australia.
• A negative mean difference of ~ 2 m (SRTM on average higher than
ICESat) is observed for Australia, but there are regionally correlated
mean differences that vary from about -10m to 5m. These might be
associated with differences in land cover type.
• We have investigated the repeatability of the results for all ICESat
observation periods, exploring possible intra-period instrument/
pointing biases remaining in the ICESat elevation data.
• Identification of ground peaks in broadened waveforms will expand
the number of GCPs for vegetated regions.
Carabajal et al. - IGARSS 2010 - Honolulu, HI, July 25-31, 2010
23. • Methodologies developed to use ICESat data for global geodetic
control purposes are a pathfinder for similar use of the data to be
produced by the Lidar component of the DESDynI mission.
• With substantially improved sampling as compared to ICESat
DESDynI will provide a more comprehensive set of global GCPs
- Multiple beams spaced across track by ~ 1 km
- Smaller footprints (25 m) that are contiguous along track
- Continuous, rather than episodic, operation
• Differencing the densely sampled DESDynI Lidar data through
time with respect to a common DEM should reveal surface elevation
changes at the decimeter level during the course of the mission on
a local to regional (TBD) scales, including for surfaces that are
decorrelated at radar wavelengths
E.G. seasonal snow accumulation; soil loss in agricultural regions
Carabajal et al. - IGARSS 2010 - Honolulu, HI, July 25-31, 2010