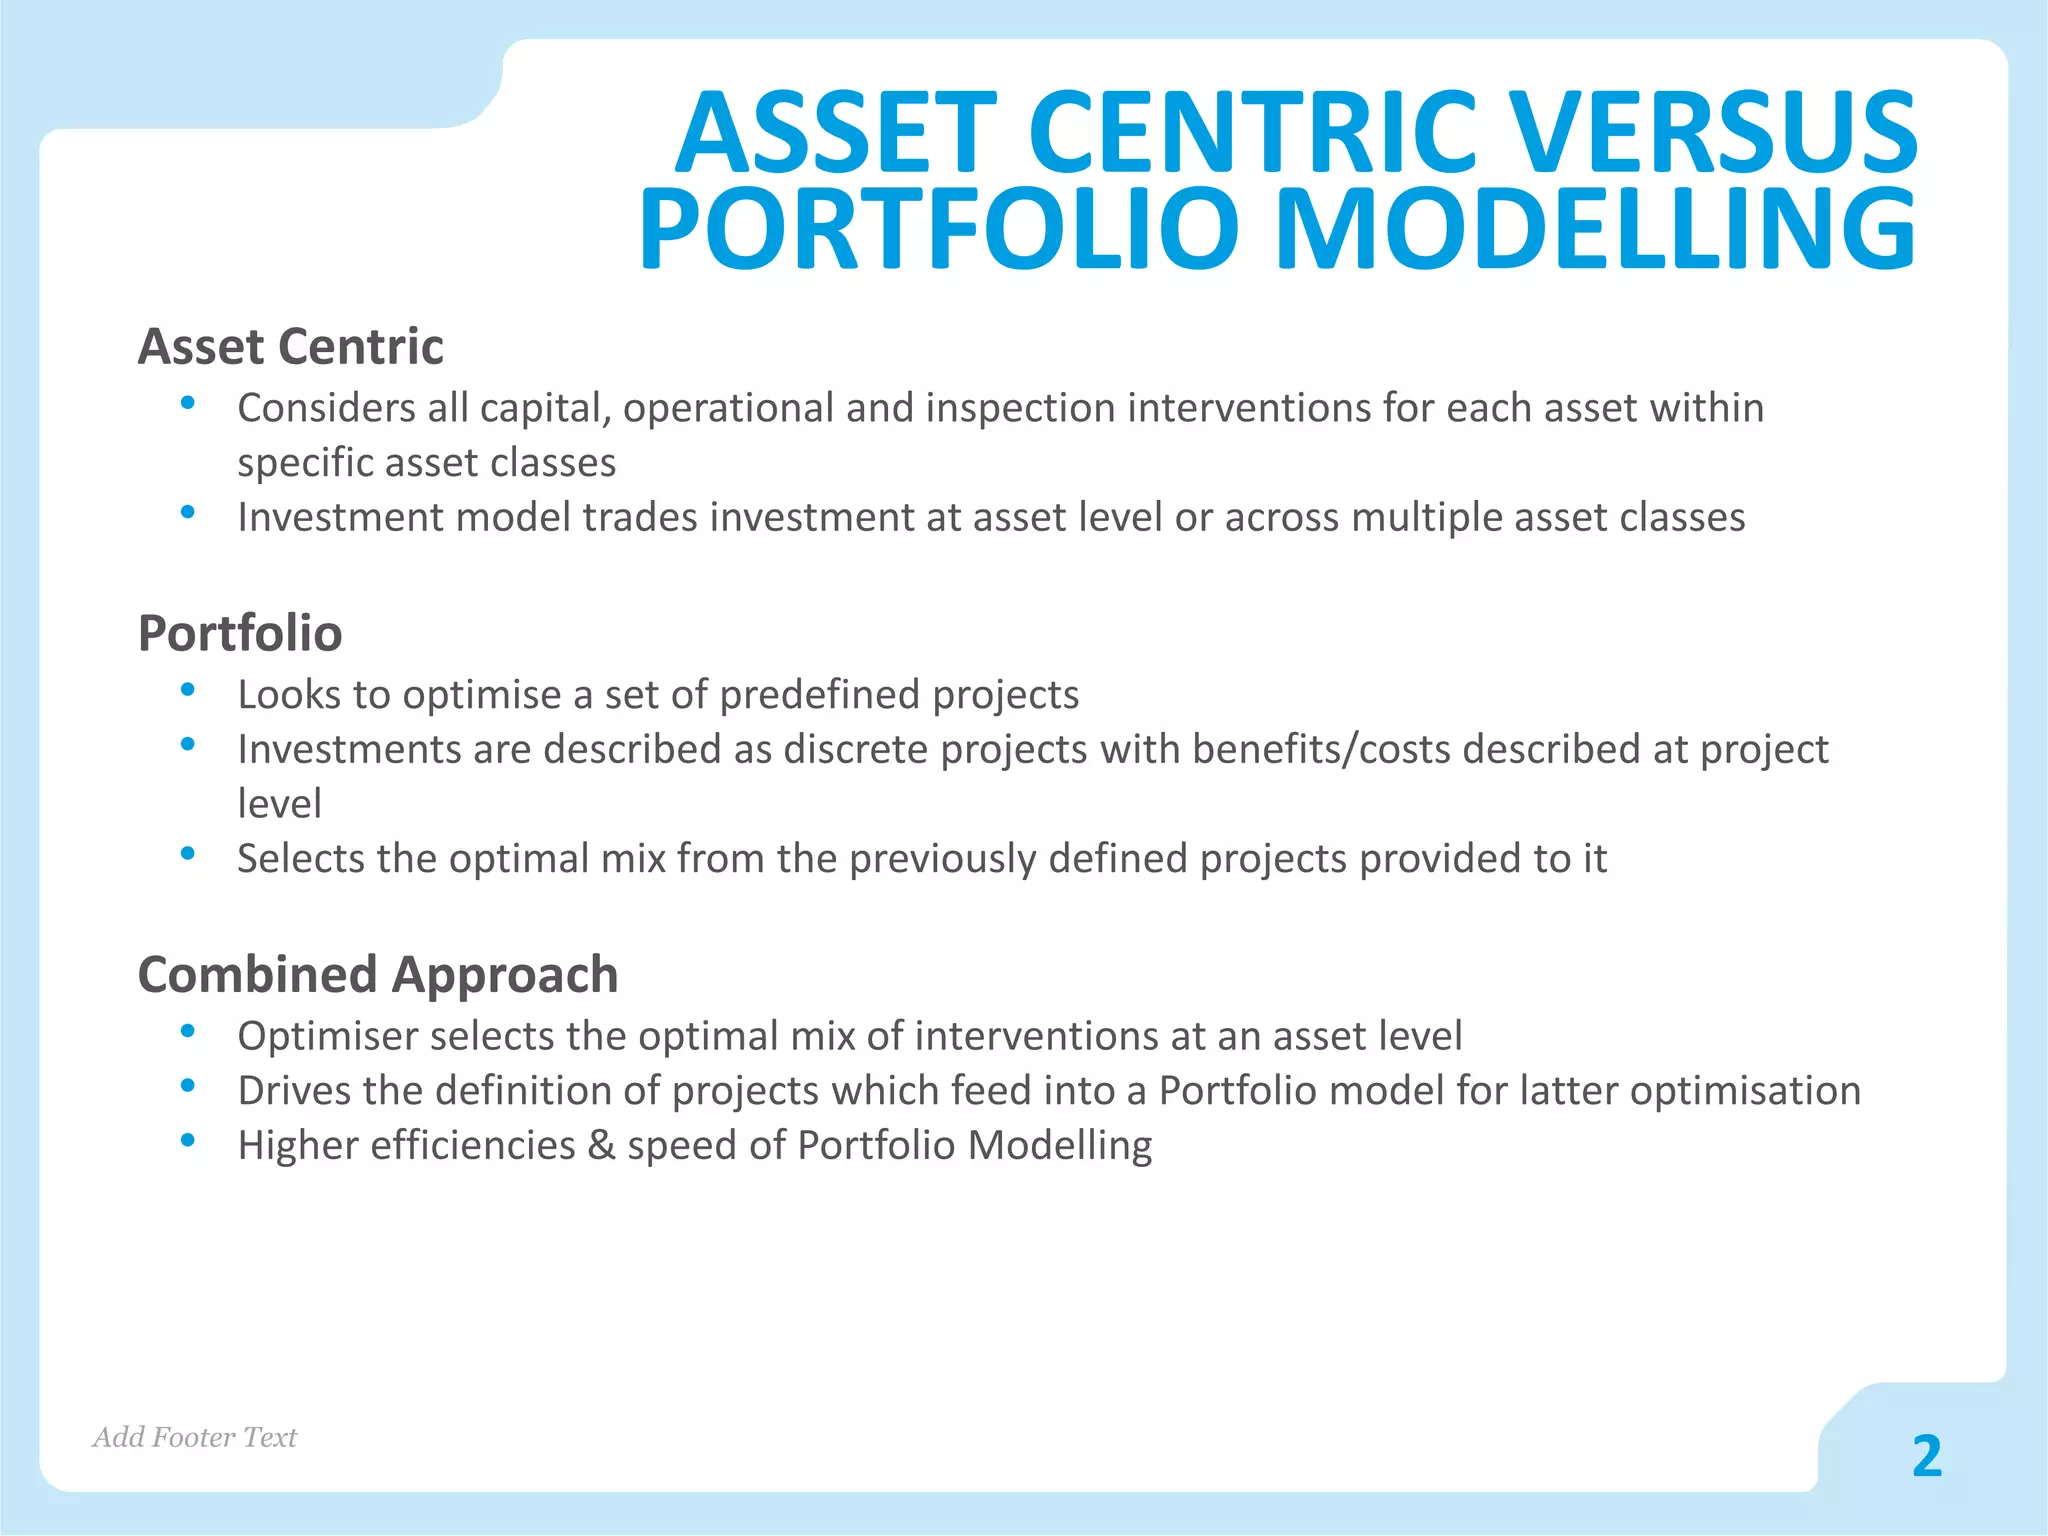
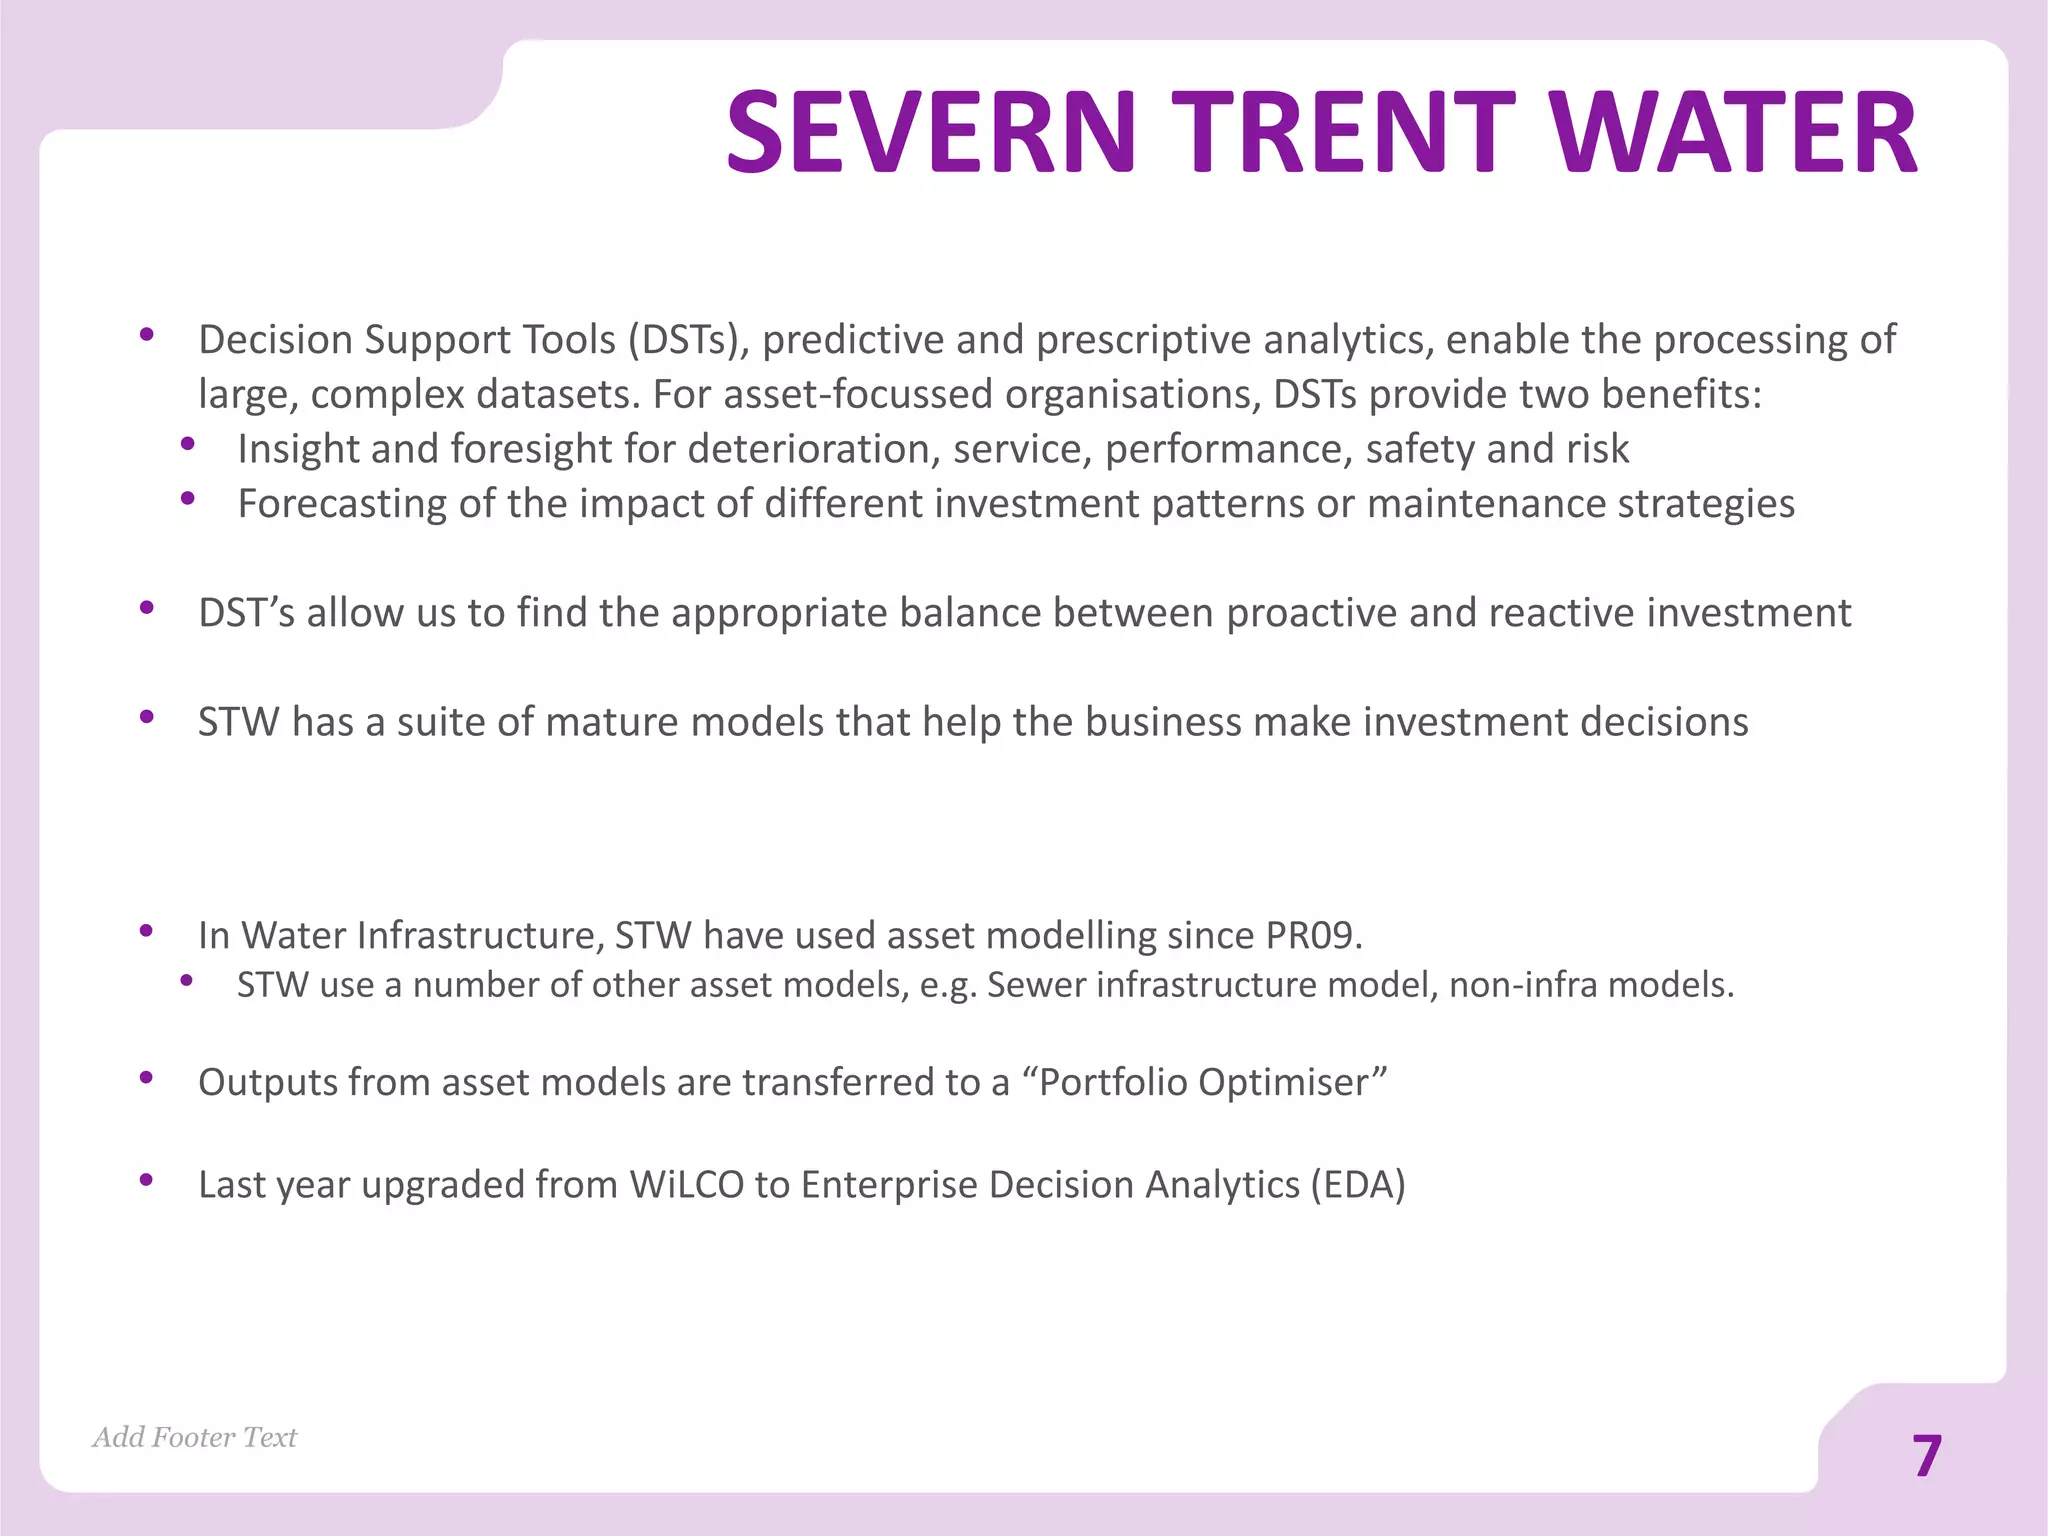
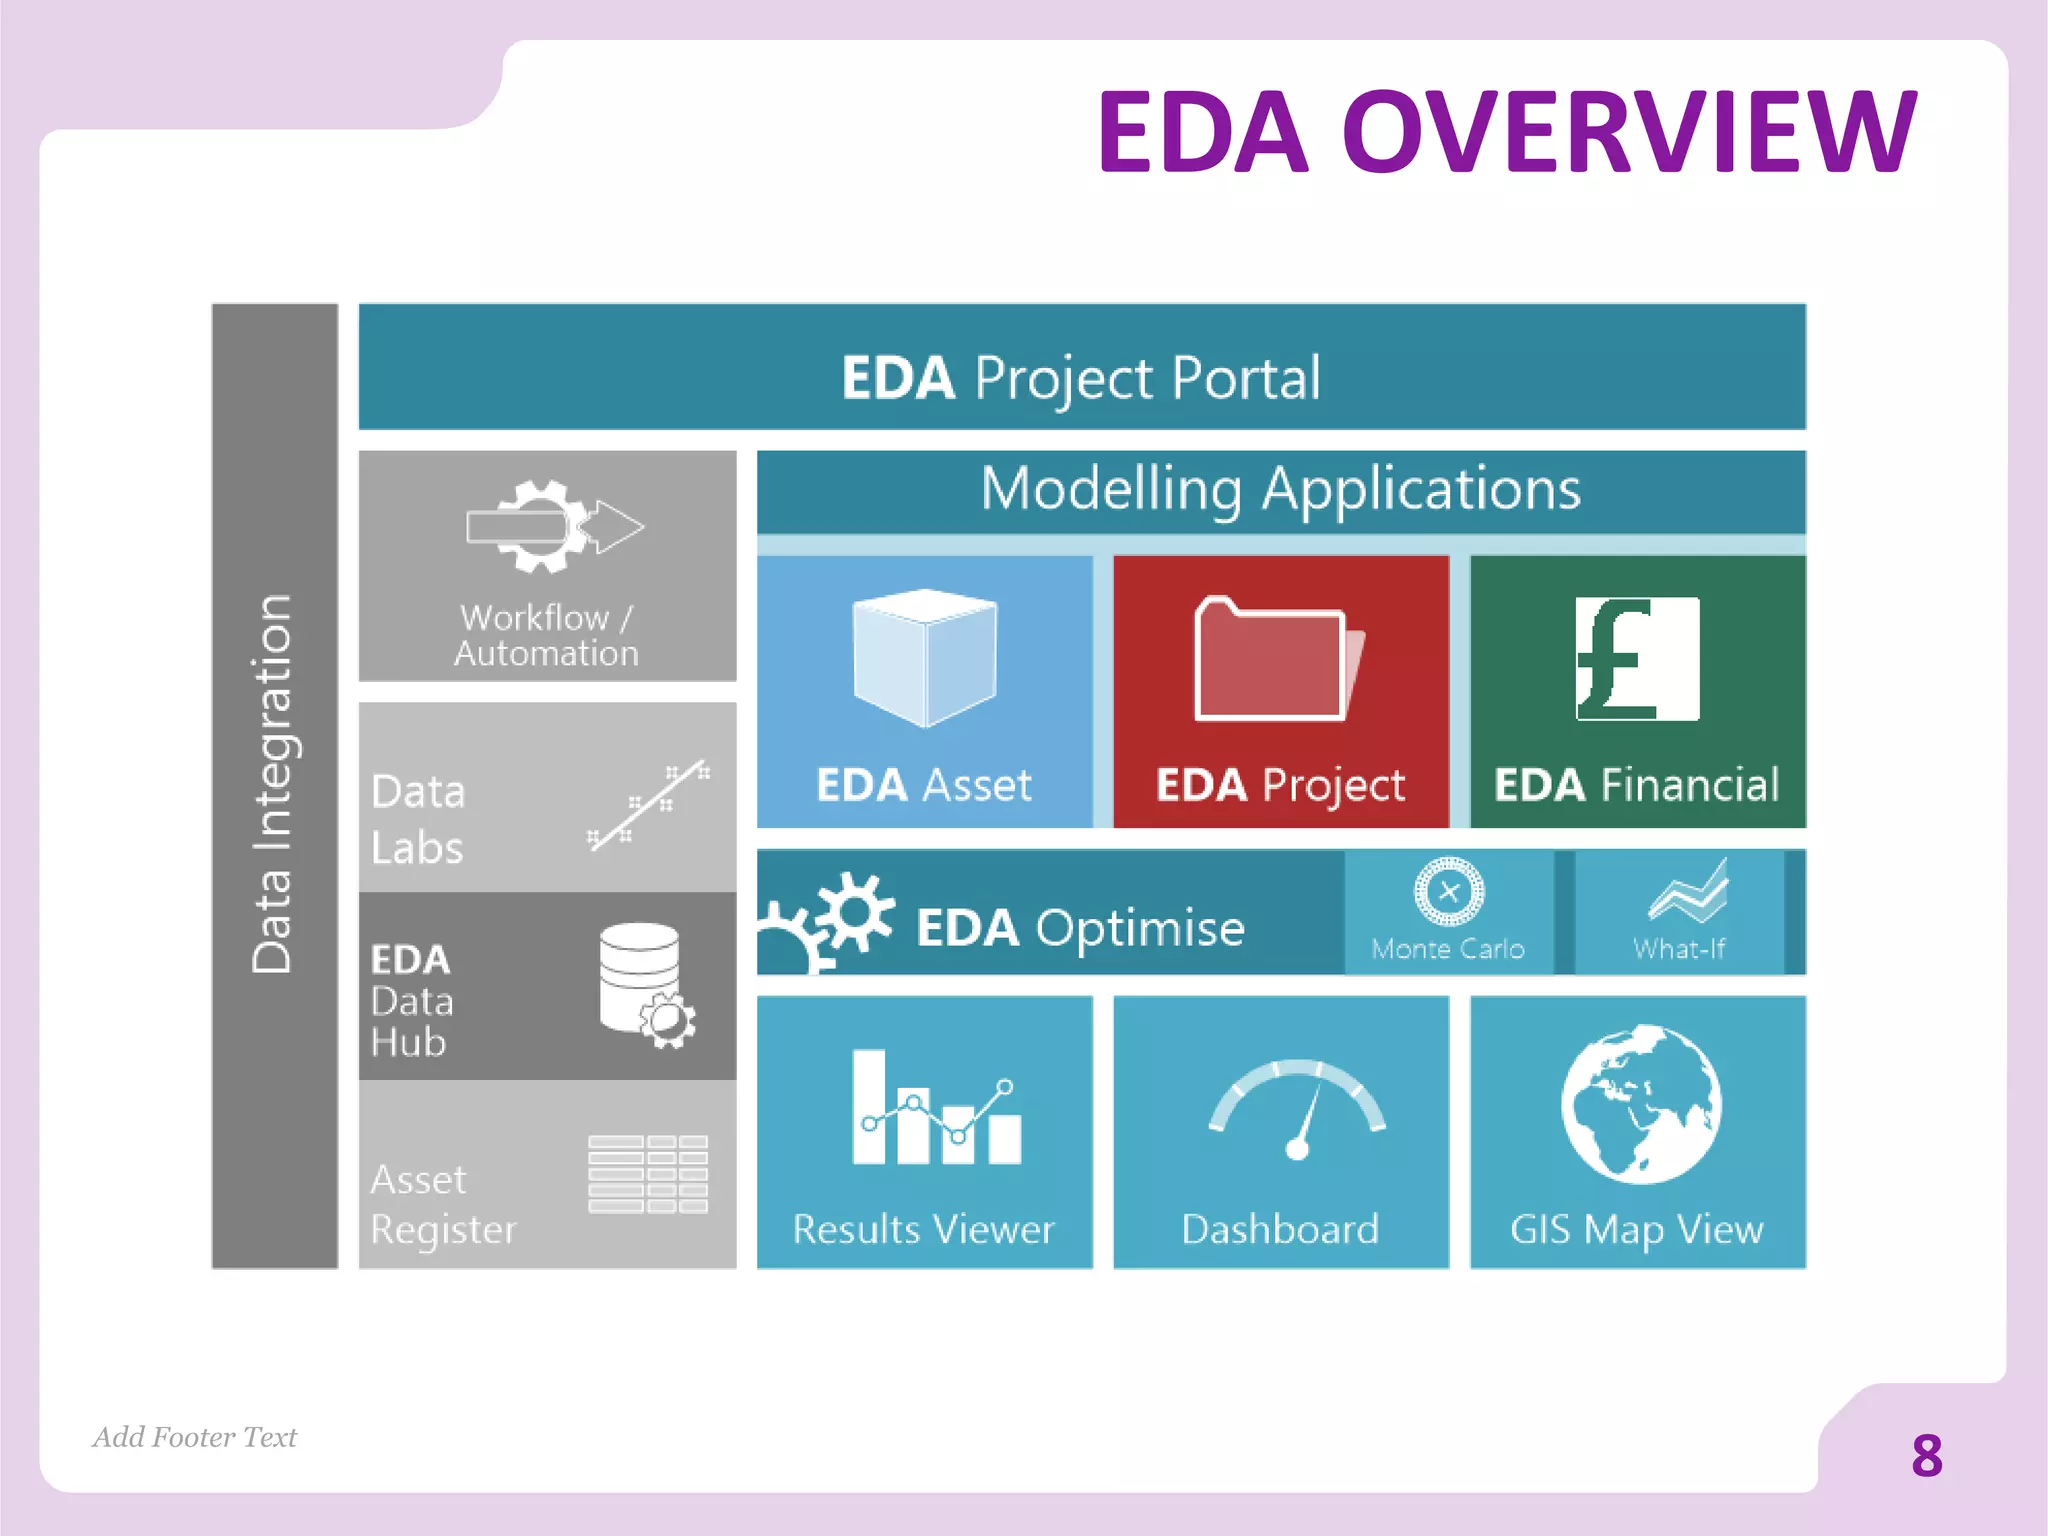
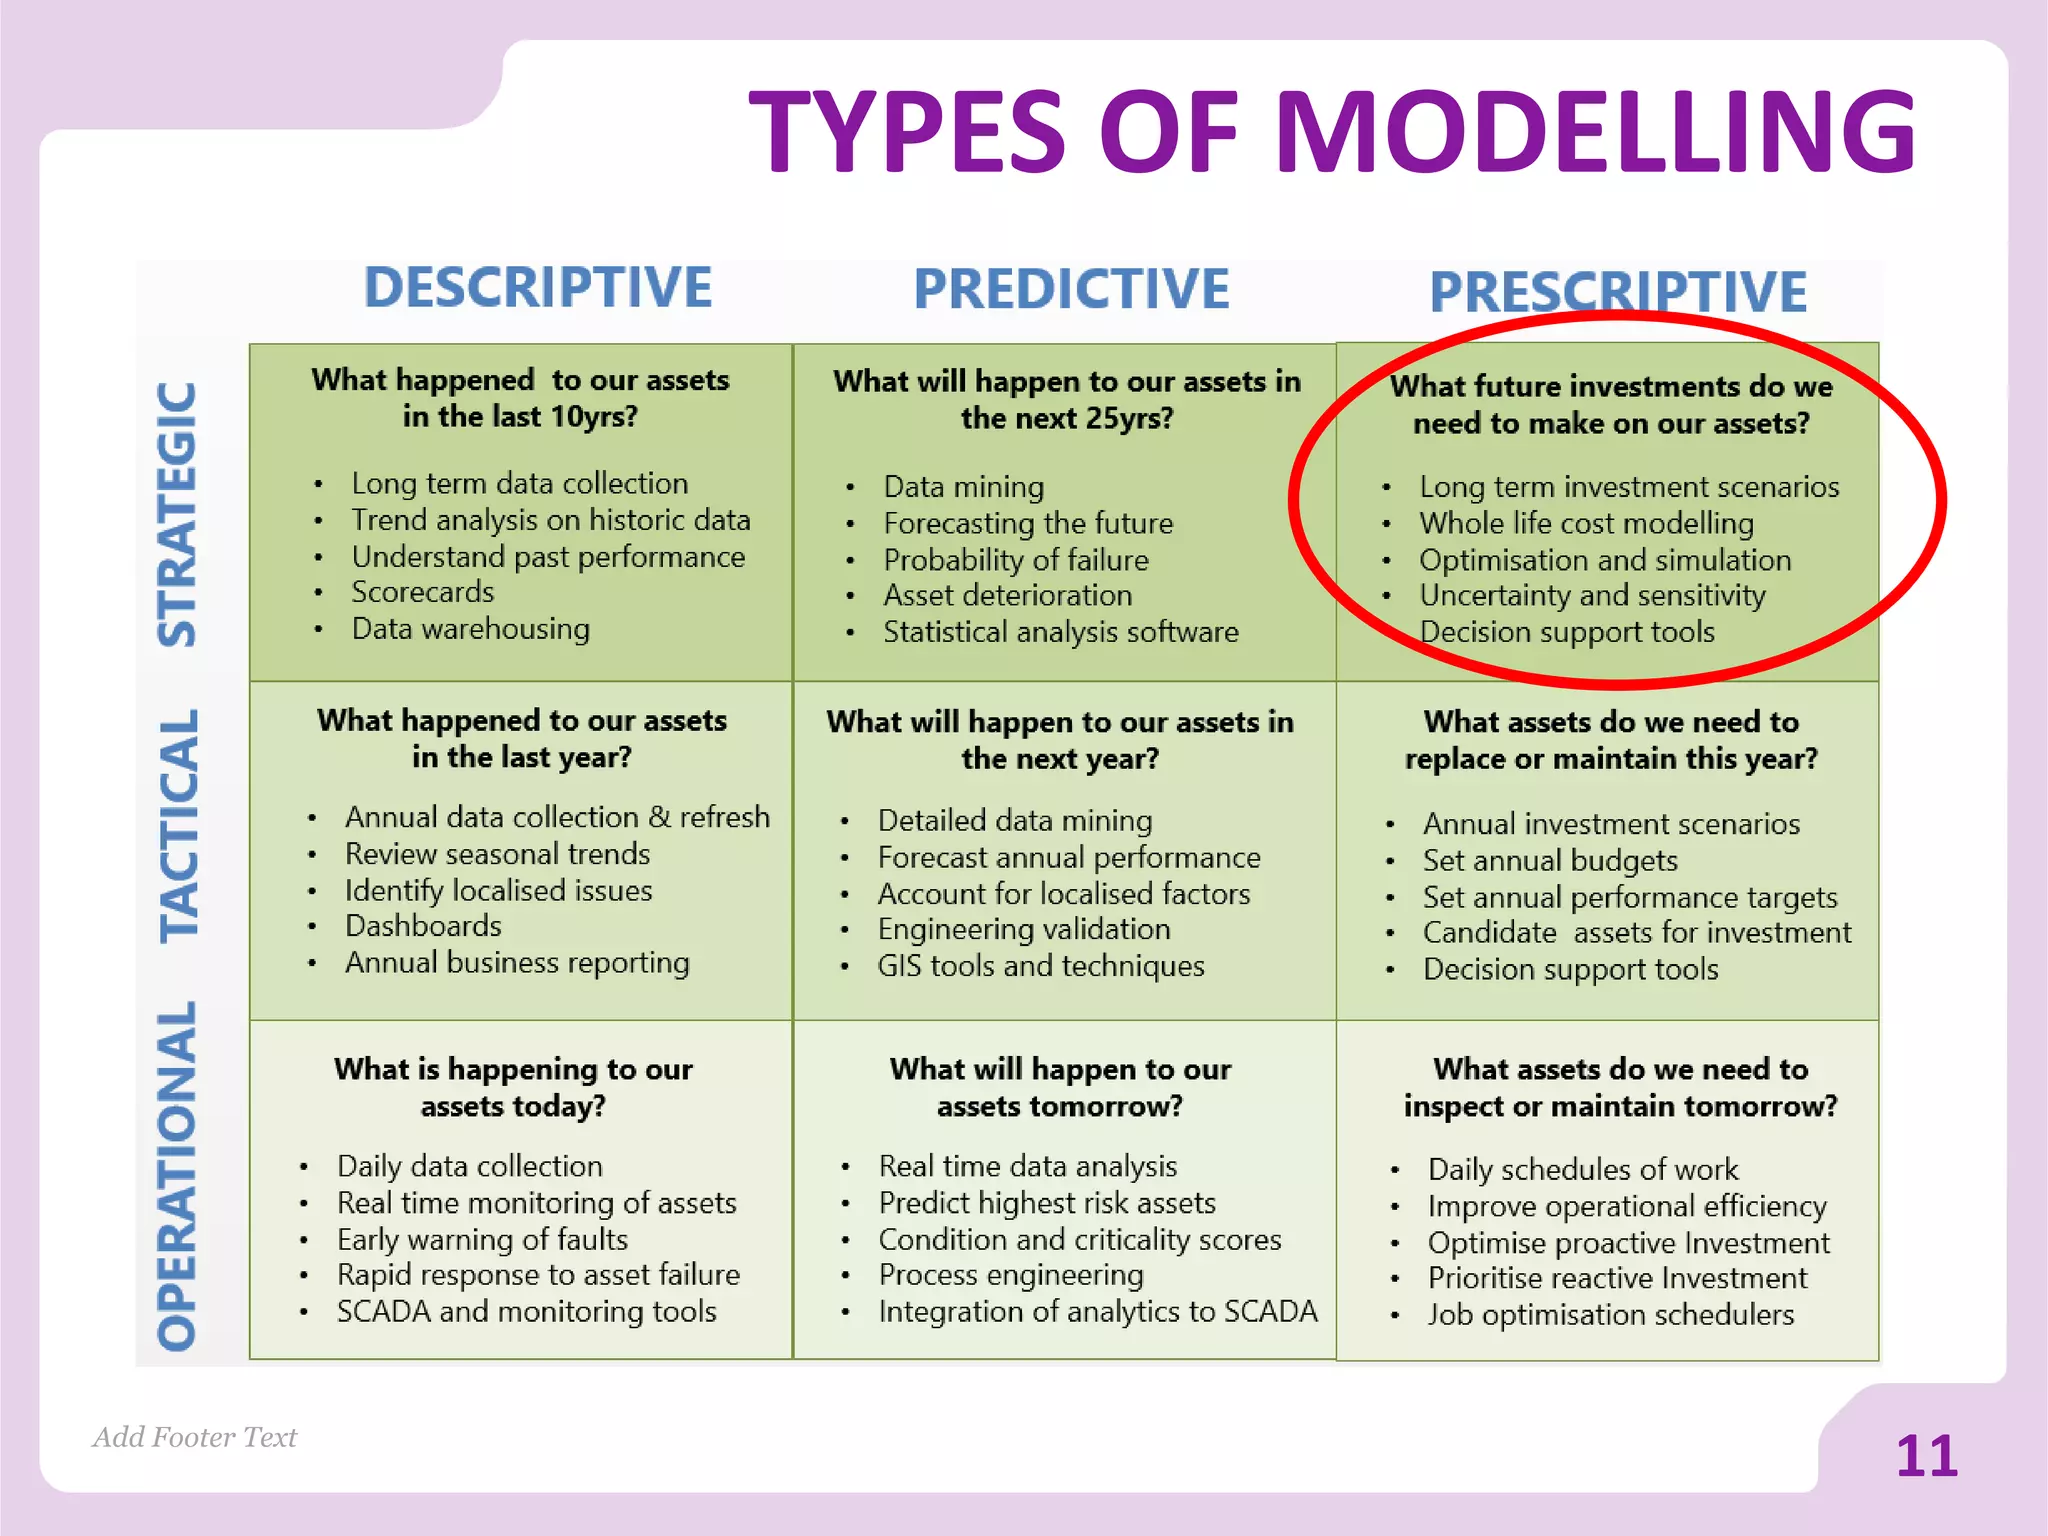
April Hutchen, Client Director, SEAMS Ltd
Jonathan Hagan, Asset Modelling & Strategy Analyst, Severn Trent Water
24 November 2016
ASSET VERSUS PORTFOLIO CENTRIC
INVESTMENT MODELLING & THE
USE OF ANALYTICS
WHAT IS OPTIMISATION?
Definition of optimisation:
• An act, process, or methodology of making something (as a design, system,
or decision) as fully perfect, functional, or effective as possible; specifically :
the mathematical procedures (as finding the maximum of a function)
involved in this.
Optimisation in Asset Investment Planning:
• Use of complex mathematical algorithms to minimise Whole Life Costs of
asset investments across operational interventions, capital replacements
and inspections.
• The optimiser will trade costs against expected benefits (or risk reduction)
to arrive at an optimal investment plan.
Add Footer Text
1
ASSET CENTRIC VERSUS
PORTFOLIO MODELLING
Asset Centric
• Considers all capital, operational and inspection interventions for each asset within
specific asset classes
• Investment model trades investment at asset level or across multiple asset classes
Portfolio
• Looks to optimise a set of predefined projects
• Investments are described as discrete projects with benefits/costs described at project
level
• Selects the optimal mix from the previously defined projects provided to it
Combined Approach
• Optimiser selects the optimal mix of interventions at an asset level
• Drives the definition of projects which feed into a Portfolio model for latter optimisation
• Higher efficiencies & speed of Portfolio Modelling
Add Footer Text
2
BENEFITS/CONSTRAINTS
– ASSET CENTRIC
Benefits of Asset Modelling
• Right investment intervention for the right asset at the right time
• Increases buy-in from all stakeholders
• High efficiencies, typically between 7 and 17%
• Increases the transparency of the investment planning cycle
• Challenges historic, recurring decisions
• Best replicates real-world intervention options and constraints
Constraints of Asset Modelling
• Where there are large volumes of assets, models can be time consuming to run as the data
is granular – cohorts or combined approach may be recommended
Add Footer Text
3
BENEFITS/CONSTRAINTS
- PORFOLIO
Benefits of Portfolio Modelling
• Delivers more value from the investment program for a level of spend
• Increases the transparency of the investment planning cycle
• Maximises the value of existing and ‘siloed’ investment approaches
• Ensures the highest ‘value engineering’ projects are taken forward
• Increases buy-in from all stakeholders
Constraints
Have the right projects been chosen to be optimised?
Have the benefits and costs been accurately reflected?
• Controls need to be in place to avoid gaming
Add Footer Text
4
CASE STUDY
Severn Trent Water (STW)
Add Footer Text
5
SEVERN TRENT WATER
• Severn Trent Water
• Water company and waste company
• Regulated industry (OFWAT)
• 5 year Asset Management Planning cycles
• Infrastructure Assets:
• 47,000km of clean water pipes (1.3m assets)
• 40,000km of sewer pipes (1.4m assets)
• Non-Infrasturture Assets:
• 125 Water Treatment Works
• 1,100 Sewage Treatment Works
• 667 Water Pumping stations
• 3,000 sewage pumping stations
• 455 distribution service reservoirs
• 45 Sludge treatment facilities
• 259,000 mechanical, electrical and instrumentation assets in total
Add Footer Text
6
SEVERN TRENT WATER
• Decision Support Tools (DSTs), predictive and prescriptive analytics, enable the processing of
large, complex datasets. For asset-focussed organisations, DSTs provide two benefits:
• Insight and foresight for deterioration, service, performance, safety and risk
• Forecasting of the impact of different investment patterns or maintenance strategies
• DST’s allow us to find the appropriate balance between proactive and reactive investment
• STW has a suite of mature models that help the business make investment decisions
Add Footer Text
7
• In Water Infrastructure, STW have used asset modelling since PR09.
• STW use a number of other asset models, e.g. Sewer infrastructure model, non-infra models.
• Outputs from asset models are transferred to a “Portfolio Optimiser”
• Last year upgraded from WiLCO to Enterprise Decision Analytics (EDA)
EDA OVERVIEW
Add Footer Text
8
CHOOSING THE RIGHT MODEL
Add Footer Text
9
CHOOSING THE RIGHT MODEL
Add Footer Text
10
TYPES OF MODELLING
Add Footer Text
11
WATER INFRASTRUCTURE
Add Footer Text
12
OPTIMISATION
Model Options
• Constraints
• Performance Area – Company level, Water Resource Zone (WRZ) level
• Supply Interruptions > 6 hours – Improve, maintain or relax
• Leakage – Maintain, Sustainable Economic Level of Leakage, Environment Agency aspiration
• Assumptions
• Leakage deterioration
• Water Framework Directive impact on Water Available for Use
• Maximum renewal rate
• Optimisation type
• Genetic Algorithm
Add Footer Text
13
RESULTS
Add Footer Text
14
• Optimised plan for a given scenario
• Pipe Plan
• Selection of supply schemes
• Other EDA models produce optimised plans for given scenarios:
• Sewer Infrastructure model
• Linear Otimisation
• Non-Infrastructure models
• What next?
• Portfolio Optimisation
PORTFOLIO OPTIMISATION
Add Footer Text
15
PORTFOLIO
OPTIMISATION
USING FICTIONAL
DATA
Add Footer Text
16
Add Footer Text
17
EXAMPLE NEED AND SOLUTION
Need
ND-0001
Non-modelled 1
t0 t1 t2 t3 t4 t5 t6 t7 t8 t9 t10
OPEX £k 0 190 190 190 190 190 190 190 190 190 190
Water Quality
Complaints 5 5 10 10 15 15 20 20 25 25 25
Solution
SN-0001/01
Non-modelled 1
t0 t1 t2 t3 t4 t5 t6 t7 t8 t9 t10
OPEX £k 110 110 110 110 110 110 110 110 110 110
CAPEX £k 2400 0 0 0 0 0 0 0 0 0 0
REOC Total £k 85 85 85 85 85 85 85 85 85 85
Water Qulaity
complaints 5 10 10 10 10 10 10 10 10 10 10
NO INVESTMENT SCENARIO
Add Footer Text
18
NO INVESTMENT
SCENARIO
Add Footer Text
19
SCENARIO 1
Add Footer Text
20
SCENARIO 1
Add Footer Text
21
SCENARIO 1 – CHOICES
Add Footer Text
22
Series Years Years Years Years Years Years Years Years Years Years Years
Series 2020 2021 2022 2023 2024 2025 2026 2027 2028 2029 2030
NS 1 1 0 0 0 0 0 0 0 0 0 0
NS 2 0 0 0 0 0 0 0 0 0 0 0
NS 3 1 0 0 0 0 0 0 0 0 0 0
NS 4 0 0 0 0 0 0 0 0 0 0 0
NS 5 0 0 0 0 0 1 0 0 0 0 0
NS 6 1 0 0 0 0 0 0 0 0 0 0
NS 7 0 0 0 0 0 0 0 0 0 0 0
NS 8 0 0 0 0 0 0 0 0 0 0 0
NS 9 0 0 0 0 0 0 0 1 0 0 0
NS 10 0 0 0 0 0 0 0 0 0 1 0
SCENARIO 1 – OVERALL
SPEND
Add Footer Text
23
END TO END DELIVERY
Add Footer Text
24
Strategic Asset Modelling
AMP Planning
Portfolio Optimisation
Price Review – Business Plan
Delivery Asset Modelling
Annual delivery planning
Portfolio Optimisation
Annual plan – delivery projects
Add Footer Text
ARE THERE
ANY QUESTIONS?
25

IAM conference: asset vs portfolio modelling

  • 1.
    April Hutchen, ClientDirector, SEAMS Ltd Jonathan Hagan, Asset Modelling & Strategy Analyst, Severn Trent Water 24 November 2016 ASSET VERSUS PORTFOLIO CENTRIC INVESTMENT MODELLING & THE USE OF ANALYTICS
  • 2.
    WHAT IS OPTIMISATION? Definitionof optimisation: • An act, process, or methodology of making something (as a design, system, or decision) as fully perfect, functional, or effective as possible; specifically : the mathematical procedures (as finding the maximum of a function) involved in this. Optimisation in Asset Investment Planning: • Use of complex mathematical algorithms to minimise Whole Life Costs of asset investments across operational interventions, capital replacements and inspections. • The optimiser will trade costs against expected benefits (or risk reduction) to arrive at an optimal investment plan. Add Footer Text 1
  • 3.
    ASSET CENTRIC VERSUS PORTFOLIOMODELLING Asset Centric • Considers all capital, operational and inspection interventions for each asset within specific asset classes • Investment model trades investment at asset level or across multiple asset classes Portfolio • Looks to optimise a set of predefined projects • Investments are described as discrete projects with benefits/costs described at project level • Selects the optimal mix from the previously defined projects provided to it Combined Approach • Optimiser selects the optimal mix of interventions at an asset level • Drives the definition of projects which feed into a Portfolio model for latter optimisation • Higher efficiencies & speed of Portfolio Modelling Add Footer Text 2
  • 4.
    BENEFITS/CONSTRAINTS – ASSET CENTRIC Benefitsof Asset Modelling • Right investment intervention for the right asset at the right time • Increases buy-in from all stakeholders • High efficiencies, typically between 7 and 17% • Increases the transparency of the investment planning cycle • Challenges historic, recurring decisions • Best replicates real-world intervention options and constraints Constraints of Asset Modelling • Where there are large volumes of assets, models can be time consuming to run as the data is granular – cohorts or combined approach may be recommended Add Footer Text 3
  • 5.
    BENEFITS/CONSTRAINTS - PORFOLIO Benefits ofPortfolio Modelling • Delivers more value from the investment program for a level of spend • Increases the transparency of the investment planning cycle • Maximises the value of existing and ‘siloed’ investment approaches • Ensures the highest ‘value engineering’ projects are taken forward • Increases buy-in from all stakeholders Constraints Have the right projects been chosen to be optimised? Have the benefits and costs been accurately reflected? • Controls need to be in place to avoid gaming Add Footer Text 4
  • 6.
    CASE STUDY Severn TrentWater (STW) Add Footer Text 5
  • 7.
    SEVERN TRENT WATER •Severn Trent Water • Water company and waste company • Regulated industry (OFWAT) • 5 year Asset Management Planning cycles • Infrastructure Assets: • 47,000km of clean water pipes (1.3m assets) • 40,000km of sewer pipes (1.4m assets) • Non-Infrasturture Assets: • 125 Water Treatment Works • 1,100 Sewage Treatment Works • 667 Water Pumping stations • 3,000 sewage pumping stations • 455 distribution service reservoirs • 45 Sludge treatment facilities • 259,000 mechanical, electrical and instrumentation assets in total Add Footer Text 6
  • 8.
    SEVERN TRENT WATER •Decision Support Tools (DSTs), predictive and prescriptive analytics, enable the processing of large, complex datasets. For asset-focussed organisations, DSTs provide two benefits: • Insight and foresight for deterioration, service, performance, safety and risk • Forecasting of the impact of different investment patterns or maintenance strategies • DST’s allow us to find the appropriate balance between proactive and reactive investment • STW has a suite of mature models that help the business make investment decisions Add Footer Text 7 • In Water Infrastructure, STW have used asset modelling since PR09. • STW use a number of other asset models, e.g. Sewer infrastructure model, non-infra models. • Outputs from asset models are transferred to a “Portfolio Optimiser” • Last year upgraded from WiLCO to Enterprise Decision Analytics (EDA)
  • 9.
  • 10.
    CHOOSING THE RIGHTMODEL Add Footer Text 9
  • 11.
    CHOOSING THE RIGHTMODEL Add Footer Text 10
  • 12.
    TYPES OF MODELLING AddFooter Text 11
  • 13.
  • 14.
    OPTIMISATION Model Options • Constraints •Performance Area – Company level, Water Resource Zone (WRZ) level • Supply Interruptions > 6 hours – Improve, maintain or relax • Leakage – Maintain, Sustainable Economic Level of Leakage, Environment Agency aspiration • Assumptions • Leakage deterioration • Water Framework Directive impact on Water Available for Use • Maximum renewal rate • Optimisation type • Genetic Algorithm Add Footer Text 13
  • 15.
    RESULTS Add Footer Text 14 •Optimised plan for a given scenario • Pipe Plan • Selection of supply schemes • Other EDA models produce optimised plans for given scenarios: • Sewer Infrastructure model • Linear Otimisation • Non-Infrastructure models • What next? • Portfolio Optimisation
  • 16.
  • 17.
  • 18.
    Add Footer Text 17 EXAMPLENEED AND SOLUTION Need ND-0001 Non-modelled 1 t0 t1 t2 t3 t4 t5 t6 t7 t8 t9 t10 OPEX £k 0 190 190 190 190 190 190 190 190 190 190 Water Quality Complaints 5 5 10 10 15 15 20 20 25 25 25 Solution SN-0001/01 Non-modelled 1 t0 t1 t2 t3 t4 t5 t6 t7 t8 t9 t10 OPEX £k 110 110 110 110 110 110 110 110 110 110 CAPEX £k 2400 0 0 0 0 0 0 0 0 0 0 REOC Total £k 85 85 85 85 85 85 85 85 85 85 Water Qulaity complaints 5 10 10 10 10 10 10 10 10 10 10
  • 19.
  • 20.
  • 21.
  • 22.
  • 23.
    SCENARIO 1 –CHOICES Add Footer Text 22 Series Years Years Years Years Years Years Years Years Years Years Years Series 2020 2021 2022 2023 2024 2025 2026 2027 2028 2029 2030 NS 1 1 0 0 0 0 0 0 0 0 0 0 NS 2 0 0 0 0 0 0 0 0 0 0 0 NS 3 1 0 0 0 0 0 0 0 0 0 0 NS 4 0 0 0 0 0 0 0 0 0 0 0 NS 5 0 0 0 0 0 1 0 0 0 0 0 NS 6 1 0 0 0 0 0 0 0 0 0 0 NS 7 0 0 0 0 0 0 0 0 0 0 0 NS 8 0 0 0 0 0 0 0 0 0 0 0 NS 9 0 0 0 0 0 0 0 1 0 0 0 NS 10 0 0 0 0 0 0 0 0 0 1 0
  • 24.
    SCENARIO 1 –OVERALL SPEND Add Footer Text 23
  • 25.
    END TO ENDDELIVERY Add Footer Text 24 Strategic Asset Modelling AMP Planning Portfolio Optimisation Price Review – Business Plan Delivery Asset Modelling Annual delivery planning Portfolio Optimisation Annual plan – delivery projects
  • 26.
    Add Footer Text ARETHERE ANY QUESTIONS? 25