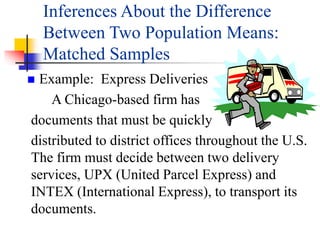
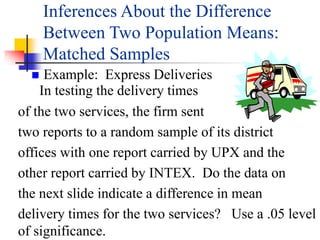
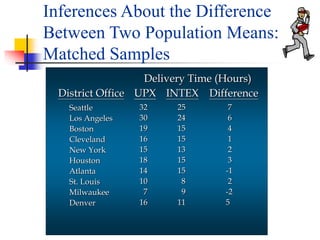
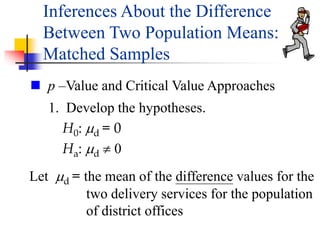
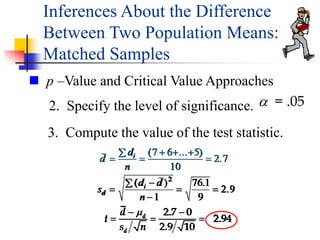
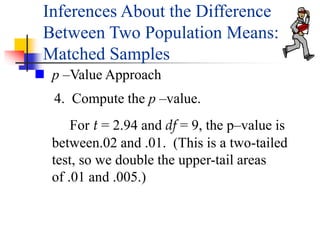
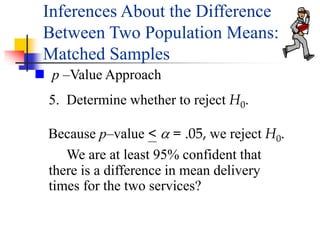
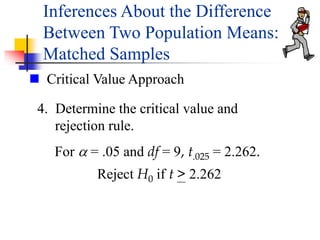
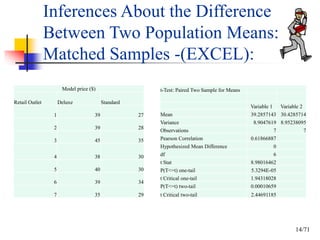
Statistics
Statistical Inference About Means
With Two Populations
 With a matched-sample design each sampled
item provides a pair of data values.
 This design often leads to a smaller sampling
error than the independent-sample design
because variation between sampled items is
eliminated as a source of sampling error.
Inferences About the Difference
Between Two Population Means:
Matched Samples
 Example: Express Deliveries
A Chicago-based firm has
documents that must be quickly
distributed to district offices throughout the U.S.
The firm must decide between two delivery
services, UPX (United Parcel Express) and
INTEX (International Express), to transport its
documents.
Inferences About the Difference
Between Two Population Means:
Matched Samples
 Example: Express Deliveries
In testing the delivery times
of the two services, the firm sent
two reports to a random sample of its district
offices with one report carried by UPX and the
other report carried by INTEX. Do the data on
the next slide indicate a difference in mean
delivery times for the two services? Use a .05 level
of significance.
Inferences About the Difference
Between Two Population Means:
Matched Samples
32
30
19
16
15
18
14
10
7
16
25
24
15
15
13
15
15
8
9
11
UPX INTEX Difference
District Office
Seattle
Los Angeles
Boston
Cleveland
New York
Houston
Atlanta
St. Louis
Milwaukee
Denver
Delivery Time (Hours)
7
6
4
1
2
3
-1
2
-2
5
Inferences About the Difference
Between Two Population Means:
Matched Samples
1. Develop the hypotheses.
H0: d = 0
Ha: d 
Let d = the mean of the difference values for the
two delivery services for the population
of district offices
 p –Value and Critical Value Approaches
Inferences About the Difference
Between Two Population Means:
Matched Samples
3. Compute the value of the test statistic.
2. Specify the level of significance. a = .05
 p –Value and Critical Value Approaches
d
d
n
i



  

( ... )
.
7 6 5
10
2 7
s
d d
n
d
i




 
( ) .
.
2
1
76 1
9
2 9
2.7 0
2.94
2.9 10
d
d
d
t
s n

 
  
Inferences About the Difference
Between Two Population Means:
Matched Samples
4. Compute the p –value.
For t = 2.94 and df = 9, the p–value is
between.02 and .01. (This is a two-tailed
test, so we double the upper-tail areas
of .01 and .005.)
 p –Value Approach
Inferences About the Difference
Between Two Population Means:
Matched Samples
5. Determine whether to reject H0.
We are at least 95% confident that
there is a difference in mean delivery
times for the two services?
Because p–value < a = .05, we reject H0.
 p –Value Approach
Inferences About the Difference
Between Two Population Means:
Matched Samples
4. Determine the critical value and
rejection rule.
 Critical Value Approach
For a = .05 and df = 9, t.025 = 2.262.
Reject H0 if t > 2.262
Inferences About the Difference
Between Two Population Means:
Matched Samples
11/71
Q 27- A manufacturer produces both a deluxe and a standard
model of an automatic sander designed for home use. Selling
prices obtained from a sample of retail outlets follow.
12/71
13/71
14/71
Model price ($)
Retail Outlet Deluxe Standard
1 39 27
2 39 28
3 45 35
4 38 30
5 40 30
6 39 34
7 35 29
t-Test: Paired Two Sample for Means
Variable 1 Variable 2
Mean 39.2857143 30.4285714
Variance 8.9047619 8.95238095
Observations 7 7
Pearson Correlation 0.61866887
Hypothesized Mean Difference 0
df 6
t Stat 8.98016462
P(T<=t) one-tail 5.3294E-05
t Critical one-tail 1.94318028
P(T<=t) two-tail 0.00010659
t Critical two-tail 2.44691185
Inferences About the Difference
Between Two Population Means:
Matched Samples -(EXCEL):

Hypothesis Testing

  • 1.
    Statistics Statistical Inference AboutMeans With Two Populations
  • 2.
     With amatched-sample design each sampled item provides a pair of data values.  This design often leads to a smaller sampling error than the independent-sample design because variation between sampled items is eliminated as a source of sampling error. Inferences About the Difference Between Two Population Means: Matched Samples
  • 3.
     Example: ExpressDeliveries A Chicago-based firm has documents that must be quickly distributed to district offices throughout the U.S. The firm must decide between two delivery services, UPX (United Parcel Express) and INTEX (International Express), to transport its documents. Inferences About the Difference Between Two Population Means: Matched Samples
  • 4.
     Example: ExpressDeliveries In testing the delivery times of the two services, the firm sent two reports to a random sample of its district offices with one report carried by UPX and the other report carried by INTEX. Do the data on the next slide indicate a difference in mean delivery times for the two services? Use a .05 level of significance. Inferences About the Difference Between Two Population Means: Matched Samples
  • 5.
    32 30 19 16 15 18 14 10 7 16 25 24 15 15 13 15 15 8 9 11 UPX INTEX Difference DistrictOffice Seattle Los Angeles Boston Cleveland New York Houston Atlanta St. Louis Milwaukee Denver Delivery Time (Hours) 7 6 4 1 2 3 -1 2 -2 5 Inferences About the Difference Between Two Population Means: Matched Samples
  • 6.
    1. Develop thehypotheses. H0: d = 0 Ha: d  Let d = the mean of the difference values for the two delivery services for the population of district offices  p –Value and Critical Value Approaches Inferences About the Difference Between Two Population Means: Matched Samples
  • 7.
    3. Compute thevalue of the test statistic. 2. Specify the level of significance. a = .05  p –Value and Critical Value Approaches d d n i        ( ... ) . 7 6 5 10 2 7 s d d n d i       ( ) . . 2 1 76 1 9 2 9 2.7 0 2.94 2.9 10 d d d t s n       Inferences About the Difference Between Two Population Means: Matched Samples
  • 8.
    4. Compute thep –value. For t = 2.94 and df = 9, the p–value is between.02 and .01. (This is a two-tailed test, so we double the upper-tail areas of .01 and .005.)  p –Value Approach Inferences About the Difference Between Two Population Means: Matched Samples
  • 9.
    5. Determine whetherto reject H0. We are at least 95% confident that there is a difference in mean delivery times for the two services? Because p–value < a = .05, we reject H0.  p –Value Approach Inferences About the Difference Between Two Population Means: Matched Samples
  • 10.
    4. Determine thecritical value and rejection rule.  Critical Value Approach For a = .05 and df = 9, t.025 = 2.262. Reject H0 if t > 2.262 Inferences About the Difference Between Two Population Means: Matched Samples
  • 11.
    11/71 Q 27- Amanufacturer produces both a deluxe and a standard model of an automatic sander designed for home use. Selling prices obtained from a sample of retail outlets follow.
  • 12.
  • 13.
  • 14.
    14/71 Model price ($) RetailOutlet Deluxe Standard 1 39 27 2 39 28 3 45 35 4 38 30 5 40 30 6 39 34 7 35 29 t-Test: Paired Two Sample for Means Variable 1 Variable 2 Mean 39.2857143 30.4285714 Variance 8.9047619 8.95238095 Observations 7 7 Pearson Correlation 0.61866887 Hypothesized Mean Difference 0 df 6 t Stat 8.98016462 P(T<=t) one-tail 5.3294E-05 t Critical one-tail 1.94318028 P(T<=t) two-tail 0.00010659 t Critical two-tail 2.44691185 Inferences About the Difference Between Two Population Means: Matched Samples -(EXCEL):