HSIL Q4FY15: Disappointing growth but margins maintained; Hold
•
0 likes•265 views

HSIL Q4FY15 results disappoint on topline but outperform on bottomline, IndiaNivesh revises to 'Hold'

Recommended
Recommended
More Related Content
What's hot
What's hot (6)
Viewers also liked
Viewers also liked (20)
Similar to HSIL Q4FY15: Disappointing growth but margins maintained; Hold
Similar to HSIL Q4FY15: Disappointing growth but margins maintained; Hold (20)
More from IndiaNotes.com
More from IndiaNotes.com (20)
Recently uploaded
Recently uploaded (20)
HSIL Q4FY15: Disappointing growth but margins maintained; Hold
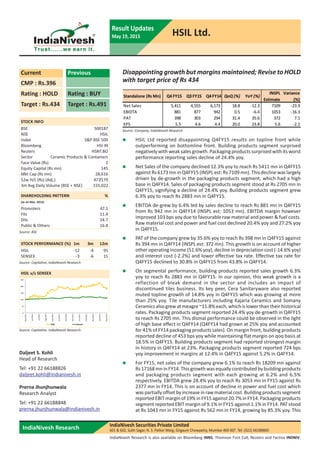
- 1. 0 50 100 150 200 250 May/2014 Jun/2014 Jul/2014 Aug/2014 Sep/2014 Oct/2014 Nov/2014 Dec/2014 Jan/2015 Feb/2015 Mar/2015 Apr/2015 May/2015 HSIL Sensex IndiaNivesh Research IndiaNivesh Securities Private Limited 601 & 602, Sukh Sagar, N. S. Patkar Marg, Girgaum Chowpatty, Mumbai 400 007. Tel: (022) 66188800 Result Updates May 19, 2015 HSIL Ltd. IndiaNivesh Research is also available on Bloomberg INNS, Thomson First Call, Reuters and Factiva INDNIV. CMP : Rs.396 Rating : HOLD Target : Rs.434 Rating : BUY Target : Rs.491 Current Previous STOCK INFO BSE 500187 NSE HSIL Index S&P BSE 500 Bloomberg HSI IN Reuters HSNT.BO Sector Ceramic Products & Containers Face Value (Rs) 2 Equity Capital (Rs mn) 145 Mkt Cap (Rs mn) 28,616 52w H/L (Rs) (Adj.) 477/179 3m Avg Daily Volume (BSE + NSE) 155,022 SHAREHOLDING PATTERN % (as on Mar. 2015) Promoters 47.1 FIIs 11.4 DIIs 24.7 Public & Others 16.8 Source: BSE STOCK PERFORMANCE (%) 1m 3m 12m HSIL -12 -4 95 SENSEX -3 -6 15 HSIL v/s SENSEX Source: Capitaline, IndiaNivesh Research Source: Capitaline, IndiaNivesh Research Daljeet S. Kohli Head of Research Tel: +91 22 66188826 daljeet.kohli@indianivesh.in Prerna Jhunjhunwala Research Analyst Tel: +91 22 66188848 prerna.jhunjhunwala@indianivesh.in Disappointing growth but margins maintained; Revise to HOLD with target price of Rs 434 Standalone (Rs Mn) Q4 FY15 Q3 FY15 Q4FY14 QoQ (%) YoY (%) INSPL Estimate Variance (%) Net Sales 5,411 4,555 6,173 18.8 -12.3 7109 -23.9 EBIDTA 881 877 942 0.5 -6.4 1053 -16.3 PAT 398 303 294 31.4 35.6 372 7.1 EPS 5.5 4.6 4.4 20.0 23.8 5.6 -2.1 HSIL Ltd reported disappointing Q4FY15 results on topline front while outperforming on bottomline front. Building products segment surprised negatively with weak sales growth. Packaging products surprised with its worst performance reporting sales decline of 24.4% yoy. Net Sales of the company declined 12.3% yoy to reach Rs 5411 mn in Q4FY15 against Rs 6173 mn in Q4FY15 (INSPL est: Rs 7109 mn). This decline was largely driven by de-growth in the packaging products segment, which had a high base in Q4FY14. Sales of packaging products segment stood at Rs 2705 mn in Q4FY15, signifying a decline of 24.4% yoy. Building products segment grew 6.3% yoy to reach Rs 2883 mn in Q4FY15. EBITDA de-grew by 6.4% led by sales decline to reach Rs 881 mn in Q4FY15 from Rs 942 mn in Q4FY14 (INSPL est: 1053 mn). EBITDA margin however improved 103 bps yoy due to favourable raw material and power & fuel costs. Raw material cost and power and fuel cost declined 20.4% yoy and 27.2% yoy in Q4FY15. PAT of the company grew by 35.6% yoy to reach Rs 398 mn in Q4FY15 against Rs 394 mn in Q4FY14 (INSPL est: 372 mn). This growth is on account of higher other operating income (51.6% yoy), decline in depreciation cost (-14.6% yoy) and interest cost (-2.2%) and lower effective tax rate. Effective tax rate for Q4FY15 declined to 30.8% in Q4FY15 from 43.8% in Q4FY14. On segmental performance, building products reported sales growth 6.3% yoy to reach Rs 2883 mn in Q4FY15. In our opinion, this weak growth is a reflection of bleak demand in the sector and includes an impact of discontinued tiles business. Its key peer, Cera Sanitaryware also reported muted topline growth of 14.8% yoy in Q4FY15 which was growing at more than 25% yoy. Tile manufacturers including Kajaria Ceramics and Somany Ceramics also grew at meagre ~11.8% each, which is lower than their historical rates. Packaging products segment reported 24.4% yoy de-growth in Q4FY15 to reach Rs 2705 mn. This dismal performance could be observed in the light of high base effect in Q4FY14 (Q4FY14 had grown at 25% yoy and accounted for 41% of FY14 packaging products sales). On margin front, building products reported decline of 453 bps yoy while maintaining flat margin on qoq basis at 18.5% in Q4FY15. Building products segment had reported strongest margin in history in Q4FY14 at 23%. Packaging products segment reported 724 bps yoy improvement in margins at 12.4% in Q4FY15 against 5.2% in Q4FY14. For FY15, net sales of the company grew 6.1% to reach Rs 18209 mn against Rs 17168 mn in FY14. This growth was equally contributed by building products and packaging products segment with each growing at 6.2% and 6.5% respectively. EBITDA grew 28.4% yoy to reach Rs 3053 mn in FY15 against Rs 2377 mn in FY14. This is on account of decline in power and fuel cost which was partially offset by increase in raw material cost. Building products segment reported EBIT margin of 19% in FY15 against 20.7% in FY14. Packaging products segment reported EBIT margin of 9.1% in FY15 against 1.1% in FY14. PAT stood at Rs 1043 mn in FY15 against Rs 562 mn in FY14, growing by 85.3% yoy. This Source: Company, IndiaNivesh Research
- 2. IndiaNivesh Research May 19, 2015 | 2HSIL Ltd|Result Updates Result Updates (contd...) strong growth was aided by lower growth in interest cost and lower effective tax rate. Revision in FY16E estimates and introducing FY17E estimates Taking into consideration Q4FY15 and FY15 performance, weak demand in building products segment and volatile performance of packaging products segment, we revise our estimates downwards. In our opinion, building products segment performance would pick up going forward with improvement in real estate sector and the government orders flowing for ‘Swachh Bharat Abhiyan’ and ‘Housing For All’. INR continues to be in the favour of the sector reducing the threat of increase in imports. The sector is likely to witness improvement in organised players’ share due to increasing urbanisation, preference for better quality and branded products. Packaging products segment is also likely to perform well in long term with improvement in macroeconomic environment as 60% of the clientele constitutes liquor segment. However, despite all the positive long term outlook we would wait for the company to perform in near term, which appears challenging. We expect net sales / EBITDA / PAT to grow at a CAGR of 12.4% / 13.2% / 25.9% over FY15- FY17E. EPS of the company would reach Rs 18.7 in FY17E from Rs 11.8 in FY15. FY17E New Earlier % Chg Introduction Sales 21616 25935 -16.7 24516 EBITDA 3257 3979 -18.1 3770 PAT 1059 1647 -35.7 1354 EPS 14.6 22.8 -35.7 18.7 EBITDA Margin (%) 15.1 15.3 (27 bps) 15.4 PAT Margin (%) 4.9 6.4 (145 bps) 5.5 FY16E Particulars (Rs Mn) Source: Company, IndiaNivesh Research Valuation At CMP of Rs 396, HSIL trades at PE of 27x and 21.2x its FY16E and FY17E earnings of Rs 14.6 and Rs 18.7 per share respectively. The company's dismal performance is a reflection of bleak demand scenario which is a short term phenomenon in our opinion. The long-term outlook of the building products sector continues to be robust and HSIL should be the key beneficiary in such an event. Packaging products segment has attained breakeven in FY15 and is likely to improve performace going forward. However, near term pressure cannot be overlooked. We have revised our estimates taking into consideration the current scenario and would revisit them post witnessing uptick in demand. One of the key triggers for the stock would be the separation of building products and packaging products business which would reduce the volatility in segmental performance. We revise rating to HOLD from BUY earlier with revised target price of Rs 434 per share. Key risk to our estimates would include increase in power and fuel cost lead by increase in gas prices and continuance of subdued demand. Particulars Methodology EBITDA Multiple Value Building products EV/EBITDA (FY17E) 2,590 12x 31,076 Packaging Products EV/EBITDA (FY17E) 2,006 4x 8,024 Total EV (Rs Mn) 39,099 Net Debt (FY15E) (Rs Mn) 7,718 Market Cap (Rs Mn) 31,382 O/s Shares (mn) 72 Target Price (Rs Per Share) 434 Source: IndiaNivesh Research
- 3. IndiaNivesh Research May 19, 2015 | 3HSIL Ltd|Result Updates Result Updates (contd...) Financial Performance Rs in mn Q4 FY15 Q3 FY15 Q4 FY14 QoQ (%) YoY (%) FY15 FY14 Chg (%) Net sales 5,411 4,555 6,173 18.8 ‐12.3 18,209 17,168 6.1 Raw Materials 2,272 1,504 2,855 51.1 ‐20.4 6,602 5,829 13.2 Power and Fuel 632 725 868 ‐12.9 ‐27.2 2,801 3,770 ‐25.7 Staff cost 542 523 509 3.6 6.5 1,971 1,702 15.8 Other expenditure 1,085 927 1,001 17.1 8.4 3,783 3,489 8.4 Operating Expenses 4,530 3,678 5,232 23.2 ‐13.4 15,156 14,791 2.5 EBITDA 881 877 942 0.5 ‐6.4 3,053 2,377 28.4 EBITDA Margin (%) 16.3% 19.3% 15.3% (297 bps) 103 bps 16.8% 13.8% 292 bps Other Operating Income 178 66 117 167.6 51.6 361 297 21.9 Other Income 5 8 10 ‐32.5 ‐46.4 36 37 ‐3.2 Depreciation 309 318 362 ‐2.7 ‐14.6 1,193 1,057 12.8 Profit bef. Int. & Tax 755 634 707 19.2 6.9 2,258 1,654 36.5 Interest & finance ch. 180 196 184 ‐8.3 ‐2.2 736 679 8.3 Profit before tax 575 438 523 31.4 10.0 1,523 975 56.1 Total tax expenses 177 135 229 31.6 ‐22.7 481 413 16.4 Add/Less: Extraordinary Items 0 0 0 0 0 Net profit 398 303 294 31.4 35.6 1,042 562 85.3 PAT 398 303 294 31.4 35.6 1,042 562 85.3 Effective tax rate 30.8% 30.8% 43.8% 31.6% 42.4% Adj. PAT Margins (%) 7.4% 6.6% 4.8% 70 bps 260 bps 5.7% 3.3% 245 bps EPS 5.5 4.6 4.4 20.0 23.8 14.4 8.5 69.3 Source: Company, IndiaNivesh Research Segmental Performance Rs in mn Q4 FY15 Q3 FY15 Q4 FY14 QoQ (%) YoY (%) FY15 FY14 Chg (%) Revenue (Rs Mn) Building Products 2883 2282 2712 26.4 6.3 9355 8810 6.2 Packaging Products 2705 2339 3577 15.6 ‐24.4 9200 8639 6.5 Others 1 1 1 62.5 0.0 15 16 ‐5.7 Total 5589 4621 6290 20.9 ‐11.1 18570 17465 6.3 EBIT (Rs Mn) Building Products 532 421 624 26.4 ‐14.6 1779 1828 ‐2.7 Packaging Products 336 313 186 7.2 NA 839 99 NA Others -1 -2 -2 ‐55.6 ‐50.0 6 6 16.4 Total 868 733 808 18.4 7.4 2625 1933 35.8 EBIT Margin (%) Building Products 18.5 18.5 23.0 ‐ (453 bps) 19.0 20.7 (173 bps) Packaging Products 12.4 13.4 5.2 (97 bps) 724 bps 9.1 1.1 797 bps Others -61.5 -225.0 -123.1 NA NA 43.2 35.0 NA Source: Company, IndiaNivesh Research
- 4. IndiaNivesh Research May 19, 2015 | 4HSIL Ltd|Result Updates Result Updates (contd...) Consolidated Financial Statements Income statement Y E March (Rs m) FY 13 FY 14 FY 15E FY 16E FY 17E Net sales 17367 18279 19421 21616 24516 Growth % 20.1 5.3 6.2 11.3 13.4 Expenditure 15026 16049 16481 18359 20746 Raw Material 5428 6475 7315 8329 9346 Power and Fuel 4037 3770 2801 3026 3432 Employee 1822 1884 2160 2378 2697 Others 3739 3919 4205 4626 5271 EBITDA 2341 2230 2940 3257 3770 Growth % 0.7 ‐4.7 31.8 10.8 15.7 EBITDA Margin % 13.5 12.2 15.1 15.1 15.4 Other Income 284 341 421 442 464 Depreciation and amortisation 932 1101 1250 1318 1376 EBIT 1693 1470 2111 2381 2858 EBIT Margin % 9.7 8.0 10.9 11.0 11.7 Interest 694 718 775 777 807 Exceptional/Extraordinary item 237 0 0 0 0 PBT 1236 752 1335 1604 2051 PBT Margin % 7.1 4.1 6.9 7.4 8.4 Tax 415 412 481 545 697 Effective tax rate % 34 55 36 34 34 PAT 820 340 854 1059 1354 Adj. PAT 584 340 854 1059 1354 Growth% ‐37.6 ‐41.8 151.4 23.9 27.8 Adj. PAT Margin % 3.4 1.9 4.4 4.9 5.5 Balance sheet Y E March (Rs m) FY 13 FY 14 FY 15E FY 16E FY 17E Share Capital 132 132 145 145 145 Reserves & Surplus 10131 10151 13086 13849 14906 Net Worth 10263 10283 13231 13994 15051 Total debt 10341 11330 7969 7769 8069 Net defered tax liability 1141 1154 1045 1045 1045 Total Liabilities 21745 22767 22245 22807 24165 Gross Fixed Assets 19430 20704 22777 23177 24177 Less Depreciation 4384 5510 6761 7944 9319 Capital Work in Progress 622 1195 200 500 500 Net Fixed Assets 15668 16388 16217 15733 15359 Investments 108 109 109 109 109 Current Assets 9924 10245 9984 11546 13597 Inventories 4067 4443 4744 5404 6129 Sundry Debtors 3893 4192 4138 4755 5516 Cash & Bank Balance 820 603 251 442 932 Loans & advances 1112 968 816 908 981 Other Current assets 32 39 35 37 39 Current Liabilities & provisions 3955 3975 4065 4580 4900 Net Current Assets 5969 6270 5919 6965 8697 Mis Exp not written off 0 0 0 0 0 Total assets 21745 22767 22245 22807 24165 Cash Flow Y E March (Rs m) FY 13 FY 14 FY 15E FY 16E FY 17E PBT 1236 752 1335 1604 2051 Adjustment for: Depreciation 932 1101 1250 1318 1376 Others 393 715 775 777 807 Changes in working capital -1912 -787 -156 -1000 -1254 Tax expenses -343 -157 -481 -545 -697 Cash flow from operations 306 1624 2723 2154 2283 Capital expenditure -1204 -1925 -1079 -700 -1000 Free Cash Flow ‐898 ‐300 1645 1454 1283 Others 450 39 38 0 0 Cash flow from investments ‐755 ‐1886 ‐1040 ‐700 ‐1000 Interest -673 -721 -775 -777 -807 Loans availed or (repaid) 1410 997 -3361 -200 300 Proceeds from Issue of shares (incl share premium) 0 0 2390 0 0 Dividend paid (incl tax) -229 -231 -296 -296 -296 Cash flow from Financing 508 45 ‐2043 ‐1273 ‐803 Net change in cash 60 -217 -360 181 480 Cash at the beginning of the year 706 766 549 189 370 Cash at the end of the year 766 549 189 370 851 Other Bank Balances 54 54 62 71 82 Cash as per Balance Sheet 820 603 251 442 932 Key ratios Y E March FY 13 FY 14 FY 15E FY 16E FY 17E Adj. EPS (Rs) 8.8 5.1 11.8 14.6 18.7 Cash EPS (Rs) 26.5 21.8 29.1 32.9 37.8 BVPS 155.4 155.7 183.0 193.6 208.2 DPS (Rs) 3.0 3.0 3.5 3.5 3.5 Adj. P/E (x) 44.8 77.0 33.5 27.0 21.2 P/CEPS (x) 14.9 18.2 13.6 12.0 10.5 P/BV (x) 2.5 2.5 2.2 2.0 1.9 EV/EBITDA(x) 48.8 51.7 41.6 37.4 32.3 M cap/sales (x) 1.5 1.4 1.5 1.3 1.2 ROCE 8.7 7.0 9.9 11.1 12.7 ROE 8.2 3.3 7.3 7.8 9.3 Inventory (days) 74.9 85.0 86.3 85.7 85.9 Debtors (days) 66.5 80.7 78.3 75.1 76.5 Trade Payables (days) 29.8 31.2 27.8 26.9 27.5 Total Asset Turnover (x) 0.7 0.7 0.7 0.8 0.9 Fixed Asset Turnover (x) 1.1 1.1 1.2 1.4 1.6 Debt/equity (x) 1.0 1.1 0.6 0.6 0.5 Debt/ebitda (x) 4.4 5.1 2.7 2.4 2.1 Interest Coverage (x) 2.4 2.0 2.7 3.1 3.5 Dividend Yield % 0.8 0.8 0.9 0.9 0.9Source: Company, IndiaNivesh Research
- 5. IndiaNivesh Research May 19, 2015 | 5HSIL Ltd|Result Updates Result Updates (contd...) IndiaNivesh Research is also available on Bloomberg INNS, Thomson First Call, Reuters and Factiva INDNIV. IndiaNivesh Securities Private Limited 601 & 602, Sukh Sagar, N. S. Patkar Marg, Girgaum Chowpatty, Mumbai 400 007. Tel: (022) 66188800 / Fax: (022) 66188899 e-mail: research@indianivesh.in | Website: www.indianivesh.in Disclaimer: This document has been prepared by IndiaNivesh Securities Private Limited (“INSPL”), for use by the recipient as information only and is not for circulation or public distribution. INSPL includes subsidiaries, group and associate companies, promoters, employees and affiliates. INSPL researches, aggregates and faithfully reproduces information available in public domain and other sources, considered to be reliable and makes them available for the recipient, though its accuracy or completeness has not been verified by INSPL independently and cannot be guaranteed. The third party research material included in this document does not represent the views of INSPL and/or its officers, employees and the recipient must exercise independent judgement with regard to such content. This document has been published in accordance with the provisions of Regulation 18 of the Securities and Exchange Board of India (Research Analysts) Regulations, 2014. This document is not to be altered, transmitted, reproduced, copied, redistributed, uploaded or published or made available to others, in any form, in whole or in part, for any purpose without prior written permission from INSPL. This document is solely for information purpose and should not to be construed as an offer to sell or the solicitation of an offer to buy any security. Recipients of this document should be aware that past performance is not necessarily a guide for future performance and price and value of investments can go up or down. The suitability or otherwise of any investments will depend upon the recipients particular circumstances. INSPL does not take responsibility thereof. The research analysts of INSPL have adhered to the code of conduct under Regulation 24 (2) of the Securities and Exchange Board of India (Research Analysts) Regulations, 2014. This document is based on technical and derivative analysis center on studying charts of a stock’s price movement, outstanding positions and trading volume, as opposed to focusing on a company’s fundamentals and, as such, may not match with a report on a company’s fundamentals. Nothing in this document constitutes investment, legal, accounting and/or tax advice or a representation that any investment or strategy is suitable or appropriate to recipients’ specific circumstances. INSPL does not accept any responsibility or whatever nature for the information, assurances, statements and opinion given, made available or expressed herein or for any omission or for any liability arising from the use of this document. Opinions expressed are our current opinions as of the date appearing on this document only. The opinions are subject to change without any notice. INSPL directors/employees and its clients may have holdings in the stocks mentioned in the document. This report is based / focused on fundamentals of the Company and forward-looking statements as such, may not match with a report on a company’s technical analysis report Each of the analysts named below hereby certifies that, with respect to each subject company and its securities for which the analyst is responsible in this report, (1) all of the views expressed in this report accurately reflect his or her personal views about the subject companies and securities, and (2) no part of his or her compensation was, is, or will be, directly or indirectly, related to the specific recommendations or views expressed in this report: Daljeet S Kohli, Amar Maurya, Abhishek Jain, Yogesh Hotwani, Prerna Jhunjhunwala, Kaushal Patel, Rahul Koli, Tushar Manudhane & Dharmesh Kant. Following table contains the disclosure of interest in order to adhere to utmost transparency in the matter: INSPL, its affiliates, directors, its proprietary trading and investment businesses may, from time to time, make investment decisions that are inconsistent with or contradictoryto the recommendations expressed herein. The views contained in this document are those of the analyst, and the company may or may not subscribe to all the views expressed within. This information is subject to change, as per applicable law, without any prior notice. INSPL reserves the right to make modifications and alternations to this statement, as may be required, from time to time. Definitions of ratings BUY. We expect this stock to deliver more than 15% returns over the next 12 months. HOLD. We expect this stock to deliver -15% to +15% returns over the next 12 months. SELL. We expect this stock to deliver <-15% returns over the next 12 months. Our target prices are on a 12-month horizon basis. Other definitions NR = Not Rated. The investment rating and target price, if any, have been arrived at due to certain circumstances not in control of INSPL CS = Coverage Suspended. INSPL has suspended coverage of this company. UR=Under Review. Such e invest review happens when any developments have already occurred or likely to occur in target company & INSPL analyst is waiting for some more information to draw conclusion on rating/target. NA = Not Available or Not Applicable. The information is not available for display or is not applicable. NM = Not Meaningful. The information is not meaningful and is therefore excluded. Research Analyst has not served as an officer, director or employee of Subject Company One year Price history of the daily closing price of the securities covered in this note is available at www.nseindia.com and www.economictimes.indiatimes.com/markets/stocks/stock-quotes. (Choose name of company in the list browse companies and select 1 year in icon YTD in the price chart) Home Disclosure of Interest Statement 1. Details of business activity of IndiaNivesh Securities Private Limited (INSPL) INSPL is a Stock Broker registered with BSE, NSE and MCX - SX in all the major segments viz. Cash, F & O and CDS segments. INSPL is also a Depository Participant and registered with both Depository viz. CDSL and NSDL. Further, INSPL is a Registered Portfolio Manager and is registered with SEBI. 2. Details of Disciplinary History of INSPL No disciplinary action is / was running / initiated against INSPL 3. Details of Associates of INSPL 4. Research analyst or INSPL or its relatives'/associates' financial interest in the subject No (except to the extent of shares held by Research analyst or INSPL or its relatives'/associates') company and nature of such financial interest 5. Research analyst or INSPL or its relatives'/associates' actual/beneficial ownership of 1% or more in securities of the subject company, at the end of the month immediately preceding the date of publication of the document. 6. Research analyst or INSPL or its relatives'/associates' any other material conflict of interest at the time of publication of the document No 7. Has research analyst or INSPL or its associates received any compensation from the subject company in the past 12 months No 8. Has research analyst or INSPL or its associates managed or co-managed public offering of securities for the subject company in the past 12 months No 9. Has research analyst or INSPL or its associates received any compensation for investment banking or merchant banking or brokerage services from the subject company in the past 12 months No 10. Has research analyst or INSPL or its associates received any compensation for products or services other than investment banking or merchant banking or brokerage services from the subject company in the past 12 months No 11. Has research analyst or INSPL or its associates received any compensation or other benefits from the subject company or third party in connection with the document. No 12. Has research analyst served as an officer, director or employee of the subject company No 13. Has research analyst or INSPL engaged in market making activity for the subject company No 14. Other disclosures No Please refer to the important 'Stock Holding Disclosure' report on the IndiaNivesh website (investment Research Section - http://www.indianivesh.in/Admin/Upload/635615016831250000_Stock%20Holding%20Disclosure%20list%20as%20on%20February%2028%202015.pdflink). Also, please refer to the latest update on respective stocks for the disclosure status in respect of those stocks. INSPL and its affiliates may have investment positions in the stocks recommended in this report. Please refer to the important 'Stock Holding Disclosure' report on the IndiaNivesh website (investment Research Section - http://www.indianivesh.in/Admin/Upload/635615016831250000_Stock%20Holding%20Disclosure%20list%20as%20on%20February%2028%202015.pdflink). Also, please refer to the latest update on respective stocks for the disclosure status in respect of those stocks. INSPL and its affiliates may have investment positions in the stocks recommended in this report.