SlideShare a Scribd company logo
1 of 43
4/3/09+- Version for NBER WP & 7/20/09 *

                   Global Climate Policy Architecture:
  Specific Formulas and Emission Targets for All Countries in all Decades
                          Jeffrey Frankel, Harpel Professor, Harvard University
                    For the Harvard Project on International Climate Agreements,
                               Directed by Joe Aldy and Rob Stavins

The author would like especially to thank Valentina Bosetti of FEEM who produced, by means of
the WITCH model, all the simulations of the effects of my formulas, thereby bringing hitherto-
abstract ideas to life. This paper literally could not have been written without her. He would
like to thank Joe Aldy and Robert Stavins of the Harvard Project on International Climate
Agreements for encouraging and supporting this line of research. For comments and
suggestions on the outcome he would like to thank John Deutch, Robert Keohane, Warwick
McKibben, Oyebola Olabisi, Rob Stavins, Jonathan Weiner, and an anonymous reviewer. The
author would further like to thank for partial support the Sustainability Science Program, funded
by the Italian Ministry for Environment, Land and Sea, at the Center for International
Development at Harvard University.
* A mistake in the EU targets reported in the 2nd and 3rd panels of Table 1 , p.35-36 , of the NBER WP has been corrected here.


                                                            Abstract
          This paper analyzes a detailed plan to set quantitative national limits on emissions of
greenhouse gases, following along the lines of the Kyoto Protocol. It is designed to fill in the
most serious gaps: the absence of targets extending as far as 2100, the absence of participation
by the United States and developing countries, and the absence of reason to think that countries
will abide by commitments. The plan elaborates on the idea of a framework of formulas that can
assign quantitative limits across countries, one budget period at a time. Unlike other century-long
paths of emission targets that are based purely on science (concentration goals) or ethics (equal
rights per capita) or economics (cost-benefit optimization), this plan is based partly on politics.
Three political constraints are particularly important. (1) Developing countries are not asked to
bear any cost in the early years. (2) Thereafter, they are not asked to make any sacrifice that is
different in kind or degree than was made by those countries that went before them, with due
allowance for differences in incomes. (3) No country is asked to accept an ex ante target that
costs it more than, say, 1% of GDP in present value, or more than, say, 5% of GDP in any single
budget period. They would not agree to ex ante targets that turned out to have such high costs,
nor abide by them ex post. An announced target path that implies a future violation of these
constraints will not be credible, and thus will not provide the necessary signals to firms today.
          The idea is that (i) China and other developing countries are asked to accept targets at
BAU in the coming budget period, the same in which the US first agrees to cuts below BAU; and
(ii) all countries are asked to make further cuts in the future in accordance with a formula which
sums up a Progressive Reductions Factor, a Latecomer Catch-up Factor, and a Gradual
Equalization Factor. The paper tries out specific values for the parameters in the formulas
(parameters that govern the extent of progressivity and equity, and the speed with which
latecomers must eventually catch up). The resulting target paths for emissions are run through
the WITCH model. It does turn out to be possible to achieve the carbon abatement goal
(concentrations of 500 PPM in 2100) while simultaneously obeying the economic/political


                                                                                                                                  1
constraint (no country suffers a disproportionate loss in GDP). Preliminary efforts to achiefve a
target of 450 ppm have so far been unable to do so without violating the cost constraint.


                                                                                                2
Global Climate Policy Architecture:
 Specific Formulas and Emission Targets for All Countries in All Decades


        This paper analyzes a framework of formulas that produce precise numerical
targets for emissions of carbon dioxide (CO2) in all regions of the world in all decades of
this century. The formulas are based on pragmatic judgments about what is possible
politically. The reason for this approach is a belief that many of the usual science-based,
ethics-based, and economics-based paths are not dynamically consistent: That is, it is not
credible that successor governments will be able to abide by the commitments that
today’s leaders make.
        The formulas analyzed here are driven by seven political axioms:
    1. The United States will not commit to quantitative targets if China and other major
        developing countries do not commit to quantitative targets at the same time, due
        to concerns about economic competitiveness and carbon leakage.
    2. China and other developing countries in the very short run will not make
        economic sacrifices, especially because the United States has not done so.
    3. China and other developing countries, even in the longer run, will not make
        sacrifices different in character from those made by richer countries that have
        gone before them.
    4. In the long run, no country can be rewarded for having “ramped up” its emissions
        well above 1990 levels before joining.
    5. No country will agree to participate if its expected cost during the course of the
        21st century (in present discounted value) is more than Y, where Y is for now set at
        1 percent of gross domestic product (GDP).
    6. No country will abide by targets that cost it more than X in any particular period,
        where X is for now set at 5 percent of GDP.
    7. If one major country drops out, others will become discouraged and the system
        may unravel.

     The targets are formulated assuming the following framework. Between now and
2050, the European Union follows the path laid out in the January 2008 European
Commission Directive; the United States follows the path in recent legislative bills
associated with Senator Joseph Lieberman; and Japan, Australia and Korea follow
statements that their own leaders have recently made. China, India and other countries
agree immediately to quantitative greenhouse gas (GHG) emission targets, which in the
first decades merely copy their business-as-usual (BAU) paths, thereby precluding
leakage. These countries are not initially expected to cut emissions below their BAU
trajectory.
     When the time comes for these countries to join mitigation efforts—perhaps when
they cross certain thresholds—their emission targets are determined using a formula that
incorporates three elements: a Progressive Reductions Factor, a Latecomer Catch-up
Factor, and a Gradual Equalization Factor. These factors are designed to persuade the
developing countries that they are only being asked to do what is fair in light of actions
already taken by others. In the second half of the century, the formula that determines
the emissions path for industrialized countries is dominated by the Gradual Equalization


                                                                                             3
Factor. But developing countries, which will still be in earlier stages of participation and
thus will have departed from their BAU paths only relatively recently, will still follow in
the footsteps of those who have gone before. This means that their emission targets will
be set using the Progressive Reductions Factor and the Latecomer Catch-up Factor, in
addition to the Gradual Equalization Factor. The glue that holds the agreement together
is that every country has reason to feel that it is only doing its fair share.

    We use the WITCH model to analyze the results of this approach in terms of
projected paths for emissions targets, permit trading, the price of carbon, GDP costs, and
environmental effects. Overall economic costs, discounted (at 5 percent), average 0.24
percent of GDP. No country suffers a discounted loss of more than 1 percent of GDP
overall from the agreement, nor more than 5 percent of GDP in any given period.
Atmospheric CO2 concentrations level off at 500 parts per million (ppm) in the latter part
of the century. (The next phase of this research aims for a target of 450 ppm.)

The problem

        There are by now many plans for a post-Kyoto climate change regime, even if one
considers only those that accept the basic Kyoto approach of quantitative, national-level
limits on GHG emissions accompanied by international trade in emissions permits. The
Kyoto targets applied only to the budget period 2008–2012, which is now upon us, and
only to a minority of countries (in theory, the industrialized countries). The big task is
to extend quantitative emissions targets through the remainder of the century and to other
countries—especially the United States, China, and other developing countries.

        Virtually all the other plans for a post-Kyoto agreement are either based on
scientific environmental objectives (e.g., stabilizing atmospheric CO2 concentrations at
450 ppm in 2100), ethical or philosophical considerations (e.g., the principle that every
individual on earth has equal emission rights), or economic cost-benefit analyses
(weighing the economic costs of abatement against the long-term environmental
benefits).1 This paper analyzes a path of emission targets for all countries and for the
remainder of the century that is intended to be more practical than others that have been
put forward, in that it is also based on political considerations, rather than on science or
ethics or economics alone.2

        The industrialized countries did, in 1997, agree to quantitative emissions targets
for the Kyoto Protocol’s first budget period, so in some sense we know that it can be
done. But the obstacles are enormous. For starters, most of the Kyoto signers will
probably miss their 2008–2012 targets, and of course the United States never even

1
  An important example of the science-based approach is Wigley (2007). An important example
of the cost-benefit-based approach is Nordhaus (1994, 2006). An important example of the
rights-based approach is Baer et al. (2008).
2
  Aldy, Barrett, and Stavins (2003) and Victor (2004) review a number of existing proposals.
Numerous others have offered their own thoughts on post-Kyoto plans, at varying levels of detail,
including Aldy, Orszag, and Stiglitz (2001); Barrett (2006); Nordhaus (2006); and Olmstead and
Stavins (2006).


                                                                                               4
ratified. At multilateral venues such as the United Nations Framework Convention on
Climate Change (UNFCCC) meeting in Bali (2007) and the Group of Eight (G8) meeting
in Hokkaido (July 2008), world leaders have (just barely) been able to agree on a broad
long-term goal of cutting total global emissions in half by 2050. But these meetings did
not come close to producing agreement on who will cut how much, not to mention
agreement on multilateral targets within a near-enough time horizon that the same
national leaders are likely to still be alive when the abatement commitment comes due.
To quote Al Gore (1993, p.353), “politicians are often tempted to mke a promise that is
not binding and hpe for some unexpectedly easy way to keep the promise.” For this
reason, the aggregate targets endorsed so far cannot be viewed as anything more than
aspirational.

        Moreover, nobody has ever come up with an enforcement mechanism that
simultaneously has sufficient teeth and is acceptable to member countries. Given the
importance countries place on national sovereignty it is unlikely that this will change.3
Hopes must instead rest on weak enforcement mechanisms such as the power of moral
suasion and international opprobrium. It is safe to say that in the event of a clash
between such weak enforcement mechanisms and the prospect of a large economic loss
to a particular country, aversion to the latter would win out.


Necessary aspects of a workable successor to Kyoto

       I have suggested six attributes4 that any successor-agreement to the Kyoto
Protocol would have to deliver:

•   More comprehensive participation—specifically, getting the United States, China,
    and other developing counties to join the system of quantitative emission targets.
•   Efficiency—incorporating market-flexibility mechanisms such as international permit
    trading and providing advance signals to allow the private sector to plan ahead, to the
    extent compatible with the credibility of the signals.
•   Dynamic consistency—addressing the problem that announcements about steep cuts
    in 2050 are not credible. The lack of credibility stems from two sources. First, it is
    known that today’s leaders cannot bind their successors. Second, the projected failure
    of most Kyoto signatories to meet their first-period emission targets makes the lack of
    seriousness at a global level painfully obvious.
•   Equity—developing countries point out that industrialized countries created the
    problem of global climate change, while poor countries account for only about 20
    percent of the CO2 that has accumulated in the atmosphere from industrial activity
    over the past 150 years (though admittedly this is changing rapidly). From an equity
    standpoint, developing countries argue that it is not appropriate to ask them to limit
3
  The possibility of trade sanctions is probably the only serious proposal for penalizing non-
participation. But such penalties are not currently being considered at the multilateral level.
(See Frankel, 2009, however, and references therein).
4
  Frankel (2007). Similar lists are provided by Bowles and Sandalow (2001), Stewart and
Weiner (2003), and others.


                                                                                                  5
their economic development to pay for a climate-change solution; moreover, they do
    not have the capacity to pay for emissions abatement that richer countries do. Finally,
    many developing countries place greater priority on raising their people’s current
    standard of living (including reducing local air and water pollution). These countries
    might reasonably demand quantitative targets that reflect an equal per capita
    allotment of emissions, on equity grounds, even waiving any claims to reparations for
    the disproportionate environmental damages that can be expected to fall on them.
•   Compliance —recognizing that no country will join a treaty if it entails tremendous
    economic sacrifice and that therefore compliance cannot be reasonably expected if
    costs are too high. Similarly, no country, if it has already joined the treaty, will
    continue to stay in during any given period if staying in means huge economic
    sacrifice, relative to dropping out, in that period.
•   Robustness under uncertainty—recognizing that the relationship between cost and
    compliance applies not just to ex ante calculations based on current expectations, but
    also ex post, when future growth rates and other uncertain economic and
    technological variables become known.


    Unlike the Kyoto Protocol, the plan analyzed in this paper brings all countries into an
international policy regime on a realistic basis and looks far into the future. But we
cannot pretend to see with as fine a degree of resolution at a century-long horizon as we
can at a five- or ten-year horizon. Fixing precise numerical targets a century ahead is
impractical. Rather, we need a century-long sequence of negotiations, fitting within a
common institutional framework that builds confidence as it goes along. The framework
must have enough continuity so that success in the early phases builds members’
confidence in each other’s compliance commitments and in the fairness, viability, and
credibility of the process. Yet the framework must be flexible enough that it can
accommodate the unpredictable fluctuations in economic growth, technology
development, climate, and political sentiment that will inevitably occur. Only by
striking the right balance between continuity and flexibility are there grounds for hope
that a framework for addressing climate change would last a century or more.

    An example of such a framework in another policy area is the General Agreement on
Tariffs and Trade, which emerged after World War II and provided the basis for 50 years
of successful multilateral negotiations to liberalize international trade, culminating in the
founding of the World Trade Organization. Nobody at the beginning could have
predicted the precise magnitude or sequence of reforms to various trade barriers, or what
sectors or countries would be included. But the early stages of negotiation worked, and
so confidence in the process built, more and more countries joined the club, and
progressively more ambitious rounds of liberalization were achieved.
        Another analogy would be with the process of European economic integration,
culminating in the formation of the European Economic and Monetary Union. Despite
ambitions for more comprehensive integration, nobody at the time of the founding of the
European Coal and Steel Community, or the subsequent European Economic
Community, could have forecast the speed, scope, magnitude, or country membership


                                                                                            6
that this path of integration would eventually take. The idea would be to do the same
with the UNFCCC.


    Political constraints

        This paper takes as axiomatic the following six claims regarding political
feasibility.
1. The United States will not commit to quantitative targets if China and other major
    developing countries do not commit to quantitative targets at the same time, though
    this leaves completely open the initial level and future path of the targets. Any plan
    will be found unacceptable if it leaves the less developed countries free to exploit
    their lack of GHG regulation for “competitive” advantage at the expense of the
    participating countries’ economies and leads to emissions leakage at the expense of
    the environmental goal.
2. China, India, and other developing countries will not make sacrifices they view as
        a. fully contemporaneous with rich countries,
        b. different in character from those made by richer countries who have gone
             before them,
        c. preventing them from industrializing,
        d. failing to recognize that richer countries are in a position to make greater
             economic sacrifices than poor countries to address the problem (all the more
             so because rich countries’ past emissions have created the problem), or
        e. failing to recognize that the rich countries have benefited from an “unfair
             advantage” in being allowed to achieve levels of per capita emissions that are
             far above those of the poor countries.
3. In the short run, emission targets for developing countries must be computed relative
    to current levels or BAU paths; otherwise the economic costs will be too great for the
    countries in question to accept. 5 But in the longer run, no country can be rewarded
    for having "ramped up” emissions far above 1990 levels, the reference year agreed to
    at Rio and Kyoto. Fairness considerations aside, if post-1990 increases are
    permanently “grandfathered,” then countries that have not yet agreed to cuts will have
    a strong incentive to ramp up emissions in the interval before they join. Of course
    there is nothing magic about 1990 but, for better or worse, it is the year on which
    Annex I countries have long based planning.
4. No country will accept a path of targets that is expected to cost it more than Y percent
    of GDP throughout the 21st century (in present discounted value), where Y is for now
    set at 1 percent.
5. No country will accept targets in any period that are expected to cost more than X
    percent of GDP to achieve during that period; alternatively, even if targets were
    already in place, no country will in the future actually abide by them if it finds the
    cost to do so would exceed X percent of GDP. In this paper, GDP losses are defined
    relative to what would happen if the country in question had never joined. An
    alternative would be to define GDP losses in a future period relative to what would


5
    Cuts expressed relative to BAU have been called “Action Targets” (Baumert and Goldberg 2006).


                                                                                                    7
happen if the country were to drop out in that period, after decades of participation.
   For now, I set X at 5 percent.
6. If one major country drops out, others will become discouraged and may also fail to
   meet their own targets, and the framework may unravel. If such unraveling in a
   future decade is foreseeable at the time that long-run commitments are made, then
   those commitments will not be credible from the start. Firms, consumers, and
   researchers base their current decisions to invest in plant and equipment, consumer
   durables, or new technological possibilities on the expected future price of carbon: If
   government commitments are not credible from the start, then they will not raise the
   expected future carbon price. The reason for this political approach is the belief that
   many emissions pathways designed on the basis of scientific or economic analyses
   are not dynamically consistent: That is, it is not credible that successor governments
   will be able to abide by the commitments that today’s leaders make.

Squaring the circle

    Of the above propositions, even the first and second alone seem to add up to a
hopeless “Catch-22”: Nothing much can happen without the United States, the United
States will not proceed unless China and other developing countries start at the same
time, and China will not start until after the rich countries have gone first.
    There is only one possible solution, only one knife-edge position that satisfies the
constraints. At the same time that the United States agrees to binding emission cuts in
the manner of Kyoto, China and other developing countries agree to a path that
immediately imposes on them binding emission targets—but these targets in their early
years simply follow the BAU path. The idea of committing to only BAU targets in the
early decades will provoke outrage from both environmentalists on one side and business
interests in developed countries on the other. But both sides might come to realize that
this commitment is far more important than it sounds: It precludes the carbon leakage
which, absent such an agreement, will undermine the environmental goal and it
moderates the competitiveness concerns of carbon-intensive industries in the rich
countries. This approach recognizes that it would be irrational for China to agree to
substantial actual cuts in the short term. Indeed China might well react with outrage at
being asked to take on binding targets of any kind at the same time as the United States.
But China may also come to realize that it would actually gain from such an agreement,6
by acquiring the ability to sell emission permits at the same world market price as
developed countries (as opposed to the lower prices China has received for lower-quality
project credits under the Kyoto Protocol’s Clean Development Mechanism [CDM] or
joint implementation [JI] provisions).

       In later decades, the formulas do ask substantially more of the developing
countries. But these formulas also obey basic notions of fairness, by (1) asking for cuts
6
  A number of authors have pointed out that developing countries actually stand to gain economically in the
short run by accepting targets and then selling permits, including the Council of Economic Advisers (1998),
Keohane and Raustiala (2008), and Seidman and Lewis (2009). Of course this only works when the
permits allocated to developing countries are sufficiently generous (i.e., do not reflect a significant
abatement obligation), as is reasonable in the short run, but which the developing countries cannot expect
in the long run.


                                                                                                         8
that are analogous in magnitude to the cuts made by others who began abatement earlier
and (2) making due allowance for developing countries’ low per capita income and
emissions and for their baseline of rapid growth. These ideas were developed in earlier
papers (see Frankel 1999, 2005, and 2007 and Aldy and Frankel 2004) where I suggest
that the formulas used to develop emissions targets incorporate four or five variables:
1990 emissions, emissions in the year of the negotiation, population, and income. One
might perhaps also include a few other special variables such as whether the country in
question has coal or hydroelectric power, though the 1990 level of emissions conditional
on per capita income can largely capture these special variables.

         Here we narrow down the broad family of formulas to a more manageable set,
and then put them into operation to produce specific numerical targets for all countries,
for all five-year budget periods of the 21st century. The formulas are made precise
through the development of three factors: a short-term Progressive Reductions Factor, a
medium-term Latecomer Catch-up Factor, and a long-run Gradual Equalization Factor.
The result is a set of actual numerical targets for all countries for the remainder of the
century (presented in Table 1). These are then fed into the WITCH model, by Valentina
Bosetti, a co-author of that model, to see the economic and environmental consequences.
International trading plays an important role. The framework is flexible enough that one
can tinker with a parameter here or there—for example if the economic cost borne by a
particular country is deemed too high or the environmental progress deemed too low—
without having to abandon the entire formulas framework.

Emission targets for all countries: rules to guide the formulas

        All developing countries that have any ability to measure emissions would be
asked to agree in 2010 to emission targets that do not exceed their projected BAU
baseline trajectory going forward. The objective of getting developing countries
committed to these targets would be to forestall emissions leakage and to limit the extent
to which their firms enjoy a competitive advantage over carbon-constrained competitors
in the countries that have already agreed to targets below BAU under the Kyoto Protocol.
(We expect that the developing countries would, in most cases, receive payments for
permits and thus emit less than their BAU baseline.) Most countries in Africa would
probably be exempted for some decades from any kind of commitment, even to BAU
targets, until they had better capacity to monitor emissions.

        One must acknowledge that BAU paths are neither easily ascertained nor
immutable. Countries may “high-ball” their BAU estimates in order to get more
generous targets. Even assuming that estimates are unbiased, important unforeseen
economic and technological developments could occur between 2010 and 2020 that will
shift the BAU trajectory for the 2020s, for example. Any number of unpredictable
events have already occurred in the years since 1990; they include German reunification,
the 1997–1998 East Asia crisis, the boom in the BRIC countries up until 2008 (Brazil,
Russia, India, and China), the sharp rise in world oil prices up until 2008, and the world
financial crisis of 2007–2009. A first measure to deal with the practical difficulty of
setting the BAU path is to specify in the Kyoto-successor treaty that estimates must be


                                                                                           9
generated by an independent international expert body, not by national authorities. A
second measure, once the first has been assured, is to provide for updates of the BAU
paths every decade. To omit such a provision—that is, to hold countries for the rest of
the century to the paths that had been estimated in 2010—would in practice virtually
guarantee that any country that achieves very high economic growth rates in the future
will eventually drop out of the agreement, because staying in would mean incurring costs
far in excess of 5 percent of GDP. Allowing for periodic adjustments to the BAU
baseline does risk undermining the incentive for carbon-saving investments, on the logic
that such investments would reduce future BAU paths and thus reduce future target
allocations. This risk is the same as the risk of encouraging countries to ramp up their
emissions, which we specified above to be axiomatically ruled out by any viable
framework. That is why the formula gives decreasing weight to BAU in later budget
periods and why I introduce a Latecomer Catch-up Factor (explained below), which
tethers all countries to their 1990 emission levels in the medium run.

        Countries are expected to agree to the next step, quantitative targets that entail
specific cuts below BAU, at a time determined by their circumstances. In our initial
simulations, the choice of year for introducing an obligation to actually cut emissions was
generally guided by two thresholds: when a country’s average per capita income exceeds
$3000 per year and/or when its per capita annual emissions approach 1 ton or more.7
But we found that starting dates had to be further modified in order to satisfy our
constraints regarding the distribution of economic losses.

        As already noted, this approach assigns emission targets in a way that is more
sensitive to political realities than is typical of other target paths which are constructed
either on the basis of a cost-benefit optimization or to deliver a particular environmental
and/or ethical goal. Specifically, numerical targets are based (a) on commitments that
political leaders in various key countries have already announced, as of early 2009, and
(b) on formulas designed to assure latecomer countries that the emission cuts they are
being asked to make represent no more than their fair share, in that they correspond to the
sacrifices that other countries before them have already made.
        Finally comes the other important concession to practical political realities: If the
simulation in any period turns out to impose on any country an economic cost of more
than X% of GDP (where X is for the purposes of this analysis is taken to be 5 percent), we
assume that this country drops out. Dropping out could involve either explicit
renunciation of the treaty or massive failure to meet the quantitative targets. For now,
our assumption is that in any such scenario, other countries would follow by dropping out
one by one, and the whole scheme would eventually unravel.8 This unraveling would
occur much earlier if private actors rationally perceived that at some point in the future
major players will face such high economic costs that compliance will break down. In
this case, the future carbon prices that are built into most models’ compliance trajectories
7
  Baer et al. (2008) suggest an income threshold of $7,500 per person per year.
8
  A good topic for future efforts to extend this research is to apply game theory, allowing some relatively
less important countries to drop out without necessarily sinking the whole scheme. That is, if the
economic damage to remaining members arising from the defections, and the environmental damage, were
not too great, remaining countries might continue to participate rather than retaliate by likewise dropping
out.


                                                                                                         10
will lack credibility, private actors will not make investment decisions that reflect those
prices today, based on them, and the effort will fail in the first period. Therefore, our
approach to any scenario in which any major player suffers economic losses greater than
X% would be to go back and adjust some of the parameters of the emission formulas, so
that costs are lower and this is no longer the case.
        We hope by these mechanisms to achieve political viability: non-negative
economic gains in the early years for developing countries, average costs over the course
of the century below 1 percent of GDP per annum, and protection for every country
against losses in any period as large, or larger than, 5 percent of GDP. Only if they
achieve political viability are announcements of future cuts credible. And only credible
announcements of future cuts will send firms the long-term price signals and incentives
needed to guide investment decisions today.

Guidelines from policies and goals already announced by national leaders

        Our model produces country-specific numeric emission targets for every fifth
year: 2012, 2017, 2022, etc. For each five-year budget period, such as the Kyoto period
2008–2012, computations are based on the average of the starting year and ending year.

        The European Union. The EU emissions target for 2008–2012 was agreed at
Kyoto: 8 percent below 1990 levels. In the second 2015–2020 period (for simplicity we
choose the year 2017), the EU target is the one that Brussels announced in January 2008
and confirmed in December 2008:9 namely, 20 percent below 1990 levels. On the one
hand, as with other targets publicly supported by politicians in Europe and elsewhere,
skepticism is appropriate regarding EU member countries’ willingness to make the
sacrifices necessary to achieve this target.10 On the other hand, however, the European
Union’s commitment to this number was not conditional on other countries joining in.
Indeed the European Union has said it would cut emissions 30 percent below 1990 levels
if other countries joined in. So in this sense we are being conservative in choosing the 20
percent target. For the third period (2022–2027), and thereafter up to the eighth period
(2048–2052), the EU targets progress in equal increments to a 50 percent cut below 1990
levels: In other words, targets relative to 1990 emissions start at 25 percent below, and
then progress to 30 percent, 35 percent, 40 percent, 45 percent, and 50 percent below.

        Japan, Canada, and New Zealand. These three countries are assigned the Kyoto
goal of a 6 percent reduction below 1990 levels. Of all ratifiers, Canada is probably the
farthest from achieving its Kyoto goal.11 But Japan dominates this country grouping in
size. We assume that by 2010 the United States has taken genuine measures, which helps
9
 Financial Times, Jan. 2, 2009, p.5.
10
   It is not entirely clear that even Europe will meet its Kyoto targets. Perhaps the European Union will
need to cover its shortfall with purchases of emission permits from other countries. European emissions
were reduced in the early 1990s by coincidental events: Britain moved away from coal under Margaret
Thatcher and Germany with reunification in 1990 acquired dirty power plants that were easy to clean up.
But Americans who claim on this basis that the European Union has not yet taken any serious steps go too
far. Ellerman and Buchner (2007, 26-29) show that the difference between allocations and emissions in
2005 and 2006 was probably in part attributable to abatement measures implemented in response to the
positive price of carbon.


                                                                                                       11
motivate these three countries to get more serious than they have been to date. In a small
concession to realism, we assume that they do not hit the numerical target until 2012
(versus hitting it on average over the 2008–2012 budget period).12
        Japan’s then-Prime Minister, Yasuo Fukuda, on June 9, 2008, announced a
decision to cut Japanese emissions 60–80 percent by mid-century.13 We interpret these
targets as cuts of 10 percent every five years between 2010 and 2050, computed
logarithmically. The cumulative cuts are 80 percent in logarithmic terms, or 51 percent
in absolute terms (i.e., to 49 percent of the year–2010 emissions level).
        The United States. A series of bills to cap US GHG emissions were introduced in
Congress in 2007 and early 2008.14 It is possible that some version of such legislation
might pass by 2010.
        The Bingaman–Specter bill would have reduced emissions to 2006 levels by 2020
and to 1990 levels by 2030, but with a cap or “safety valve” on the price of carbon. The
Lieberman–Warner bill was more aggressive.15 It would have begun by reducing
emissions in 2012 to below 2005 levels and would have tightened the emissions cap
gradually each year thereafter, such that by the year 2050, total emissions would be held
to 30 percent of 2012 levels—in other words, a 70 percent reduction from emissions
levels at the start date of the policy.16 If such a bill were not passed until 2010 or so, the
goal of achieving 2005 levels by 2012 (let alone a 4 percent reduction) would for all
practical purposes be impossible to achieve. The bill’s sponsors would have to adjust
2012 to BAU levels, which are projected to be 39 percent above 1990 levels, or 33
percent logarithmically (i.e., 1990 emissions were 28 percent below current 2012 BAU
projections), so the 2050 target would be 42 percent below 1990 levels.17 A slightly
revised “manager’s” version of the Lieberman–Warner bill earned significant
congressional support in June 2008: Though it did not garner a large enough majority to
become law, the vote was widely considered an important step forward politically for the
activist camp. It was presumed that a new bill in the next session would probably look
similar and, with a new president, would have better chances of success.18
11
    The current government’s plan calls for reducing Canadian emissions in 2020 by 20 percent below 2006
levels (which translates to 2.7 percent below 1990 levels) and in 2050 by 60–70 percent below 2006 levels.
(“FACTBOX – Greenhouse gas curbs from Australia to India,” Sept.5, 2008, Reuters.
www.alertnet.org/thenews/newsdesk/L5649578.htm.)
12
     In 2007, Japanese Prime Minister Shinzo Abe supported an initiative to half global emissions by 2050.
(Financial Times, May 25). But ahead of the 2008 G8 Summit, Japan declined to match the EU’s
commitment to cut its emissions 20 per cent by 2020 (FT, April 24, 2008, p.3).
13
   “Japan Pledges Big Cut in Emissions,” FT, June 10, 2008 p.6;
14
    The bills are conveniently summarized in Table 1A in Hufbauer, Charnovitz and Kim (2009).
15
    S. 2191: America's Climate Security Act of 2007
16
    Section 1201, pages 30-32. (The percentage is measured non-logarithmically.)
17
    See, for example,
http://theclimategroup.org/index.php/news_and_events/news_and_comment/carbon_trading_high_hopes_for_lieberman_warner/ (The number is
54 percent, measured logarithmically. This is the preferred way of defining percentage changes, because a
50 percent increase in emissions followed by a 50 percent reduction gets you back where you started from.
Logarithms are too technical for non-specialist audiences. But measuring changes non-logarithmically has
the undesirable property that a 50 percent increase [to 1.50] followed by a 50 percent reduction [to 0.75]
does not get you back to your starting point [1.00].)
18
   This paper was originally written during the 2008 US presidential election campaign, in which both
major presidential candidates supported GHG reduction measures along the lines of recent congressional
bills. John McCain advocated a 2050 emissions target of 60 percent below 1990 levels, or 66 percent


                                                                                                                                12
If taken at face value, with 2012 emissions returned to 2005 levels or lower, then
the Lieberman–Warner targets would shave off another 13 percent from the target path,
so that emissions in 2050 would be 55 percent below 1990 levels.19 There are three
respects in which it might be naïve to accept these political aspirations at face value.
First, it is not realistic to think that the United States could go from the steady emission
growth rates of 1990–2007 (when emissions increased, on average, by 1.4 percent per
year) to immediate rapid cuts, without passing through an intermediate phase of slowing,
and then peaking or plateauing, before reversing (a trajectory some have called “slow-
stop-reverse”). Second is the point that many voters and politicians who have supported
recent bills in Congress will be unlikely to support the measures that would be needed to
attain the targets contained in those bills in an economically efficient way—that is, by
raising the price of fossil fuels through such measures as a carbon tax or tradable permits.
Third, the Lieberman–Warner target is somewhat more aggressive than Europe’s goal,
measured relative to 1990 emissions, and implies a much more aggressive rate of
emissions decline than Europe’s over the period 2012–2050. So far, American support
for serious action has lagged behind Europe’s.
         On the other hand, if China and other developing countries accept quantitative
targets, as foreseen under this plan, this will boost domestic American support for tough
action. In addition, one could argue that there is more “fat” in US emissions, so one
expects that it would be easier to achieve reductions than in Europe or Japan. The
terminal level of emissions in 2050 under the formula would still probably be
substantially higher than Europe’s, relative to population or GDP.
         We assume that the average annual emissions growth rate is cut in half during the
period 2008–2012, to 0.7 percent per year or 3.5 percent cumulatively, so that emissions
in 2012 are 31.5 percent above 1990 levels.20 At that point, we assume emissions plateau
(growth is held to zero) for the period 2012–2017. Then we implement the rest of the
Lieberman–Warner formula, such that emissions in 2050 reach a level that is 67 percent
below 1990 levels. Using our postponed base this is 98.5 percent below 2012 levels,
logarithmically. Spread over 38 years, this implies sustained reductions of 2.6 percent
per year on average, or 13 percent every five years (which is a more aggressive rate of
reduction than Lieberman–Warner).

        Australia. Canberra has been reluctant to take strong actions because the country
is so dependent on coal. In July of 2008, however, Australian Prime Minister Kevin
Rudd announced plans to cut emissions to 60 percent below 2000 levels by 2050.21 In
the regional groupings of our model, Australia is classified together with South Korea
and South Africa.

below 2005 levels, close to Lieberman–Warner (Washington Post, May 13, 2008, p. A14; and FT, May 13,
2008, p.4). Barack Obama endorsed a more aggressive target of reducing 2050 emissions 80 percent below
1990 levels (FT, Oct. 17, 2008).
19
   That is 67 percent logarithmically. Or a cut of about 62 percent according to J.R. Pegg, Environmental
News Service, October 2007.
20
   That is, 27 percent logarithmically.
21
   A July 16, 2008, government “green paper,” Carbon Pollution Reduction Scheme, reported details on
implementation via a domestic cap-and-trade program. Rudd’s initiative appears to have domestic political
support (The Economist, July 26, 2008, p.52). The government went on to set a target of 15 percent above
1990 levels by 2020 (FT, Jan. 2, 2009, p.5).


                                                                                                      13
Korea and South Africa. Until recently it looked unlikely that any “non-Annex
I” countries would consider taking on serious cuts below a BAU growth path within the
next decade. But in March 2008, the new president of South Korea, Myung-bak Lee,
“tabled a plan to cap emissions at current levels over the first Kyoto period.”22 This was
an extraordinarily ambitious target in light of Korea’s economic growth rate. He also
“vowed his country would slash emissions in half by 2050,”23 like the industrialized
countries—of which Korea is now one. Emissions have risen 90 percent since 1990 and
it is hard to imagine any country applying the brakes so sharply as to switch instantly
from 5 percent annual growth in emissions to zero.24 Perhaps President Lee thinks he
can offset growth in South Korean emissions by paying North Korea to reforest. We
choose to interpret the Korean plan to flatten emissions as covering a period that stretches
out over the next fourteen years, so that in 2022 the level of emissions is the same as in
2007.25
         Meanwhile, South African officials evidently announced in 2008 that its
emissions would peak by 2025 and begin declining by 2030. 26

         China. Getting China to agree to binding commitments is the sine qua non of any
successful post-Kyoto plan. Evidently China has announced plans to start cutting GHG
emissions in 2030. Presumably that means relative to BAU, rather than in absolute
terms.27 Of course 2030 is later than industrialized countries would like. The country is
expected to cross the threshold of 1 ton of emissions per capita around 2014 and the
threshold of $3000 in annual per capita income by 2022. A standard five- or ten-year lag
between treaty signing and budget period would point to a first-cuts budget period around
2024–2027. But persuading Beijing to move the 2030 date up by five years is not as
critical as persuading it to accept some quantitative target in 2010, even if that target only
reflects BAU. The reason is that if China does not adopt some binding target in the near
term, the United States and most developing countries won’t join, and then the entire
enterprise will be undone.

         The key questions thus become (1) how to determine the magnitude of China’s
cuts in its first budget period—that is, for the first period in which it is asked to make cuts
below BAU; (2) how to determine Korea’s cuts in its second budget period; and (3) how
to set targets for everyone else. (The other regions are Latin America—whose stage of

22
   “South Korea Plans to Cap Emissions,” International Herald Tribune, March 21, 2008.
23
    “South Korea: Developing Countries Move Toward Targets,” Lisa Friedman, ClimateWire, Oct. 3, 2008.
24
    This did not stop some environmental groups from criticizing the plan as not sufficiently ambitious.
Such criticisms may give political leaders second thoughts about announcing any specific measures at all,
as opposed to sticking with banal generalities.
25
   One could note, first, that President Lee came to office setting a variety of ambitious goals beyond his
power to bring about, especially for economic growth, and second that his popularity quickly plummeted.
At the time of writing, his ability to persuade his countrymen to take serious measures was in question.
26
   ClimateWire, Oct.3, 2008, op cit. Admittedly, statements from environmental or foreign ministries do
not necessarily carry a lot of weight, if they have not been vetted by finance or economics ministries let
alone issued by heads of government or approved by parliaments,. An example would be Argentina’s
announcement of a target in 1998.
27
   This was China’s position in talks near Berlin with five big emerging nations (China, India, South Africa,
Brazil and Mexico), ahead of the June 2007 G8 summit in Germany, according to Germany’s environment
minister ( FT 3/12/07).


                                                                                                          14
development logically implies going after Korea but before China —Russia, Middle
East/North Africa, Southeast Asia, India/South Asia, and Africa.) Our general guiding
principle is to ask countries only to do what is analogous to what has been done by others
who have gone before them. To put this general principle into practice, we apply three
factors.

Guidelines for formulas that ask developing countries to accept “fair” targets,
analogous to those who have gone before

         This section discusses three factors for determining “fair” emissions targets for
developing countries. The three factors are additive (logarithmically).
         We call the first the Progressive Reductions Factor. It is based on the pattern of
emission reductions (relative to BAU) assigned to countries under the Kyoto Protocol, as
a function of income per capita. This pattern is illustrated in Figure 1, which comes from
the data as they were reported at that time. Other things equal, richer countries are asked
to make more severe cuts relative to BAU, the status quo from which they are departing
in the first period. Specifically, each 1 percent difference in income per capita, measured
relative to EU income in 1997, increases the abatement obligation by 0.14 percent, where
the abatement obligation is measured in terms of reductions from BAU relative to the EU
cuts agreed at Kyoto. Normally, at least in their early budget periods, most countries’
incomes will be below what the Europeans had in 1997, so that this factor dictates milder
cuts relative to BAU than Europe made at Kyoto. In fact the resulting targets are likely to
reflect a “growth path”—that is, they will allow for actual emission increases relative to
the preceding periods. The formula is:
PRF expressed as country cuts vs. BAU
 = EU's Kyoto commitment for 2008 relative to its BAU + .14 * (gap between the country’s
income per capita and the EU’s 2007 income per capita).
The parameter (0.14) was suggested ordinary least squares (OLS) regression estimates on
the data shown in Figure 1. Other parameters could be chosen instead, if the parties to
a new agreement wanted to increase or decrease the degree of progressivity.


                                                                                           15
Figure 1: The Emissions Cuts Agreed at Kyoto Were
Progressive with Respect to Income, when Expressed Relative to BAU

                                                   50%
 Percent reduction from 2010 business-as-usual .


                                                   40%

                                                   30%

                                                   20%

                                                   10%

                                                   0%

                                               -10%

                                               -20%

                                               -30%
                                                   500     1,000    2,000          5,000      10,000     20,000    50,000
                                                   2.699                           3.699                             4.699
                                                              1996 GDP per capita (1987 US dollars, ratio scale)
Sources: The World Bank, the U.S. Energy Information Administration, and national communications to the UNFCCC


        The Latecomer Catch-up Factor is the second element in the formula.
Latecomers are defined as those countries that have not ratified Kyoto or for which Kyoto
did not set quantitative targets. (Perhaps it would also include those like Canada that
ratified the treaty but, based on current trends, are not expected to meet the goal.) The
formula would be badly designed if it rewarded these countries by permanently
readjusting their targets to a higher baseline. Aside from notions of fairness, such re-
basing would give all latecomers an incentive to ramp up their emissions before signing
on to binding targets, or at a minimum would undercut any socially-conscious incentives
they might otherwise introduce to reduce emissions unilaterally in the time period before
they join the system. Thus the Latecomer Catch-up factor is designed to gradually close
the gap between the starting point of the latecomers and their 1990 emission levels. It is
parameterized according to the numbers implicit in the Lieberman bill to bring US
emissions to 70 percent below 1990 levels by 2050 and the Lee goal to flatten South
Korea’s emissions over a period beginning in 2008. In other words, countries are asked
to move gradually in the direction of 1990 emissions in the same way that the United
States and Korea under current plans will have done before them.


                                                                                                                        16
The formula for a country’s Latecomer Catch-up Factor (LCF) is as follows.
Further percentage cuts (relative to BAU plus a Progressive Reductions Factor) are
proportional to how far emissions have been allowed to rise above 1990 levels by the
time the country joins in. That is, it is given by:
    LCF = α + λ percentage gap between country’s lagged emissions and 1990 emissions
The parameter λ represents the firmness with which latecomers are pulled back toward
their 1990 emission levels. The value of λ implicit for Europe at the time the Kyoto
Protocol was negotiated was sufficient to pull the EU-average below its 1990 level. But
to calibrate this formula, the most relevant countries are not European (since the
Europeans are not latecomers), but rather the United States and Korea, since these are the
only countries among those that did not commit themselves to Kyoto targets whose
political leaders have said explicitly what targets they are willing to accept in the second
budget period. The parameters α and λ were chosen as the unique solutions to two
simultaneous equations representing the US target in bills sponsored by Senator
Lieberman and the Korean target (a flattening of emissions being interpreted here as
holding absolute emissions in 2022 equal to 2007 levels). The parameters then work out
to
                                        α = 0.2115 and λ = -0.3400
Thus:

LCF = 0 .2115 -0 .3400 log(country’s current emissions / country’s 1990 emissions) 28

        The third element is the Gradual Equalization Factor (GEF). Even though
developing countries under this plan benefit from delaying abatement efforts until after
the rich countries have begun to act, and face milder reduction requirements, they will
still complain that it is the rich countries that originally created an environmental problem
for which the poor will disproportionately bear the costs, rather than the other way
around. Such complaints are not unreasonable. If we stopped with the first two factors,
the richer countries would be left with the permanent right to emit more GHGs, every
year in perpetuity, which seems unfair.
        In the short run, pointing out the gap in per capita targets is simply not going to
alter the outcome. The poor countries will have to live with it. Calls for the rich
countries to cut per capita emissions rapidly, in the direction of poor-country levels,
ignore the fact that the economic costs of such a requirement would be so astronomical
that no rich country would ever agree to it. The same goes for calls for massive transfer
payments from the rich to the poor (as in a call by the Group of 77 developing countries)
        When one is talking about a lead time of 50 to 100 years, however, the situation
changes. With time to adjust, the economic costs are not as impossibly high, and it is
reasonable to ask rich countries to bear their full share of the burden. Furthermore, over a
time horizon this long some of the poor countries will in any case become rich (and
possible vice versa).


28
  If Korea were to back away from its president’s commitment in light of recent economic
difficulties, but some other important middle-income country were to step up to the plate with
explicit and specific numerical targets, then the calculation could be redone.


                                                                                                 17
Accordingly, during each decade of the second half of the century, the formula
includes an equity factor that moves per capita emissions in each country a small step in
the direction of the global average. This means downward in the case of the rich
countries and upward in the case of the poor countries. Asymptotically, the repeated
application of this factor would eventually leave all countries with equal emissions per
capita, although corresponding national targets would not necessarily converge fully by
2100.29
         The parameter (δ) for the speed of adjustment in the direction of the world
average was initially chosen to match the rate at which the EU’s already-announced goals
for 2045–2050 converge to the world average. This number is δ=0.1 per decade, which
is also very similar to the rate of convergence implicit in the goals set by the Lieberman
bills for the United States during 2045–2050. Thus:

GEF = -0 .1 ( percentage gap between country’s lagged emissions per capita and the world’s).

        We expected to have to adjust the δ parameter, and indeed to add a fourth
parameter for the “aggressiveness” of global emissions targets, in order to ensure that no
single country was confronted with costs above our threshold constraint while still
achieving a relevant global environmental goal in 2100. By lucky coincidence, our initial
method of computing δ satisfied the economic objectives and delivered year-2100
atmospheric CO2 concentrations of 500 ppm. In extensions of this research—where, for
example, we try to hit a year-2100 goal of 450 ppm—we will have to adjust δ and
probably will need to add an aggressiveness parameter, while also adjusting some
countries’ start dates. One possibility is to write an algorithm that searches over these
parameters so as to find values that minimize the threshold of economic cost to any given
country for any given year-2100 environmental goal.


         The formulas are summarized overall as follows:

Log Target (country i, t) = log (BAU i, t ) – (PCF i, t ) + (LCF i, t ) + (GEF i, t ) ,

where the three factors (except in periods when set = 0 as indicated in Table 2) are given by:

PCF i,t = log (emission target EU 2008/ BAU EU 2008)
       + 0.14 log (country i's income/cap t-1 / EU income/cap 2007);
LCF i,t = 0.2115 - 0.3400 log (country i's emissions t-1 / country i's emissions 1990).
GEFi,t = - 0.1 log (country i's emissions per capita t-1 / global average emissions per capita     t-1).


29
  Zhang (2008) and others, motivated by a rights-based approach, propose that countries “contract and
converge” to targets that reflect equal emissions per capita. The Greenhouse Development Rights approach
of Baer et al. (2008), as extended by Cao (2008), emphasizes, from a philosophical standpoint, the
allocation of emission rights at the individual level, though these authors apparently recognize that, in
practice, individual targets would have to be aggregated and implemented at the national level.


                                                                                                      18
The numerical emission target: paths that follow from the formulas

        Table 1, at the end of the chapter, reports the emissions targets produced by the
formulas for each of eleven geographical regions, for every period between now and the
end of the century. We express the emission targets in several terms:
• in absolute tons (which is what ultimately matters for determining economic and
   environmental effects)
• in per capita terms (which is necessary for considering any issues of cross-country
   distribution of burden)
• relative to 1990 levels, which is the baseline used for Kyoto, and which remains
   relevant in our framework in the form of the Latecomer Catch-up term, and
• relative to the BAU path, which is important for evaluating the sacrifice asked of
   individual countries as they join the agreement in the early decades.

        The eleven regions are:
EUROPE = Old Europe and           New Europe
US = United States                       KOSAU = Korea, South Africa, and Australia (3 coal-users)
CAJAZ = Canada, Japan, and New Zealand TE = Russia and other Transition Economies
MENA = Middle East and North Africa      SSA = Sub-Saharan Africa
SASIA= India and the rest of South Asia  CHINA = PRC
EASIA = Smaller countries of East Asia   LACA = Latin America and the Caribbean

         In the first version of this exercise, China sells over a gigaton of carbon in 2040.
Its permit sales fall off thereafter, as its target kicks in; but Southeast Asian countries
take its place, selling similar quantities in the last two decades of the century. Southeast
Asia and sub-Saharan Africa registered rather substantial economic gains toward the end
of the century.30 These gains reflect the benefits of being spared emissions cuts and being
able to sell permits to richer countries during the period when those countries are already
implementing reductions. Some may judge it appropriate that poor countries register net
economic gains from the abatement regime, since these are also the countries that will
bear the heaviest burden from climate change in any case (by virtue of the fact that most
are located nearer the equator and rely on large agricultural sectors). But we judge the
massive international transfers that are implicit in this scenario to be highly unsustainable
politically. They are not necessary in any case to satisfy the key economic and political
constraints laid out at the beginning of this chapter.
         Accordingly, subsequent versions of the exercise assign Southeast Asia and
Africa emission targets somewhat below BAU in the latter half of the century, with the
result that they do not gain so much for the century as a whole. In addition we move
forward by ten years the date at which China is asked to take on below-BAU targets and
by five years the date at which the Middle East and North African (MENA) countries are
asked to do so. An additional reason for this change was to reduce the slackening in
global targets—observable as a dip in the price of carbon—that would otherwise occur
around 2035. Results for the case where the four developing regions are given more
stringent (earlier) targets are given in Tables 1 and 3b, and in the corresponding figures.
Table 2 summarizes the dates at which all countries are asked to take on BAU targets and
30
 Figures 2a-6a and Table 3a here; or Figures 2-8 and Tables 1 and 2 – especially Figure 7 -- in HPICA
Discussion Paper 08-08, October 2008.


                                                                                                        19
then reductions below BAU as governed by the different formula elements discussed
previously (i.e., PRF, LCF, and then GEF).
        The United States, even more than other rich countries, is currently conspicuous
by virtue of its high per capita emissions.31 But its target path peaks after 2010 and then
begins to decline. Emissions in all the rich regions peak by 2015, and then start to
decline. Figure 2a reports aggregate targets for member countries of the Organisation
for Economic Co-operation and Development (OECD). It also shows actual emissions,
which decline more gradually than the targets through 2045 because about 1 million
metric tons (equal to 1 gigaton or Gt) of carbon permits are purchased on the world
market, as is economically efficient, out of roughly 4 Gt. (Permit sales to the richer
countries exceed 1 Gt more often in the version where Southeast Asia and Africa are
never asked for targets below BAU, and China and MENA start cutting emissions below
BAU only at later dates.) Though the OECD countries buy a substantial amount of
reductions in the early decades, it is always less than half their total reductions. The
share falls off sharply in the second half of the century. We assume no banking.


Figure 2a: Emissions path for industrialized countries in the aggregate
-- with later targets for developing countries
(Note: Predicted actual emissions exceed caps by amount of permit purchases)
                                                    OECD Emissions
               7

               6

               5
                                                                                          BA U
       GtC


               4
                                                                                          Simulated Emissions
               3                                                                          CA P

               2

               1

               0
                0


                       0


                              0


                                     0


                                            0


                                                    0


                                                           0


                                                                  0


                                                                         0


                                                                                0
                      2


                             3


                                           5


                                                   6


                                                                 8


                                                                        9


                                                                               0
               1


                                    4


                                                          7
                            0


                                                  0


                                                                              1
              0


                     0


                                   0


                                          0


                                                         0


                                                                0


                                                                       0
             2


                    2


                           2


                                  2


                                         2


                                                 2


                                                        2


                                                               2


                                                                      2


                                                                             2


31
     As shown in Figure 2 of HPICA Discussion Paper 08-08. The figure is omitted here to save space.


                                                                                                       20
Figure 2b: Emissions path for industrialized countries in the aggregate
-- with earlier targets for developing countries
(Note: Predicted actual emissions exceed caps by amount of permit purchases)
                                                           OECD Emis ions
                                                                    s

                  7

                  6

                  5
                                                                                 BA U
         GtC


                  4                                                              Simulated E iss ions
                                                                                            m
                                                                                 CA P
                  3

                  2

                  1

                  0


                                                                            0
                   0


                           5


                                     0


                                               5


                                                        0


                                                                  5


                                                                           0
                  1


                          2


                                    4


                                              5


                                                       7


                                                                 8


                                                                          1
                 0


                         0


                                   0


                                             0


                                                      0


                                                                0
                2


                        2


                                  2


                                            2


                                                     2


                                                               2


                                                                         2
Figure 3a: Emission paths for poor countries in the aggregate
 -- with later targets for developing countries
(Note: Predicted actual emissions fall below caps by amount of permit sales)

                                                   NON OECD Emissions

               20


               13                                                               BAU
       GtC


                                                                                Simulated Emissions
                                                                                CAP

                 7


                 0
                          5


                                  0


                                            5


                                                               5


                                                                        0
                  0


                                                      0
                         2


                                 4


                                           5


                                                              8


                                                                       0
                 1


                                                     7
                0


                        0


                                0


                                          0


                                                             0


                                                                      1
                                                    0
               2


                       2


                               2


                                         2


                                                   2


                                                            2


                                                                     2


                                                                                          21
Figure 3b: Emission paths for poor countries in the aggregate
-- with earlier targets for developing countries
(Note: Predicted actual emissions fall below caps by amount of permit sales)

                                                          NON OECD Emissions

                        20


                                                                        BA U
                        13                                              Simulated Emissions
             GtC


                                                                        CA P

                        7


                        0
                                5


                                                        0


                                                                      0
                       0


                                       0


                                               5


                                                               5
                               2


                                                                     0
                      1


                                      4


                                              5


                                                       7


                                                              8
                              0
                     0


                                     0


                                             0


                                                      0


                                                             0


                                                                    1
                    2


                             2


                                    2


                                            2


                                                     2


                                                            2


                                                                   2


Figure 4a: Emissions path for the world, in the aggregate
-- with later targets for developing countries

                                    World Industrial Carbon Emissions


                   25

                   20                                                            bau

                   15
       GtC


                   10
                                                                                 Sim ulated
                   5                                                             Em is s ions

                   0
                                          0
                5


                           0


                                  5


                                                      5


                                                             0


                                                                    5
               0


                                         5


                                                     6
                          2


                                 3


                                                            8


                                                                   9
              0


                                0


                                        0


                                                    0


                                                           0
                         0


                                                                  0
             2


                        2


                               2


                                       2


                                                   2


                                                          2


                                                                 2


                                                                                       22
Figure 4b: Emissions path for the world, in the aggregate
-- with earlier targets for developing countries

                                        World Industrial Carbon Emissions


                     25                                                                      bau

                     20
            GtC


                     15
                                                                                             Sim ulated
                     10
                                                                                             Em is s ions
                       5

                       0
                              0


                                                      5


                                                               0
                     5


                                      5


                                               0


                                                                       5
                             2


                                                     6
                    0


                                     3


                                              5


                                                              8


                                                                      9
                                                    0
                   0


                            0


                                    0


                                             0


                                                             0


                                                                     0
                  2


                           2


                                   2


                                            2


                                                   2


                                                            2


                                                                    2
         Emissions in the non-rich countries, the TE group (transition economies), MENA,
China, and Latin America all peak in 2040.32 Emissions in sub-Saharan Africa and the
smaller East Asian economies all remain at very low levels throughout the century.
Figure 3a shows that among non-OECD countries overall, both emissions targets and
actual emissions peak in 2040, with the latter substantially below the former. In other
words, the poor countries emit below their targets and sell permits to the rest.
         Total world emissions peak in 2045 at a little above 10 Gt, in the case where
China and MENA are given the later starting points (Figure 4a). They peak ten years
earlier, and without exceeding 10 Gt, in the case where China and MENA are given the
earlier starting points (Firgure 4b). In either case, emissions subsequently decline rather
rapidly, falling below 5 Gt by 2090. Thanks to the post-2050 equalization formula,
emissions per capita converge nicely in the long run, falling to below 1 ton per capita
toward the end of the century.33

Economic and environmental consequences of the numerical targets,
according to the WITCH model
       Estimating the economic and environmental implications of these targets is a
complex task. There are many fine models out there.34 I was fortunate to link up with
the WITCH model of FEEM (Fondazione Eni Enrico Mattei, in Milan), as applied by
Valentina Bosetti.

32
   Figure 2 of HPICA Discussion Paper 08-08.
33
   Figure 2 of HPICA Discussion Paper 08-08.
34
   Researchers have applied a number of different models to estimate the economic and environmental
effects of various specific emission paths; see, for example, Edmonds, Pitcher, Barns, Baron, and Wise
(1992); Edmonds, Kim, McCracken, Sands, and Wise (1997); Hammett (1999); Manne, Mendelsohn, and
Richels (1995); Manne and Richels (1997); McKibbin and Wilcoxen (2006); and Nordhaus (1994, 2008).
Weyant (2001) provides an explanation and comparison of different models.


                                                                                                    23
WITCH (www.feem-web.it/witch) is an energy-economy-climate model
developed by the climate change modeling group at FEEM. The model has been used
extensively in the past three years to analyze the economic impacts of climate change
policies. WITCH is a hybrid top-down economic model with energy sector
disaggregation. Those who might be skeptical of economists’ models on the grounds that
“technology is the answer” can rest assured that technology is central to this model.
(Economists are optimists when it comes to what new technologies might be called forth
by a higher price for carbon, but pessimists when it comes to how much technological
response to international treaties will occur absent an increase in price.) The model
features endogenous technological change via both experience and innovation processes.
Countries are grouped in twelve regions, when Western Europe and Eastern Europe are
counted separately, that cover the world and that strategically interact following a game
theoretic set-up. The WITCH model and detailed structure are described in Bosetti et al.
(2006) and Bosetti, Massetti, and Tavoni (2007).
        Original baselines in many models have been disrupted in recent years by such
developments as stronger-than-expected growth in Chinese energy demand and the
unexpected spike in world oil prices that culminated in 2008. WITCH has been updated
with more recent data and revised projections for key drivers such as population, GDP,
fuel prices, and energy technology characteristics. The base calibration year has been set
at 2005, for which data on socio-economic, energy, and environmental variables are now
available (Bosetti, Carraro, Sgobbi, and Tavoni 2008).


Economic effects

        While economists trained in cost-benefit analysis tend to focus on economic costs
expressed as a percentage of GDP, the politically attuned tend to focus at least as much
on the predicted carbon price, which in turn has a direct impact on the prices of gasoline,
home heating oil, and electric power.35

Figure 5a: Price of Carbon Dioxide Rises Slowly Over 50 Years, then Rapidly
                     -- with later targets for developing countries


                               Price of Carbon Permits


               800
               700
               600
     $/tCO2e


               500
               400                                        FRANKEL
               300                                        Architecture
               200
               100
                 0
                     2005 2020 2035 2050 2065 2080 2095
                                                                                         Zoom on Price of Carbon Permits


                                                                                   140
                                                                                   120
                                                                                   100
                                                                         $/tCO2e


                                                                                   80
35
  Frankel (1998). This attitude may seem irrational to an 60 economist; after all, price effects are largely
                                                                                                     FRANKEL
                                                                                                     Architecture
redistributional. But the public’s instincts may be correct 40
                                                             insofar as predicted price effects are more
                                                            20
reliable indicators of the degree of economic dislocation caused by a carbon policy than GDP losses, which
                                                             0

are subject to larger modeling uncertainty. Furthermore, distributional effects are 2035 drivers of political
                                                                2005   2015   2025
                                                                                      key 2045
support or opposition to a particular policy.


                                                                                                                           24
Figure 5b: Price of Carbon Dioxide Rises Slowly Over 50 Years, then Rapidly
 -- with earlier targets for developing countries
                                      Price of Carbon Permits


                      1000

                       800
            $/tCO2e


                       600
                                                                  FRANKEL
                       400
                                                                  Architecture
                       200

                         0
                             2005 2020 2035 2050 2065 2080 2095
                                                                                                        Zoom on Price of Carbon Permits


                                                                                           180
                                                                                           160
                                                                                           140
                                                                                           120


                                                                                 $/tCO2e
                                                                                           100
                                                                                            80                                            FRANKEL
                                                                                            60                                            Architecture
                                                                                            40
                                                                                            20
                                                                                             0
                                                                                                 2005   2015     2025     2035     2045


         Based on the WITCH simulations conducted for this analysis, the world price of
CO2 surpasses $20 per ton in 2015, as Figure 5 shows. It is then flat until 2030, as a
consequence of the assumption that major developing countries do not take on major
emission cuts before then. The price even dips slightly before beginning a steep ascent,
an undesirable feature. It climbs steadily in the second half of the century, as the
formula-based targets begin to bite seriously for developing countries. Before 2050 the
carbon price has surpassed $100 per ton of CO2. Only toward the end of the century does
it level off, at almost $700 per ton of CO2 in the case where some developing countries
are spared early cuts, and at $800 per ton in the case where they are not spared.

        Most regions sustain economic losses that are small in the first half of the century
—under 1 percent of GDP—but that rise toward the end of the century.36 Given a
positive rate of time discount, this is a good outcome. No region in any period
experiences costs in excess of our self-imposed threshold of 5 percent of GDP. The
estimated costs of the policy to each country-group, in present discounted value (PDV)
36
  Figure 7 of HPICA Discussion Paper 08-08, omitted here to save space, illustrates economic costs,
expressed as fractions of GDP, by region, for the case where the developing countries take on later targets..
In this scenario, the highest decade costs are borne by China, just toward the end of the century, reaching
4.1% of GDP in 2100. (On the other hand the PDV of China’s cost is less than those of the United States
and several other regions.) The maximum GDP loss for the United States in any decade is 1.9%, and for
the EU 1.4%, both occurring around 2080.


                                                                                                                                          25
terms, are reported in Table 3a. No country is asked to incur costs that are expected to
exceed 1 percent of GDP over the century. Only China’s costs creep up to 1.1% of
GDP, when it takes on an earlier target, in Table 3b. (All economic effects are gross of
environmental benefits—that is, no attempt is made to estimate environmental benefits or
net them out.)

        These costs of participation are overestimated, and increasingly so in the later
decades, if the alternative to staying in the treaty one more decade is dropping out after
seven or eight decades of participation. The reason is that countries will have already
substantially altered their capital stock and economic structure in a carbon-friendly
direction. The economic costs reported in the simulations and graphs treat the alternative
to participation as never having joined the treaty in the first place.

         Figure 6 provides Gross World Product loss aggregated across across regions
worldwide, and discounted to present value using a discount rate of 5 percent. Total
economic costs come to 0.24 percent of annual gross world product in the case where
China and MENA start later and Southeast Asia and Africa are not given targets below
BAU. Overall policy costs come to 0.65 percent in the case where the former two start
earlier, the latter two are given targets below BAU, and as a result the price of carbon hits
$800 per ton.


                                                                                          26
Figure 6: Loss of Aggregate Gross World Product by Budget Period, 2015-2100
-- with later targets for developing countries
                                                                GWP loss

              0.0%


                                    5


                                                            5


                                                                                   5
                     5


                             5


                                           5


                                                  5


                                                                   5


                                                                             5


                                                                                          5
                            1


                                   2


                                          3


                                                 4


                                                           5


                                                                  6


                                                                            7


                                                                                  8


                                                                                         9
                    0
             -0.1%


                                  0


                                                       0


                                                                        0


                                                                                  0
                    0


                            0


                                         0


                                                0


                                                                 0


                                                                                         0
                   2


                           2


                                 2


                                        2


                                               2


                                                      2


                                                                2


                                                                       2


                                                                                 2


                                                                                        2
             -0.2%

             -0.3%

             -0.4%                                                                                  FRA NKEL A rchitecture

             -0.5%

             -0.6%

             -0.7%

             -0.8%


Environmental effects

        The outcome of this plan in terms of cumulative emissions of GHGs is close to
those of some models that build in environmental effects or science-based constraints,
even though no such inputs were used here. The concentration of CO2 in the atmosphere
stabilizes at 500 ppm in the last quarter of the century.


Figure 7a:
CO2 concentrations nearly achieve year-2100 concentration goal of 500 ppm
-- with later targets for developing countries


                                   Carbon Conce ntrations (CO2 only)
            800
            750                                                                                                 bau
            700
            650
     ppmv


            600
            550                                                                                                 FRANK
            500                                                                                                 EL
            450                                                                                                 Archite
                                                                                                                cture
            400
            350
            300
               5


                       5


                               5


                                             5


                                                                        5
                                      5


                                                       5


                                                              5


                                                                                5


                                                                                         5


                                                                                                5
              0


                      1


                              2


                                            4


                                                                       7


                                                                                        9
                                     3


                                                      5


                                                             6


                                                                               8


                                                                                               0
             0


                     0


                             0


                                           0


                                                     0


                                                                      0


                                                                                       0


                                                                                              1
                                    0


                                                            0


                                                                              0
            2


                    2


                            2


                                   2


                                          2


                                                    2


                                                           2


                                                                     2


                                                                             2


                                                                                      2


                                                                                             2


                                                                                                             27
How to Set Greenhouse Gas Emission Targets for All Countries

More Related Content

What's hot

The Copenhagen Accord Contents
The Copenhagen Accord ContentsThe Copenhagen Accord Contents
The Copenhagen Accord Contentscarrambaslide
 
Unfccc and kyoto protocol escario
Unfccc and kyoto protocol escarioUnfccc and kyoto protocol escario
Unfccc and kyoto protocol escarioJOEPARESCARIORPAE
 
IPCC Paris Agreement/ Glasgow Accord : Article 6 rule book
IPCC Paris Agreement/ Glasgow Accord : Article 6 rule bookIPCC Paris Agreement/ Glasgow Accord : Article 6 rule book
IPCC Paris Agreement/ Glasgow Accord : Article 6 rule bookEnergy for One World
 
COP26 Glasgow Climate Pact- Outcome Document
COP26 Glasgow Climate Pact- Outcome DocumentCOP26 Glasgow Climate Pact- Outcome Document
COP26 Glasgow Climate Pact- Outcome DocumentEnergy for One World
 
Global Environmental Governance: Copenhagen Accord
Global Environmental Governance: Copenhagen AccordGlobal Environmental Governance: Copenhagen Accord
Global Environmental Governance: Copenhagen AccordBobur Nazarmuhamedov
 
India, Cdm And Kyoto Protocol
India, Cdm And Kyoto ProtocolIndia, Cdm And Kyoto Protocol
India, Cdm And Kyoto ProtocolRatnesh Jaiswal
 
2015-08-18 GR Academy Kyoto Protocol
2015-08-18 GR Academy Kyoto Protocol2015-08-18 GR Academy Kyoto Protocol
2015-08-18 GR Academy Kyoto ProtocolESGQ Rating Agency
 
Vehicle for modernization in trouble. How the eurozone crisis have changed co...
Vehicle for modernization in trouble. How the eurozone crisis have changed co...Vehicle for modernization in trouble. How the eurozone crisis have changed co...
Vehicle for modernization in trouble. How the eurozone crisis have changed co...Rocznik Integracji Europejskiej
 
Climate change: Questions and Answers
Climate change: Questions and Answers Climate change: Questions and Answers
Climate change: Questions and Answers europe_in_israel
 
The History of Climate Change Negotiations
The History of Climate Change NegotiationsThe History of Climate Change Negotiations
The History of Climate Change NegotiationsUNDP Eurasia
 
2.1b nap sdg i frame overview june 2018 set 2
2.1b nap sdg i frame  overview june 2018 set 22.1b nap sdg i frame  overview june 2018 set 2
2.1b nap sdg i frame overview june 2018 set 2NAP Events
 
Carbon finance for beginners (Kyoto Protocol and its mechanisms; Current stat...
Carbon finance for beginners (Kyoto Protocol and its mechanisms; Current stat...Carbon finance for beginners (Kyoto Protocol and its mechanisms; Current stat...
Carbon finance for beginners (Kyoto Protocol and its mechanisms; Current stat...UNDP Eurasia
 
Low carbon development strategy of the republic of moldova to the year 2020
Low carbon development strategy of the republic of moldova to the year 2020Low carbon development strategy of the republic of moldova to the year 2020
Low carbon development strategy of the republic of moldova to the year 2020UNDP Eurasia
 
CAN-briefing-reverse-4sept (1)
CAN-briefing-reverse-4sept (1)CAN-briefing-reverse-4sept (1)
CAN-briefing-reverse-4sept (1)Maeve McLynn
 

What's hot (20)

The Copenhagen Accord Contents
The Copenhagen Accord ContentsThe Copenhagen Accord Contents
The Copenhagen Accord Contents
 
LATESTREVDR
LATESTREVDRLATESTREVDR
LATESTREVDR
 
Unfccc and kyoto protocol escario
Unfccc and kyoto protocol escarioUnfccc and kyoto protocol escario
Unfccc and kyoto protocol escario
 
IPCC Paris Agreement/ Glasgow Accord : Article 6 rule book
IPCC Paris Agreement/ Glasgow Accord : Article 6 rule bookIPCC Paris Agreement/ Glasgow Accord : Article 6 rule book
IPCC Paris Agreement/ Glasgow Accord : Article 6 rule book
 
COP26 Glasgow Climate Pact- Outcome Document
COP26 Glasgow Climate Pact- Outcome DocumentCOP26 Glasgow Climate Pact- Outcome Document
COP26 Glasgow Climate Pact- Outcome Document
 
Global Environmental Governance: Copenhagen Accord
Global Environmental Governance: Copenhagen AccordGlobal Environmental Governance: Copenhagen Accord
Global Environmental Governance: Copenhagen Accord
 
Kyoto protocol
Kyoto protocolKyoto protocol
Kyoto protocol
 
Alert_48_COP21
Alert_48_COP21Alert_48_COP21
Alert_48_COP21
 
India, Cdm And Kyoto Protocol
India, Cdm And Kyoto ProtocolIndia, Cdm And Kyoto Protocol
India, Cdm And Kyoto Protocol
 
2015-08-18 GR Academy Kyoto Protocol
2015-08-18 GR Academy Kyoto Protocol2015-08-18 GR Academy Kyoto Protocol
2015-08-18 GR Academy Kyoto Protocol
 
Vehicle for modernization in trouble. How the eurozone crisis have changed co...
Vehicle for modernization in trouble. How the eurozone crisis have changed co...Vehicle for modernization in trouble. How the eurozone crisis have changed co...
Vehicle for modernization in trouble. How the eurozone crisis have changed co...
 
Climate change: Questions and Answers
Climate change: Questions and Answers Climate change: Questions and Answers
Climate change: Questions and Answers
 
The History of Climate Change Negotiations
The History of Climate Change NegotiationsThe History of Climate Change Negotiations
The History of Climate Change Negotiations
 
2.1b nap sdg i frame overview june 2018 set 2
2.1b nap sdg i frame  overview june 2018 set 22.1b nap sdg i frame  overview june 2018 set 2
2.1b nap sdg i frame overview june 2018 set 2
 
Unesco Iheguptacopenhagen 091219133218 Phpapp02
Unesco Iheguptacopenhagen 091219133218 Phpapp02Unesco Iheguptacopenhagen 091219133218 Phpapp02
Unesco Iheguptacopenhagen 091219133218 Phpapp02
 
Carbon finance for beginners (Kyoto Protocol and its mechanisms; Current stat...
Carbon finance for beginners (Kyoto Protocol and its mechanisms; Current stat...Carbon finance for beginners (Kyoto Protocol and its mechanisms; Current stat...
Carbon finance for beginners (Kyoto Protocol and its mechanisms; Current stat...
 
Kyoto protocol
Kyoto protocolKyoto protocol
Kyoto protocol
 
Low carbon development strategy of the republic of moldova to the year 2020
Low carbon development strategy of the republic of moldova to the year 2020Low carbon development strategy of the republic of moldova to the year 2020
Low carbon development strategy of the republic of moldova to the year 2020
 
CAN-briefing-reverse-4sept (1)
CAN-briefing-reverse-4sept (1)CAN-briefing-reverse-4sept (1)
CAN-briefing-reverse-4sept (1)
 
Kyoto protocol
Kyoto protocolKyoto protocol
Kyoto protocol
 

Similar to How to Set Greenhouse Gas Emission Targets for All Countries

KYOTO PROTOCOL.pptx
KYOTO PROTOCOL.pptxKYOTO PROTOCOL.pptx
KYOTO PROTOCOL.pptxAWais993227
 
2019 Report: The truth behind the climate pledges
2019 Report: The truth behind the climate pledges2019 Report: The truth behind the climate pledges
2019 Report: The truth behind the climate pledgesEnergy for One World
 
responding to the challenge of climate change 101224
responding to the challenge of climate change 101224responding to the challenge of climate change 101224
responding to the challenge of climate change 101224RMIT University
 
Api responding to the challenge of climate change 101224
Api responding to the challenge of climate change 101224Api responding to the challenge of climate change 101224
Api responding to the challenge of climate change 101224RMIT University
 
COP21 and The Decarbonisation of Societies: Can it be Pulled Off in this Cent...
COP21 and The Decarbonisation of Societies: Can it be Pulled Off in this Cent...COP21 and The Decarbonisation of Societies: Can it be Pulled Off in this Cent...
COP21 and The Decarbonisation of Societies: Can it be Pulled Off in this Cent...Business, Management and Economics Research
 
WWF: Policy Expectations for COP 19 Warsaw
WWF: Policy Expectations for COP 19 WarsawWWF: Policy Expectations for COP 19 Warsaw
WWF: Policy Expectations for COP 19 WarsawWWF ITALIA
 
Climate Change-building a framework for the future
Climate Change-building a framework for the futureClimate Change-building a framework for the future
Climate Change-building a framework for the futureYong (Xenia) Xie
 
Kyoto Protocol to The UNFCCC by Md Sohrab Hossain
Kyoto Protocol to The UNFCCC by Md Sohrab HossainKyoto Protocol to The UNFCCC by Md Sohrab Hossain
Kyoto Protocol to The UNFCCC by Md Sohrab HossainMd Sohrab Hossain
 
Kyoto protocol and Copenhagen Summit
Kyoto protocol and Copenhagen SummitKyoto protocol and Copenhagen Summit
Kyoto protocol and Copenhagen SummitNagarjun Karnatakam
 
World Economic Forum: The net-zero challenge (climate change/ emission gap re...
World Economic Forum: The net-zero challenge (climate change/ emission gap re...World Economic Forum: The net-zero challenge (climate change/ emission gap re...
World Economic Forum: The net-zero challenge (climate change/ emission gap re...Energy for One World
 
COP21 Policy Brief - UF Malmo
COP21 Policy Brief - UF MalmoCOP21 Policy Brief - UF Malmo
COP21 Policy Brief - UF MalmoGabriel Dascalu
 
What are the prospects for a climate agreement
What are the prospects for a climate agreementWhat are the prospects for a climate agreement
What are the prospects for a climate agreementSteve Baines
 
EU–China climate engagement
EU–China climate engagementEU–China climate engagement
EU–China climate engagementTheoChan3
 

Similar to How to Set Greenhouse Gas Emission Targets for All Countries (20)

Climate Equity
Climate EquityClimate Equity
Climate Equity
 
KYOTO PROTOCOL.pptx
KYOTO PROTOCOL.pptxKYOTO PROTOCOL.pptx
KYOTO PROTOCOL.pptx
 
2019 Report: The truth behind the climate pledges
2019 Report: The truth behind the climate pledges2019 Report: The truth behind the climate pledges
2019 Report: The truth behind the climate pledges
 
Policy Memo
Policy MemoPolicy Memo
Policy Memo
 
responding to the challenge of climate change 101224
responding to the challenge of climate change 101224responding to the challenge of climate change 101224
responding to the challenge of climate change 101224
 
Api responding to the challenge of climate change 101224
Api responding to the challenge of climate change 101224Api responding to the challenge of climate change 101224
Api responding to the challenge of climate change 101224
 
COP21 and The Decarbonisation of Societies: Can it be Pulled Off in this Cent...
COP21 and The Decarbonisation of Societies: Can it be Pulled Off in this Cent...COP21 and The Decarbonisation of Societies: Can it be Pulled Off in this Cent...
COP21 and The Decarbonisation of Societies: Can it be Pulled Off in this Cent...
 
WWF: Policy Expectations for COP 19 Warsaw
WWF: Policy Expectations for COP 19 WarsawWWF: Policy Expectations for COP 19 Warsaw
WWF: Policy Expectations for COP 19 Warsaw
 
Climate Change-building a framework for the future
Climate Change-building a framework for the futureClimate Change-building a framework for the future
Climate Change-building a framework for the future
 
Kyoto protocol
Kyoto protocolKyoto protocol
Kyoto protocol
 
Kyoto Protocol to The UNFCCC by Md Sohrab Hossain
Kyoto Protocol to The UNFCCC by Md Sohrab HossainKyoto Protocol to The UNFCCC by Md Sohrab Hossain
Kyoto Protocol to The UNFCCC by Md Sohrab Hossain
 
Kyoto protocol and Copenhagen Summit
Kyoto protocol and Copenhagen SummitKyoto protocol and Copenhagen Summit
Kyoto protocol and Copenhagen Summit
 
World Economic Forum: The net-zero challenge (climate change/ emission gap re...
World Economic Forum: The net-zero challenge (climate change/ emission gap re...World Economic Forum: The net-zero challenge (climate change/ emission gap re...
World Economic Forum: The net-zero challenge (climate change/ emission gap re...
 
The Kyoto Protocol
The Kyoto ProtocolThe Kyoto Protocol
The Kyoto Protocol
 
COP21 Policy Brief - UF Malmo
COP21 Policy Brief - UF MalmoCOP21 Policy Brief - UF Malmo
COP21 Policy Brief - UF Malmo
 
Transforming kyoto
Transforming kyotoTransforming kyoto
Transforming kyoto
 
The Pros And Cons Of Kyoto Protocol
The Pros And Cons Of Kyoto ProtocolThe Pros And Cons Of Kyoto Protocol
The Pros And Cons Of Kyoto Protocol
 
Kyoto protocol
Kyoto protocolKyoto protocol
Kyoto protocol
 
What are the prospects for a climate agreement
What are the prospects for a climate agreementWhat are the prospects for a climate agreement
What are the prospects for a climate agreement
 
EU–China climate engagement
EU–China climate engagementEU–China climate engagement
EU–China climate engagement
 

More from Glenn Klith Andersen

Klimaborgertingets anbefalinger april 2021
Klimaborgertingets anbefalinger april 2021Klimaborgertingets anbefalinger april 2021
Klimaborgertingets anbefalinger april 2021Glenn Klith Andersen
 
Plantekatalog, planter der understøtter biodiversitet
Plantekatalog, planter der understøtter biodiversitetPlantekatalog, planter der understøtter biodiversitet
Plantekatalog, planter der understøtter biodiversitetGlenn Klith Andersen
 
Barcelona digital city plan - Putting technology at the service of people.
Barcelona digital city plan - Putting technology at the service of people.Barcelona digital city plan - Putting technology at the service of people.
Barcelona digital city plan - Putting technology at the service of people.Glenn Klith Andersen
 
Introduction to the Compassionate Systems Framework in Schools
Introduction to the Compassionate Systems Framework in SchoolsIntroduction to the Compassionate Systems Framework in Schools
Introduction to the Compassionate Systems Framework in SchoolsGlenn Klith Andersen
 
Verdensmål 11: Bæredygtige byer og lokalsamfund, jan. 2019
Verdensmål 11: Bæredygtige byer og lokalsamfund, jan. 2019Verdensmål 11: Bæredygtige byer og lokalsamfund, jan. 2019
Verdensmål 11: Bæredygtige byer og lokalsamfund, jan. 2019Glenn Klith Andersen
 
FN's 17 verdensmaal af Steen Hildebrandt
FN's 17 verdensmaal af Steen HildebrandtFN's 17 verdensmaal af Steen Hildebrandt
FN's 17 verdensmaal af Steen HildebrandtGlenn Klith Andersen
 
17. Sustainable Development Goals UN
17. Sustainable Development Goals UN17. Sustainable Development Goals UN
17. Sustainable Development Goals UNGlenn Klith Andersen
 
Gudenåens Passage ved Tangeværket
Gudenåens Passage ved TangeværketGudenåens Passage ved Tangeværket
Gudenåens Passage ved TangeværketGlenn Klith Andersen
 
Rebalancing Society by Henry Mintzberg
Rebalancing Society by Henry MintzbergRebalancing Society by Henry Mintzberg
Rebalancing Society by Henry MintzbergGlenn Klith Andersen
 
Innovators ecosystem by Vinod Khosla
Innovators ecosystem by Vinod KhoslaInnovators ecosystem by Vinod Khosla
Innovators ecosystem by Vinod KhoslaGlenn Klith Andersen
 
Black Swans thesis of energy transformation
Black Swans thesis of energy transformationBlack Swans thesis of energy transformation
Black Swans thesis of energy transformationGlenn Klith Andersen
 
Ellen mac arthur foundation towards the circular economy vol.2
Ellen mac arthur foundation towards the circular economy vol.2Ellen mac arthur foundation towards the circular economy vol.2
Ellen mac arthur foundation towards the circular economy vol.2Glenn Klith Andersen
 
Ellen mac arthur foundation towards the circular economy vol.1
Ellen mac arthur foundation towards the circular economy vol.1Ellen mac arthur foundation towards the circular economy vol.1
Ellen mac arthur foundation towards the circular economy vol.1Glenn Klith Andersen
 
Rethinking sustainable consumption consumer study 2012
Rethinking sustainable consumption consumer study 2012Rethinking sustainable consumption consumer study 2012
Rethinking sustainable consumption consumer study 2012Glenn Klith Andersen
 
The Future Quotient: 50 Stars in Seriously Long Term Innovation
The Future Quotient: 50 Stars in Seriously Long Term InnovationThe Future Quotient: 50 Stars in Seriously Long Term Innovation
The Future Quotient: 50 Stars in Seriously Long Term InnovationGlenn Klith Andersen
 
The impact of a corporate culture of sustainability on corporate behavior and...
The impact of a corporate culture of sustainability on corporate behavior and...The impact of a corporate culture of sustainability on corporate behavior and...
The impact of a corporate culture of sustainability on corporate behavior and...Glenn Klith Andersen
 
Regeneration Project: Unfinished Business - White Paper
Regeneration Project: Unfinished Business - White PaperRegeneration Project: Unfinished Business - White Paper
Regeneration Project: Unfinished Business - White PaperGlenn Klith Andersen
 

More from Glenn Klith Andersen (20)

Klimaborgertingets anbefalinger april 2021
Klimaborgertingets anbefalinger april 2021Klimaborgertingets anbefalinger april 2021
Klimaborgertingets anbefalinger april 2021
 
Plantekatalog, planter der understøtter biodiversitet
Plantekatalog, planter der understøtter biodiversitetPlantekatalog, planter der understøtter biodiversitet
Plantekatalog, planter der understøtter biodiversitet
 
Klimarådet 70% Reduktion 2030
Klimarådet 70% Reduktion 2030Klimarådet 70% Reduktion 2030
Klimarådet 70% Reduktion 2030
 
Barcelona digital city plan - Putting technology at the service of people.
Barcelona digital city plan - Putting technology at the service of people.Barcelona digital city plan - Putting technology at the service of people.
Barcelona digital city plan - Putting technology at the service of people.
 
Introduction to the Compassionate Systems Framework in Schools
Introduction to the Compassionate Systems Framework in SchoolsIntroduction to the Compassionate Systems Framework in Schools
Introduction to the Compassionate Systems Framework in Schools
 
Verdensmål 11: Bæredygtige byer og lokalsamfund, jan. 2019
Verdensmål 11: Bæredygtige byer og lokalsamfund, jan. 2019Verdensmål 11: Bæredygtige byer og lokalsamfund, jan. 2019
Verdensmål 11: Bæredygtige byer og lokalsamfund, jan. 2019
 
FN's 17 verdensmaal af Steen Hildebrandt
FN's 17 verdensmaal af Steen HildebrandtFN's 17 verdensmaal af Steen Hildebrandt
FN's 17 verdensmaal af Steen Hildebrandt
 
Omstilling frem mod 2030
Omstilling frem mod 2030Omstilling frem mod 2030
Omstilling frem mod 2030
 
17. Sustainable Development Goals UN
17. Sustainable Development Goals UN17. Sustainable Development Goals UN
17. Sustainable Development Goals UN
 
Omstilling med Omtanke - nov 2015
Omstilling med Omtanke - nov 2015Omstilling med Omtanke - nov 2015
Omstilling med Omtanke - nov 2015
 
Gudenåens Passage ved Tangeværket
Gudenåens Passage ved TangeværketGudenåens Passage ved Tangeværket
Gudenåens Passage ved Tangeværket
 
Rebalancing Society by Henry Mintzberg
Rebalancing Society by Henry MintzbergRebalancing Society by Henry Mintzberg
Rebalancing Society by Henry Mintzberg
 
Innovators ecosystem by Vinod Khosla
Innovators ecosystem by Vinod KhoslaInnovators ecosystem by Vinod Khosla
Innovators ecosystem by Vinod Khosla
 
Black Swans thesis of energy transformation
Black Swans thesis of energy transformationBlack Swans thesis of energy transformation
Black Swans thesis of energy transformation
 
Ellen mac arthur foundation towards the circular economy vol.2
Ellen mac arthur foundation towards the circular economy vol.2Ellen mac arthur foundation towards the circular economy vol.2
Ellen mac arthur foundation towards the circular economy vol.2
 
Ellen mac arthur foundation towards the circular economy vol.1
Ellen mac arthur foundation towards the circular economy vol.1Ellen mac arthur foundation towards the circular economy vol.1
Ellen mac arthur foundation towards the circular economy vol.1
 
Rethinking sustainable consumption consumer study 2012
Rethinking sustainable consumption consumer study 2012Rethinking sustainable consumption consumer study 2012
Rethinking sustainable consumption consumer study 2012
 
The Future Quotient: 50 Stars in Seriously Long Term Innovation
The Future Quotient: 50 Stars in Seriously Long Term InnovationThe Future Quotient: 50 Stars in Seriously Long Term Innovation
The Future Quotient: 50 Stars in Seriously Long Term Innovation
 
The impact of a corporate culture of sustainability on corporate behavior and...
The impact of a corporate culture of sustainability on corporate behavior and...The impact of a corporate culture of sustainability on corporate behavior and...
The impact of a corporate culture of sustainability on corporate behavior and...
 
Regeneration Project: Unfinished Business - White Paper
Regeneration Project: Unfinished Business - White PaperRegeneration Project: Unfinished Business - White Paper
Regeneration Project: Unfinished Business - White Paper
 

Recently uploaded

28042024_First India Newspaper Jaipur.pdf
28042024_First India Newspaper Jaipur.pdf28042024_First India Newspaper Jaipur.pdf
28042024_First India Newspaper Jaipur.pdfFIRST INDIA
 
Nurturing Families, Empowering Lives: TDP's Vision for Family Welfare in Andh...
Nurturing Families, Empowering Lives: TDP's Vision for Family Welfare in Andh...Nurturing Families, Empowering Lives: TDP's Vision for Family Welfare in Andh...
Nurturing Families, Empowering Lives: TDP's Vision for Family Welfare in Andh...narsireddynannuri1
 
Kishan Reddy Report To People (2019-24).pdf
Kishan Reddy Report To People (2019-24).pdfKishan Reddy Report To People (2019-24).pdf
Kishan Reddy Report To People (2019-24).pdfKISHAN REDDY OFFICE
 
BDSM⚡Call Girls in Greater Noida Escorts >༒8448380779 Escort Service
BDSM⚡Call Girls in Greater Noida Escorts >༒8448380779 Escort ServiceBDSM⚡Call Girls in Greater Noida Escorts >༒8448380779 Escort Service
BDSM⚡Call Girls in Greater Noida Escorts >༒8448380779 Escort ServiceDelhi Call girls
 
2024 03 13 AZ GOP LD4 Gen Meeting Minutes_FINAL.docx
2024 03 13 AZ GOP LD4 Gen Meeting Minutes_FINAL.docx2024 03 13 AZ GOP LD4 Gen Meeting Minutes_FINAL.docx
2024 03 13 AZ GOP LD4 Gen Meeting Minutes_FINAL.docxkfjstone13
 
Powerful Love Spells in Phoenix, AZ (310) 882-6330 Bring Back Lost Lover
Powerful Love Spells in Phoenix, AZ (310) 882-6330 Bring Back Lost LoverPowerful Love Spells in Phoenix, AZ (310) 882-6330 Bring Back Lost Lover
Powerful Love Spells in Phoenix, AZ (310) 882-6330 Bring Back Lost LoverPsychicRuben LoveSpells
 
AI as Research Assistant: Upscaling Content Analysis to Identify Patterns of ...
AI as Research Assistant: Upscaling Content Analysis to Identify Patterns of ...AI as Research Assistant: Upscaling Content Analysis to Identify Patterns of ...
AI as Research Assistant: Upscaling Content Analysis to Identify Patterns of ...Axel Bruns
 
Defensa de JOH insiste que testimonio de analista de la DEA es falso y solici...
Defensa de JOH insiste que testimonio de analista de la DEA es falso y solici...Defensa de JOH insiste que testimonio de analista de la DEA es falso y solici...
Defensa de JOH insiste que testimonio de analista de la DEA es falso y solici...AlexisTorres963861
 
Embed-4.pdf lkdiinlajeklhndklheduhuekjdh
Embed-4.pdf lkdiinlajeklhndklheduhuekjdhEmbed-4.pdf lkdiinlajeklhndklheduhuekjdh
Embed-4.pdf lkdiinlajeklhndklheduhuekjdhbhavenpr
 
Embed-2 (1).pdfb[k[k[[k[kkkpkdpokkdpkopko
Embed-2 (1).pdfb[k[k[[k[kkkpkdpokkdpkopkoEmbed-2 (1).pdfb[k[k[[k[kkkpkdpokkdpkopko
Embed-2 (1).pdfb[k[k[[k[kkkpkdpokkdpkopkobhavenpr
 
BDSM⚡Call Girls in Indirapuram Escorts >༒8448380779 Escort Service
BDSM⚡Call Girls in Indirapuram Escorts >༒8448380779 Escort ServiceBDSM⚡Call Girls in Indirapuram Escorts >༒8448380779 Escort Service
BDSM⚡Call Girls in Indirapuram Escorts >༒8448380779 Escort ServiceDelhi Call girls
 
Vashi Escorts, {Pooja 09892124323}, Vashi Call Girls
Vashi Escorts, {Pooja 09892124323}, Vashi Call GirlsVashi Escorts, {Pooja 09892124323}, Vashi Call Girls
Vashi Escorts, {Pooja 09892124323}, Vashi Call GirlsPooja Nehwal
 
26042024_First India Newspaper Jaipur.pdf
26042024_First India Newspaper Jaipur.pdf26042024_First India Newspaper Jaipur.pdf
26042024_First India Newspaper Jaipur.pdfFIRST INDIA
 
Nara Chandrababu Naidu's Visionary Policies For Andhra Pradesh's Development
Nara Chandrababu Naidu's Visionary Policies For Andhra Pradesh's DevelopmentNara Chandrababu Naidu's Visionary Policies For Andhra Pradesh's Development
Nara Chandrababu Naidu's Visionary Policies For Andhra Pradesh's Developmentnarsireddynannuri1
 
Julius Randle's Injury Status: Surgery Not Off the Table
Julius Randle's Injury Status: Surgery Not Off the TableJulius Randle's Injury Status: Surgery Not Off the Table
Julius Randle's Injury Status: Surgery Not Off the Tableget joys
 
Enjoy Night⚡Call Girls Rajokri Delhi >༒8448380779 Escort Service
Enjoy Night⚡Call Girls Rajokri Delhi >༒8448380779 Escort ServiceEnjoy Night⚡Call Girls Rajokri Delhi >༒8448380779 Escort Service
Enjoy Night⚡Call Girls Rajokri Delhi >༒8448380779 Escort ServiceDelhi Call girls
 
₹5.5k {Cash Payment} Independent Greater Noida Call Girls In [Delhi INAYA] 🔝|...
₹5.5k {Cash Payment} Independent Greater Noida Call Girls In [Delhi INAYA] 🔝|...₹5.5k {Cash Payment} Independent Greater Noida Call Girls In [Delhi INAYA] 🔝|...
₹5.5k {Cash Payment} Independent Greater Noida Call Girls In [Delhi INAYA] 🔝|...Diya Sharma
 
TDP As the Party of Hope For AP Youth Under N Chandrababu Naidu’s Leadership
TDP As the Party of Hope For AP Youth Under N Chandrababu Naidu’s LeadershipTDP As the Party of Hope For AP Youth Under N Chandrababu Naidu’s Leadership
TDP As the Party of Hope For AP Youth Under N Chandrababu Naidu’s Leadershipanjanibaddipudi1
 
29042024_First India Newspaper Jaipur.pdf
29042024_First India Newspaper Jaipur.pdf29042024_First India Newspaper Jaipur.pdf
29042024_First India Newspaper Jaipur.pdfFIRST INDIA
 
Minto-Morley Reforms 1909 (constitution).pptx
Minto-Morley Reforms 1909 (constitution).pptxMinto-Morley Reforms 1909 (constitution).pptx
Minto-Morley Reforms 1909 (constitution).pptxAwaiskhalid96
 

Recently uploaded (20)

28042024_First India Newspaper Jaipur.pdf
28042024_First India Newspaper Jaipur.pdf28042024_First India Newspaper Jaipur.pdf
28042024_First India Newspaper Jaipur.pdf
 
Nurturing Families, Empowering Lives: TDP's Vision for Family Welfare in Andh...
Nurturing Families, Empowering Lives: TDP's Vision for Family Welfare in Andh...Nurturing Families, Empowering Lives: TDP's Vision for Family Welfare in Andh...
Nurturing Families, Empowering Lives: TDP's Vision for Family Welfare in Andh...
 
Kishan Reddy Report To People (2019-24).pdf
Kishan Reddy Report To People (2019-24).pdfKishan Reddy Report To People (2019-24).pdf
Kishan Reddy Report To People (2019-24).pdf
 
BDSM⚡Call Girls in Greater Noida Escorts >༒8448380779 Escort Service
BDSM⚡Call Girls in Greater Noida Escorts >༒8448380779 Escort ServiceBDSM⚡Call Girls in Greater Noida Escorts >༒8448380779 Escort Service
BDSM⚡Call Girls in Greater Noida Escorts >༒8448380779 Escort Service
 
2024 03 13 AZ GOP LD4 Gen Meeting Minutes_FINAL.docx
2024 03 13 AZ GOP LD4 Gen Meeting Minutes_FINAL.docx2024 03 13 AZ GOP LD4 Gen Meeting Minutes_FINAL.docx
2024 03 13 AZ GOP LD4 Gen Meeting Minutes_FINAL.docx
 
Powerful Love Spells in Phoenix, AZ (310) 882-6330 Bring Back Lost Lover
Powerful Love Spells in Phoenix, AZ (310) 882-6330 Bring Back Lost LoverPowerful Love Spells in Phoenix, AZ (310) 882-6330 Bring Back Lost Lover
Powerful Love Spells in Phoenix, AZ (310) 882-6330 Bring Back Lost Lover
 
AI as Research Assistant: Upscaling Content Analysis to Identify Patterns of ...
AI as Research Assistant: Upscaling Content Analysis to Identify Patterns of ...AI as Research Assistant: Upscaling Content Analysis to Identify Patterns of ...
AI as Research Assistant: Upscaling Content Analysis to Identify Patterns of ...
 
Defensa de JOH insiste que testimonio de analista de la DEA es falso y solici...
Defensa de JOH insiste que testimonio de analista de la DEA es falso y solici...Defensa de JOH insiste que testimonio de analista de la DEA es falso y solici...
Defensa de JOH insiste que testimonio de analista de la DEA es falso y solici...
 
Embed-4.pdf lkdiinlajeklhndklheduhuekjdh
Embed-4.pdf lkdiinlajeklhndklheduhuekjdhEmbed-4.pdf lkdiinlajeklhndklheduhuekjdh
Embed-4.pdf lkdiinlajeklhndklheduhuekjdh
 
Embed-2 (1).pdfb[k[k[[k[kkkpkdpokkdpkopko
Embed-2 (1).pdfb[k[k[[k[kkkpkdpokkdpkopkoEmbed-2 (1).pdfb[k[k[[k[kkkpkdpokkdpkopko
Embed-2 (1).pdfb[k[k[[k[kkkpkdpokkdpkopko
 
BDSM⚡Call Girls in Indirapuram Escorts >༒8448380779 Escort Service
BDSM⚡Call Girls in Indirapuram Escorts >༒8448380779 Escort ServiceBDSM⚡Call Girls in Indirapuram Escorts >༒8448380779 Escort Service
BDSM⚡Call Girls in Indirapuram Escorts >༒8448380779 Escort Service
 
Vashi Escorts, {Pooja 09892124323}, Vashi Call Girls
Vashi Escorts, {Pooja 09892124323}, Vashi Call GirlsVashi Escorts, {Pooja 09892124323}, Vashi Call Girls
Vashi Escorts, {Pooja 09892124323}, Vashi Call Girls
 
26042024_First India Newspaper Jaipur.pdf
26042024_First India Newspaper Jaipur.pdf26042024_First India Newspaper Jaipur.pdf
26042024_First India Newspaper Jaipur.pdf
 
Nara Chandrababu Naidu's Visionary Policies For Andhra Pradesh's Development
Nara Chandrababu Naidu's Visionary Policies For Andhra Pradesh's DevelopmentNara Chandrababu Naidu's Visionary Policies For Andhra Pradesh's Development
Nara Chandrababu Naidu's Visionary Policies For Andhra Pradesh's Development
 
Julius Randle's Injury Status: Surgery Not Off the Table
Julius Randle's Injury Status: Surgery Not Off the TableJulius Randle's Injury Status: Surgery Not Off the Table
Julius Randle's Injury Status: Surgery Not Off the Table
 
Enjoy Night⚡Call Girls Rajokri Delhi >༒8448380779 Escort Service
Enjoy Night⚡Call Girls Rajokri Delhi >༒8448380779 Escort ServiceEnjoy Night⚡Call Girls Rajokri Delhi >༒8448380779 Escort Service
Enjoy Night⚡Call Girls Rajokri Delhi >༒8448380779 Escort Service
 
₹5.5k {Cash Payment} Independent Greater Noida Call Girls In [Delhi INAYA] 🔝|...
₹5.5k {Cash Payment} Independent Greater Noida Call Girls In [Delhi INAYA] 🔝|...₹5.5k {Cash Payment} Independent Greater Noida Call Girls In [Delhi INAYA] 🔝|...
₹5.5k {Cash Payment} Independent Greater Noida Call Girls In [Delhi INAYA] 🔝|...
 
TDP As the Party of Hope For AP Youth Under N Chandrababu Naidu’s Leadership
TDP As the Party of Hope For AP Youth Under N Chandrababu Naidu’s LeadershipTDP As the Party of Hope For AP Youth Under N Chandrababu Naidu’s Leadership
TDP As the Party of Hope For AP Youth Under N Chandrababu Naidu’s Leadership
 
29042024_First India Newspaper Jaipur.pdf
29042024_First India Newspaper Jaipur.pdf29042024_First India Newspaper Jaipur.pdf
29042024_First India Newspaper Jaipur.pdf
 
Minto-Morley Reforms 1909 (constitution).pptx
Minto-Morley Reforms 1909 (constitution).pptxMinto-Morley Reforms 1909 (constitution).pptx
Minto-Morley Reforms 1909 (constitution).pptx
 

How to Set Greenhouse Gas Emission Targets for All Countries

  • 1. 4/3/09+- Version for NBER WP & 7/20/09 * Global Climate Policy Architecture: Specific Formulas and Emission Targets for All Countries in all Decades Jeffrey Frankel, Harpel Professor, Harvard University For the Harvard Project on International Climate Agreements, Directed by Joe Aldy and Rob Stavins The author would like especially to thank Valentina Bosetti of FEEM who produced, by means of the WITCH model, all the simulations of the effects of my formulas, thereby bringing hitherto- abstract ideas to life. This paper literally could not have been written without her. He would like to thank Joe Aldy and Robert Stavins of the Harvard Project on International Climate Agreements for encouraging and supporting this line of research. For comments and suggestions on the outcome he would like to thank John Deutch, Robert Keohane, Warwick McKibben, Oyebola Olabisi, Rob Stavins, Jonathan Weiner, and an anonymous reviewer. The author would further like to thank for partial support the Sustainability Science Program, funded by the Italian Ministry for Environment, Land and Sea, at the Center for International Development at Harvard University. * A mistake in the EU targets reported in the 2nd and 3rd panels of Table 1 , p.35-36 , of the NBER WP has been corrected here. Abstract This paper analyzes a detailed plan to set quantitative national limits on emissions of greenhouse gases, following along the lines of the Kyoto Protocol. It is designed to fill in the most serious gaps: the absence of targets extending as far as 2100, the absence of participation by the United States and developing countries, and the absence of reason to think that countries will abide by commitments. The plan elaborates on the idea of a framework of formulas that can assign quantitative limits across countries, one budget period at a time. Unlike other century-long paths of emission targets that are based purely on science (concentration goals) or ethics (equal rights per capita) or economics (cost-benefit optimization), this plan is based partly on politics. Three political constraints are particularly important. (1) Developing countries are not asked to bear any cost in the early years. (2) Thereafter, they are not asked to make any sacrifice that is different in kind or degree than was made by those countries that went before them, with due allowance for differences in incomes. (3) No country is asked to accept an ex ante target that costs it more than, say, 1% of GDP in present value, or more than, say, 5% of GDP in any single budget period. They would not agree to ex ante targets that turned out to have such high costs, nor abide by them ex post. An announced target path that implies a future violation of these constraints will not be credible, and thus will not provide the necessary signals to firms today. The idea is that (i) China and other developing countries are asked to accept targets at BAU in the coming budget period, the same in which the US first agrees to cuts below BAU; and (ii) all countries are asked to make further cuts in the future in accordance with a formula which sums up a Progressive Reductions Factor, a Latecomer Catch-up Factor, and a Gradual Equalization Factor. The paper tries out specific values for the parameters in the formulas (parameters that govern the extent of progressivity and equity, and the speed with which latecomers must eventually catch up). The resulting target paths for emissions are run through the WITCH model. It does turn out to be possible to achieve the carbon abatement goal (concentrations of 500 PPM in 2100) while simultaneously obeying the economic/political 1
  • 2. constraint (no country suffers a disproportionate loss in GDP). Preliminary efforts to achiefve a target of 450 ppm have so far been unable to do so without violating the cost constraint. 2
  • 3. Global Climate Policy Architecture: Specific Formulas and Emission Targets for All Countries in All Decades This paper analyzes a framework of formulas that produce precise numerical targets for emissions of carbon dioxide (CO2) in all regions of the world in all decades of this century. The formulas are based on pragmatic judgments about what is possible politically. The reason for this approach is a belief that many of the usual science-based, ethics-based, and economics-based paths are not dynamically consistent: That is, it is not credible that successor governments will be able to abide by the commitments that today’s leaders make. The formulas analyzed here are driven by seven political axioms: 1. The United States will not commit to quantitative targets if China and other major developing countries do not commit to quantitative targets at the same time, due to concerns about economic competitiveness and carbon leakage. 2. China and other developing countries in the very short run will not make economic sacrifices, especially because the United States has not done so. 3. China and other developing countries, even in the longer run, will not make sacrifices different in character from those made by richer countries that have gone before them. 4. In the long run, no country can be rewarded for having “ramped up” its emissions well above 1990 levels before joining. 5. No country will agree to participate if its expected cost during the course of the 21st century (in present discounted value) is more than Y, where Y is for now set at 1 percent of gross domestic product (GDP). 6. No country will abide by targets that cost it more than X in any particular period, where X is for now set at 5 percent of GDP. 7. If one major country drops out, others will become discouraged and the system may unravel. The targets are formulated assuming the following framework. Between now and 2050, the European Union follows the path laid out in the January 2008 European Commission Directive; the United States follows the path in recent legislative bills associated with Senator Joseph Lieberman; and Japan, Australia and Korea follow statements that their own leaders have recently made. China, India and other countries agree immediately to quantitative greenhouse gas (GHG) emission targets, which in the first decades merely copy their business-as-usual (BAU) paths, thereby precluding leakage. These countries are not initially expected to cut emissions below their BAU trajectory. When the time comes for these countries to join mitigation efforts—perhaps when they cross certain thresholds—their emission targets are determined using a formula that incorporates three elements: a Progressive Reductions Factor, a Latecomer Catch-up Factor, and a Gradual Equalization Factor. These factors are designed to persuade the developing countries that they are only being asked to do what is fair in light of actions already taken by others. In the second half of the century, the formula that determines the emissions path for industrialized countries is dominated by the Gradual Equalization 3
  • 4. Factor. But developing countries, which will still be in earlier stages of participation and thus will have departed from their BAU paths only relatively recently, will still follow in the footsteps of those who have gone before. This means that their emission targets will be set using the Progressive Reductions Factor and the Latecomer Catch-up Factor, in addition to the Gradual Equalization Factor. The glue that holds the agreement together is that every country has reason to feel that it is only doing its fair share. We use the WITCH model to analyze the results of this approach in terms of projected paths for emissions targets, permit trading, the price of carbon, GDP costs, and environmental effects. Overall economic costs, discounted (at 5 percent), average 0.24 percent of GDP. No country suffers a discounted loss of more than 1 percent of GDP overall from the agreement, nor more than 5 percent of GDP in any given period. Atmospheric CO2 concentrations level off at 500 parts per million (ppm) in the latter part of the century. (The next phase of this research aims for a target of 450 ppm.) The problem There are by now many plans for a post-Kyoto climate change regime, even if one considers only those that accept the basic Kyoto approach of quantitative, national-level limits on GHG emissions accompanied by international trade in emissions permits. The Kyoto targets applied only to the budget period 2008–2012, which is now upon us, and only to a minority of countries (in theory, the industrialized countries). The big task is to extend quantitative emissions targets through the remainder of the century and to other countries—especially the United States, China, and other developing countries. Virtually all the other plans for a post-Kyoto agreement are either based on scientific environmental objectives (e.g., stabilizing atmospheric CO2 concentrations at 450 ppm in 2100), ethical or philosophical considerations (e.g., the principle that every individual on earth has equal emission rights), or economic cost-benefit analyses (weighing the economic costs of abatement against the long-term environmental benefits).1 This paper analyzes a path of emission targets for all countries and for the remainder of the century that is intended to be more practical than others that have been put forward, in that it is also based on political considerations, rather than on science or ethics or economics alone.2 The industrialized countries did, in 1997, agree to quantitative emissions targets for the Kyoto Protocol’s first budget period, so in some sense we know that it can be done. But the obstacles are enormous. For starters, most of the Kyoto signers will probably miss their 2008–2012 targets, and of course the United States never even 1 An important example of the science-based approach is Wigley (2007). An important example of the cost-benefit-based approach is Nordhaus (1994, 2006). An important example of the rights-based approach is Baer et al. (2008). 2 Aldy, Barrett, and Stavins (2003) and Victor (2004) review a number of existing proposals. Numerous others have offered their own thoughts on post-Kyoto plans, at varying levels of detail, including Aldy, Orszag, and Stiglitz (2001); Barrett (2006); Nordhaus (2006); and Olmstead and Stavins (2006). 4
  • 5. ratified. At multilateral venues such as the United Nations Framework Convention on Climate Change (UNFCCC) meeting in Bali (2007) and the Group of Eight (G8) meeting in Hokkaido (July 2008), world leaders have (just barely) been able to agree on a broad long-term goal of cutting total global emissions in half by 2050. But these meetings did not come close to producing agreement on who will cut how much, not to mention agreement on multilateral targets within a near-enough time horizon that the same national leaders are likely to still be alive when the abatement commitment comes due. To quote Al Gore (1993, p.353), “politicians are often tempted to mke a promise that is not binding and hpe for some unexpectedly easy way to keep the promise.” For this reason, the aggregate targets endorsed so far cannot be viewed as anything more than aspirational. Moreover, nobody has ever come up with an enforcement mechanism that simultaneously has sufficient teeth and is acceptable to member countries. Given the importance countries place on national sovereignty it is unlikely that this will change.3 Hopes must instead rest on weak enforcement mechanisms such as the power of moral suasion and international opprobrium. It is safe to say that in the event of a clash between such weak enforcement mechanisms and the prospect of a large economic loss to a particular country, aversion to the latter would win out. Necessary aspects of a workable successor to Kyoto I have suggested six attributes4 that any successor-agreement to the Kyoto Protocol would have to deliver: • More comprehensive participation—specifically, getting the United States, China, and other developing counties to join the system of quantitative emission targets. • Efficiency—incorporating market-flexibility mechanisms such as international permit trading and providing advance signals to allow the private sector to plan ahead, to the extent compatible with the credibility of the signals. • Dynamic consistency—addressing the problem that announcements about steep cuts in 2050 are not credible. The lack of credibility stems from two sources. First, it is known that today’s leaders cannot bind their successors. Second, the projected failure of most Kyoto signatories to meet their first-period emission targets makes the lack of seriousness at a global level painfully obvious. • Equity—developing countries point out that industrialized countries created the problem of global climate change, while poor countries account for only about 20 percent of the CO2 that has accumulated in the atmosphere from industrial activity over the past 150 years (though admittedly this is changing rapidly). From an equity standpoint, developing countries argue that it is not appropriate to ask them to limit 3 The possibility of trade sanctions is probably the only serious proposal for penalizing non- participation. But such penalties are not currently being considered at the multilateral level. (See Frankel, 2009, however, and references therein). 4 Frankel (2007). Similar lists are provided by Bowles and Sandalow (2001), Stewart and Weiner (2003), and others. 5
  • 6. their economic development to pay for a climate-change solution; moreover, they do not have the capacity to pay for emissions abatement that richer countries do. Finally, many developing countries place greater priority on raising their people’s current standard of living (including reducing local air and water pollution). These countries might reasonably demand quantitative targets that reflect an equal per capita allotment of emissions, on equity grounds, even waiving any claims to reparations for the disproportionate environmental damages that can be expected to fall on them. • Compliance —recognizing that no country will join a treaty if it entails tremendous economic sacrifice and that therefore compliance cannot be reasonably expected if costs are too high. Similarly, no country, if it has already joined the treaty, will continue to stay in during any given period if staying in means huge economic sacrifice, relative to dropping out, in that period. • Robustness under uncertainty—recognizing that the relationship between cost and compliance applies not just to ex ante calculations based on current expectations, but also ex post, when future growth rates and other uncertain economic and technological variables become known. Unlike the Kyoto Protocol, the plan analyzed in this paper brings all countries into an international policy regime on a realistic basis and looks far into the future. But we cannot pretend to see with as fine a degree of resolution at a century-long horizon as we can at a five- or ten-year horizon. Fixing precise numerical targets a century ahead is impractical. Rather, we need a century-long sequence of negotiations, fitting within a common institutional framework that builds confidence as it goes along. The framework must have enough continuity so that success in the early phases builds members’ confidence in each other’s compliance commitments and in the fairness, viability, and credibility of the process. Yet the framework must be flexible enough that it can accommodate the unpredictable fluctuations in economic growth, technology development, climate, and political sentiment that will inevitably occur. Only by striking the right balance between continuity and flexibility are there grounds for hope that a framework for addressing climate change would last a century or more. An example of such a framework in another policy area is the General Agreement on Tariffs and Trade, which emerged after World War II and provided the basis for 50 years of successful multilateral negotiations to liberalize international trade, culminating in the founding of the World Trade Organization. Nobody at the beginning could have predicted the precise magnitude or sequence of reforms to various trade barriers, or what sectors or countries would be included. But the early stages of negotiation worked, and so confidence in the process built, more and more countries joined the club, and progressively more ambitious rounds of liberalization were achieved. Another analogy would be with the process of European economic integration, culminating in the formation of the European Economic and Monetary Union. Despite ambitions for more comprehensive integration, nobody at the time of the founding of the European Coal and Steel Community, or the subsequent European Economic Community, could have forecast the speed, scope, magnitude, or country membership 6
  • 7. that this path of integration would eventually take. The idea would be to do the same with the UNFCCC. Political constraints This paper takes as axiomatic the following six claims regarding political feasibility. 1. The United States will not commit to quantitative targets if China and other major developing countries do not commit to quantitative targets at the same time, though this leaves completely open the initial level and future path of the targets. Any plan will be found unacceptable if it leaves the less developed countries free to exploit their lack of GHG regulation for “competitive” advantage at the expense of the participating countries’ economies and leads to emissions leakage at the expense of the environmental goal. 2. China, India, and other developing countries will not make sacrifices they view as a. fully contemporaneous with rich countries, b. different in character from those made by richer countries who have gone before them, c. preventing them from industrializing, d. failing to recognize that richer countries are in a position to make greater economic sacrifices than poor countries to address the problem (all the more so because rich countries’ past emissions have created the problem), or e. failing to recognize that the rich countries have benefited from an “unfair advantage” in being allowed to achieve levels of per capita emissions that are far above those of the poor countries. 3. In the short run, emission targets for developing countries must be computed relative to current levels or BAU paths; otherwise the economic costs will be too great for the countries in question to accept. 5 But in the longer run, no country can be rewarded for having "ramped up” emissions far above 1990 levels, the reference year agreed to at Rio and Kyoto. Fairness considerations aside, if post-1990 increases are permanently “grandfathered,” then countries that have not yet agreed to cuts will have a strong incentive to ramp up emissions in the interval before they join. Of course there is nothing magic about 1990 but, for better or worse, it is the year on which Annex I countries have long based planning. 4. No country will accept a path of targets that is expected to cost it more than Y percent of GDP throughout the 21st century (in present discounted value), where Y is for now set at 1 percent. 5. No country will accept targets in any period that are expected to cost more than X percent of GDP to achieve during that period; alternatively, even if targets were already in place, no country will in the future actually abide by them if it finds the cost to do so would exceed X percent of GDP. In this paper, GDP losses are defined relative to what would happen if the country in question had never joined. An alternative would be to define GDP losses in a future period relative to what would 5 Cuts expressed relative to BAU have been called “Action Targets” (Baumert and Goldberg 2006). 7
  • 8. happen if the country were to drop out in that period, after decades of participation. For now, I set X at 5 percent. 6. If one major country drops out, others will become discouraged and may also fail to meet their own targets, and the framework may unravel. If such unraveling in a future decade is foreseeable at the time that long-run commitments are made, then those commitments will not be credible from the start. Firms, consumers, and researchers base their current decisions to invest in plant and equipment, consumer durables, or new technological possibilities on the expected future price of carbon: If government commitments are not credible from the start, then they will not raise the expected future carbon price. The reason for this political approach is the belief that many emissions pathways designed on the basis of scientific or economic analyses are not dynamically consistent: That is, it is not credible that successor governments will be able to abide by the commitments that today’s leaders make. Squaring the circle Of the above propositions, even the first and second alone seem to add up to a hopeless “Catch-22”: Nothing much can happen without the United States, the United States will not proceed unless China and other developing countries start at the same time, and China will not start until after the rich countries have gone first. There is only one possible solution, only one knife-edge position that satisfies the constraints. At the same time that the United States agrees to binding emission cuts in the manner of Kyoto, China and other developing countries agree to a path that immediately imposes on them binding emission targets—but these targets in their early years simply follow the BAU path. The idea of committing to only BAU targets in the early decades will provoke outrage from both environmentalists on one side and business interests in developed countries on the other. But both sides might come to realize that this commitment is far more important than it sounds: It precludes the carbon leakage which, absent such an agreement, will undermine the environmental goal and it moderates the competitiveness concerns of carbon-intensive industries in the rich countries. This approach recognizes that it would be irrational for China to agree to substantial actual cuts in the short term. Indeed China might well react with outrage at being asked to take on binding targets of any kind at the same time as the United States. But China may also come to realize that it would actually gain from such an agreement,6 by acquiring the ability to sell emission permits at the same world market price as developed countries (as opposed to the lower prices China has received for lower-quality project credits under the Kyoto Protocol’s Clean Development Mechanism [CDM] or joint implementation [JI] provisions). In later decades, the formulas do ask substantially more of the developing countries. But these formulas also obey basic notions of fairness, by (1) asking for cuts 6 A number of authors have pointed out that developing countries actually stand to gain economically in the short run by accepting targets and then selling permits, including the Council of Economic Advisers (1998), Keohane and Raustiala (2008), and Seidman and Lewis (2009). Of course this only works when the permits allocated to developing countries are sufficiently generous (i.e., do not reflect a significant abatement obligation), as is reasonable in the short run, but which the developing countries cannot expect in the long run. 8
  • 9. that are analogous in magnitude to the cuts made by others who began abatement earlier and (2) making due allowance for developing countries’ low per capita income and emissions and for their baseline of rapid growth. These ideas were developed in earlier papers (see Frankel 1999, 2005, and 2007 and Aldy and Frankel 2004) where I suggest that the formulas used to develop emissions targets incorporate four or five variables: 1990 emissions, emissions in the year of the negotiation, population, and income. One might perhaps also include a few other special variables such as whether the country in question has coal or hydroelectric power, though the 1990 level of emissions conditional on per capita income can largely capture these special variables. Here we narrow down the broad family of formulas to a more manageable set, and then put them into operation to produce specific numerical targets for all countries, for all five-year budget periods of the 21st century. The formulas are made precise through the development of three factors: a short-term Progressive Reductions Factor, a medium-term Latecomer Catch-up Factor, and a long-run Gradual Equalization Factor. The result is a set of actual numerical targets for all countries for the remainder of the century (presented in Table 1). These are then fed into the WITCH model, by Valentina Bosetti, a co-author of that model, to see the economic and environmental consequences. International trading plays an important role. The framework is flexible enough that one can tinker with a parameter here or there—for example if the economic cost borne by a particular country is deemed too high or the environmental progress deemed too low— without having to abandon the entire formulas framework. Emission targets for all countries: rules to guide the formulas All developing countries that have any ability to measure emissions would be asked to agree in 2010 to emission targets that do not exceed their projected BAU baseline trajectory going forward. The objective of getting developing countries committed to these targets would be to forestall emissions leakage and to limit the extent to which their firms enjoy a competitive advantage over carbon-constrained competitors in the countries that have already agreed to targets below BAU under the Kyoto Protocol. (We expect that the developing countries would, in most cases, receive payments for permits and thus emit less than their BAU baseline.) Most countries in Africa would probably be exempted for some decades from any kind of commitment, even to BAU targets, until they had better capacity to monitor emissions. One must acknowledge that BAU paths are neither easily ascertained nor immutable. Countries may “high-ball” their BAU estimates in order to get more generous targets. Even assuming that estimates are unbiased, important unforeseen economic and technological developments could occur between 2010 and 2020 that will shift the BAU trajectory for the 2020s, for example. Any number of unpredictable events have already occurred in the years since 1990; they include German reunification, the 1997–1998 East Asia crisis, the boom in the BRIC countries up until 2008 (Brazil, Russia, India, and China), the sharp rise in world oil prices up until 2008, and the world financial crisis of 2007–2009. A first measure to deal with the practical difficulty of setting the BAU path is to specify in the Kyoto-successor treaty that estimates must be 9
  • 10. generated by an independent international expert body, not by national authorities. A second measure, once the first has been assured, is to provide for updates of the BAU paths every decade. To omit such a provision—that is, to hold countries for the rest of the century to the paths that had been estimated in 2010—would in practice virtually guarantee that any country that achieves very high economic growth rates in the future will eventually drop out of the agreement, because staying in would mean incurring costs far in excess of 5 percent of GDP. Allowing for periodic adjustments to the BAU baseline does risk undermining the incentive for carbon-saving investments, on the logic that such investments would reduce future BAU paths and thus reduce future target allocations. This risk is the same as the risk of encouraging countries to ramp up their emissions, which we specified above to be axiomatically ruled out by any viable framework. That is why the formula gives decreasing weight to BAU in later budget periods and why I introduce a Latecomer Catch-up Factor (explained below), which tethers all countries to their 1990 emission levels in the medium run. Countries are expected to agree to the next step, quantitative targets that entail specific cuts below BAU, at a time determined by their circumstances. In our initial simulations, the choice of year for introducing an obligation to actually cut emissions was generally guided by two thresholds: when a country’s average per capita income exceeds $3000 per year and/or when its per capita annual emissions approach 1 ton or more.7 But we found that starting dates had to be further modified in order to satisfy our constraints regarding the distribution of economic losses. As already noted, this approach assigns emission targets in a way that is more sensitive to political realities than is typical of other target paths which are constructed either on the basis of a cost-benefit optimization or to deliver a particular environmental and/or ethical goal. Specifically, numerical targets are based (a) on commitments that political leaders in various key countries have already announced, as of early 2009, and (b) on formulas designed to assure latecomer countries that the emission cuts they are being asked to make represent no more than their fair share, in that they correspond to the sacrifices that other countries before them have already made. Finally comes the other important concession to practical political realities: If the simulation in any period turns out to impose on any country an economic cost of more than X% of GDP (where X is for the purposes of this analysis is taken to be 5 percent), we assume that this country drops out. Dropping out could involve either explicit renunciation of the treaty or massive failure to meet the quantitative targets. For now, our assumption is that in any such scenario, other countries would follow by dropping out one by one, and the whole scheme would eventually unravel.8 This unraveling would occur much earlier if private actors rationally perceived that at some point in the future major players will face such high economic costs that compliance will break down. In this case, the future carbon prices that are built into most models’ compliance trajectories 7 Baer et al. (2008) suggest an income threshold of $7,500 per person per year. 8 A good topic for future efforts to extend this research is to apply game theory, allowing some relatively less important countries to drop out without necessarily sinking the whole scheme. That is, if the economic damage to remaining members arising from the defections, and the environmental damage, were not too great, remaining countries might continue to participate rather than retaliate by likewise dropping out. 10
  • 11. will lack credibility, private actors will not make investment decisions that reflect those prices today, based on them, and the effort will fail in the first period. Therefore, our approach to any scenario in which any major player suffers economic losses greater than X% would be to go back and adjust some of the parameters of the emission formulas, so that costs are lower and this is no longer the case. We hope by these mechanisms to achieve political viability: non-negative economic gains in the early years for developing countries, average costs over the course of the century below 1 percent of GDP per annum, and protection for every country against losses in any period as large, or larger than, 5 percent of GDP. Only if they achieve political viability are announcements of future cuts credible. And only credible announcements of future cuts will send firms the long-term price signals and incentives needed to guide investment decisions today. Guidelines from policies and goals already announced by national leaders Our model produces country-specific numeric emission targets for every fifth year: 2012, 2017, 2022, etc. For each five-year budget period, such as the Kyoto period 2008–2012, computations are based on the average of the starting year and ending year. The European Union. The EU emissions target for 2008–2012 was agreed at Kyoto: 8 percent below 1990 levels. In the second 2015–2020 period (for simplicity we choose the year 2017), the EU target is the one that Brussels announced in January 2008 and confirmed in December 2008:9 namely, 20 percent below 1990 levels. On the one hand, as with other targets publicly supported by politicians in Europe and elsewhere, skepticism is appropriate regarding EU member countries’ willingness to make the sacrifices necessary to achieve this target.10 On the other hand, however, the European Union’s commitment to this number was not conditional on other countries joining in. Indeed the European Union has said it would cut emissions 30 percent below 1990 levels if other countries joined in. So in this sense we are being conservative in choosing the 20 percent target. For the third period (2022–2027), and thereafter up to the eighth period (2048–2052), the EU targets progress in equal increments to a 50 percent cut below 1990 levels: In other words, targets relative to 1990 emissions start at 25 percent below, and then progress to 30 percent, 35 percent, 40 percent, 45 percent, and 50 percent below. Japan, Canada, and New Zealand. These three countries are assigned the Kyoto goal of a 6 percent reduction below 1990 levels. Of all ratifiers, Canada is probably the farthest from achieving its Kyoto goal.11 But Japan dominates this country grouping in size. We assume that by 2010 the United States has taken genuine measures, which helps 9 Financial Times, Jan. 2, 2009, p.5. 10 It is not entirely clear that even Europe will meet its Kyoto targets. Perhaps the European Union will need to cover its shortfall with purchases of emission permits from other countries. European emissions were reduced in the early 1990s by coincidental events: Britain moved away from coal under Margaret Thatcher and Germany with reunification in 1990 acquired dirty power plants that were easy to clean up. But Americans who claim on this basis that the European Union has not yet taken any serious steps go too far. Ellerman and Buchner (2007, 26-29) show that the difference between allocations and emissions in 2005 and 2006 was probably in part attributable to abatement measures implemented in response to the positive price of carbon. 11
  • 12. motivate these three countries to get more serious than they have been to date. In a small concession to realism, we assume that they do not hit the numerical target until 2012 (versus hitting it on average over the 2008–2012 budget period).12 Japan’s then-Prime Minister, Yasuo Fukuda, on June 9, 2008, announced a decision to cut Japanese emissions 60–80 percent by mid-century.13 We interpret these targets as cuts of 10 percent every five years between 2010 and 2050, computed logarithmically. The cumulative cuts are 80 percent in logarithmic terms, or 51 percent in absolute terms (i.e., to 49 percent of the year–2010 emissions level). The United States. A series of bills to cap US GHG emissions were introduced in Congress in 2007 and early 2008.14 It is possible that some version of such legislation might pass by 2010. The Bingaman–Specter bill would have reduced emissions to 2006 levels by 2020 and to 1990 levels by 2030, but with a cap or “safety valve” on the price of carbon. The Lieberman–Warner bill was more aggressive.15 It would have begun by reducing emissions in 2012 to below 2005 levels and would have tightened the emissions cap gradually each year thereafter, such that by the year 2050, total emissions would be held to 30 percent of 2012 levels—in other words, a 70 percent reduction from emissions levels at the start date of the policy.16 If such a bill were not passed until 2010 or so, the goal of achieving 2005 levels by 2012 (let alone a 4 percent reduction) would for all practical purposes be impossible to achieve. The bill’s sponsors would have to adjust 2012 to BAU levels, which are projected to be 39 percent above 1990 levels, or 33 percent logarithmically (i.e., 1990 emissions were 28 percent below current 2012 BAU projections), so the 2050 target would be 42 percent below 1990 levels.17 A slightly revised “manager’s” version of the Lieberman–Warner bill earned significant congressional support in June 2008: Though it did not garner a large enough majority to become law, the vote was widely considered an important step forward politically for the activist camp. It was presumed that a new bill in the next session would probably look similar and, with a new president, would have better chances of success.18 11 The current government’s plan calls for reducing Canadian emissions in 2020 by 20 percent below 2006 levels (which translates to 2.7 percent below 1990 levels) and in 2050 by 60–70 percent below 2006 levels. (“FACTBOX – Greenhouse gas curbs from Australia to India,” Sept.5, 2008, Reuters. www.alertnet.org/thenews/newsdesk/L5649578.htm.) 12 In 2007, Japanese Prime Minister Shinzo Abe supported an initiative to half global emissions by 2050. (Financial Times, May 25). But ahead of the 2008 G8 Summit, Japan declined to match the EU’s commitment to cut its emissions 20 per cent by 2020 (FT, April 24, 2008, p.3). 13 “Japan Pledges Big Cut in Emissions,” FT, June 10, 2008 p.6; 14 The bills are conveniently summarized in Table 1A in Hufbauer, Charnovitz and Kim (2009). 15 S. 2191: America's Climate Security Act of 2007 16 Section 1201, pages 30-32. (The percentage is measured non-logarithmically.) 17 See, for example, http://theclimategroup.org/index.php/news_and_events/news_and_comment/carbon_trading_high_hopes_for_lieberman_warner/ (The number is 54 percent, measured logarithmically. This is the preferred way of defining percentage changes, because a 50 percent increase in emissions followed by a 50 percent reduction gets you back where you started from. Logarithms are too technical for non-specialist audiences. But measuring changes non-logarithmically has the undesirable property that a 50 percent increase [to 1.50] followed by a 50 percent reduction [to 0.75] does not get you back to your starting point [1.00].) 18 This paper was originally written during the 2008 US presidential election campaign, in which both major presidential candidates supported GHG reduction measures along the lines of recent congressional bills. John McCain advocated a 2050 emissions target of 60 percent below 1990 levels, or 66 percent 12
  • 13. If taken at face value, with 2012 emissions returned to 2005 levels or lower, then the Lieberman–Warner targets would shave off another 13 percent from the target path, so that emissions in 2050 would be 55 percent below 1990 levels.19 There are three respects in which it might be naïve to accept these political aspirations at face value. First, it is not realistic to think that the United States could go from the steady emission growth rates of 1990–2007 (when emissions increased, on average, by 1.4 percent per year) to immediate rapid cuts, without passing through an intermediate phase of slowing, and then peaking or plateauing, before reversing (a trajectory some have called “slow- stop-reverse”). Second is the point that many voters and politicians who have supported recent bills in Congress will be unlikely to support the measures that would be needed to attain the targets contained in those bills in an economically efficient way—that is, by raising the price of fossil fuels through such measures as a carbon tax or tradable permits. Third, the Lieberman–Warner target is somewhat more aggressive than Europe’s goal, measured relative to 1990 emissions, and implies a much more aggressive rate of emissions decline than Europe’s over the period 2012–2050. So far, American support for serious action has lagged behind Europe’s. On the other hand, if China and other developing countries accept quantitative targets, as foreseen under this plan, this will boost domestic American support for tough action. In addition, one could argue that there is more “fat” in US emissions, so one expects that it would be easier to achieve reductions than in Europe or Japan. The terminal level of emissions in 2050 under the formula would still probably be substantially higher than Europe’s, relative to population or GDP. We assume that the average annual emissions growth rate is cut in half during the period 2008–2012, to 0.7 percent per year or 3.5 percent cumulatively, so that emissions in 2012 are 31.5 percent above 1990 levels.20 At that point, we assume emissions plateau (growth is held to zero) for the period 2012–2017. Then we implement the rest of the Lieberman–Warner formula, such that emissions in 2050 reach a level that is 67 percent below 1990 levels. Using our postponed base this is 98.5 percent below 2012 levels, logarithmically. Spread over 38 years, this implies sustained reductions of 2.6 percent per year on average, or 13 percent every five years (which is a more aggressive rate of reduction than Lieberman–Warner). Australia. Canberra has been reluctant to take strong actions because the country is so dependent on coal. In July of 2008, however, Australian Prime Minister Kevin Rudd announced plans to cut emissions to 60 percent below 2000 levels by 2050.21 In the regional groupings of our model, Australia is classified together with South Korea and South Africa. below 2005 levels, close to Lieberman–Warner (Washington Post, May 13, 2008, p. A14; and FT, May 13, 2008, p.4). Barack Obama endorsed a more aggressive target of reducing 2050 emissions 80 percent below 1990 levels (FT, Oct. 17, 2008). 19 That is 67 percent logarithmically. Or a cut of about 62 percent according to J.R. Pegg, Environmental News Service, October 2007. 20 That is, 27 percent logarithmically. 21 A July 16, 2008, government “green paper,” Carbon Pollution Reduction Scheme, reported details on implementation via a domestic cap-and-trade program. Rudd’s initiative appears to have domestic political support (The Economist, July 26, 2008, p.52). The government went on to set a target of 15 percent above 1990 levels by 2020 (FT, Jan. 2, 2009, p.5). 13
  • 14. Korea and South Africa. Until recently it looked unlikely that any “non-Annex I” countries would consider taking on serious cuts below a BAU growth path within the next decade. But in March 2008, the new president of South Korea, Myung-bak Lee, “tabled a plan to cap emissions at current levels over the first Kyoto period.”22 This was an extraordinarily ambitious target in light of Korea’s economic growth rate. He also “vowed his country would slash emissions in half by 2050,”23 like the industrialized countries—of which Korea is now one. Emissions have risen 90 percent since 1990 and it is hard to imagine any country applying the brakes so sharply as to switch instantly from 5 percent annual growth in emissions to zero.24 Perhaps President Lee thinks he can offset growth in South Korean emissions by paying North Korea to reforest. We choose to interpret the Korean plan to flatten emissions as covering a period that stretches out over the next fourteen years, so that in 2022 the level of emissions is the same as in 2007.25 Meanwhile, South African officials evidently announced in 2008 that its emissions would peak by 2025 and begin declining by 2030. 26 China. Getting China to agree to binding commitments is the sine qua non of any successful post-Kyoto plan. Evidently China has announced plans to start cutting GHG emissions in 2030. Presumably that means relative to BAU, rather than in absolute terms.27 Of course 2030 is later than industrialized countries would like. The country is expected to cross the threshold of 1 ton of emissions per capita around 2014 and the threshold of $3000 in annual per capita income by 2022. A standard five- or ten-year lag between treaty signing and budget period would point to a first-cuts budget period around 2024–2027. But persuading Beijing to move the 2030 date up by five years is not as critical as persuading it to accept some quantitative target in 2010, even if that target only reflects BAU. The reason is that if China does not adopt some binding target in the near term, the United States and most developing countries won’t join, and then the entire enterprise will be undone. The key questions thus become (1) how to determine the magnitude of China’s cuts in its first budget period—that is, for the first period in which it is asked to make cuts below BAU; (2) how to determine Korea’s cuts in its second budget period; and (3) how to set targets for everyone else. (The other regions are Latin America—whose stage of 22 “South Korea Plans to Cap Emissions,” International Herald Tribune, March 21, 2008. 23 “South Korea: Developing Countries Move Toward Targets,” Lisa Friedman, ClimateWire, Oct. 3, 2008. 24 This did not stop some environmental groups from criticizing the plan as not sufficiently ambitious. Such criticisms may give political leaders second thoughts about announcing any specific measures at all, as opposed to sticking with banal generalities. 25 One could note, first, that President Lee came to office setting a variety of ambitious goals beyond his power to bring about, especially for economic growth, and second that his popularity quickly plummeted. At the time of writing, his ability to persuade his countrymen to take serious measures was in question. 26 ClimateWire, Oct.3, 2008, op cit. Admittedly, statements from environmental or foreign ministries do not necessarily carry a lot of weight, if they have not been vetted by finance or economics ministries let alone issued by heads of government or approved by parliaments,. An example would be Argentina’s announcement of a target in 1998. 27 This was China’s position in talks near Berlin with five big emerging nations (China, India, South Africa, Brazil and Mexico), ahead of the June 2007 G8 summit in Germany, according to Germany’s environment minister ( FT 3/12/07). 14
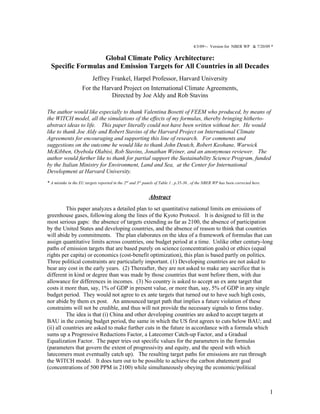
  • 15. development logically implies going after Korea but before China —Russia, Middle East/North Africa, Southeast Asia, India/South Asia, and Africa.) Our general guiding principle is to ask countries only to do what is analogous to what has been done by others who have gone before them. To put this general principle into practice, we apply three factors. Guidelines for formulas that ask developing countries to accept “fair” targets, analogous to those who have gone before This section discusses three factors for determining “fair” emissions targets for developing countries. The three factors are additive (logarithmically). We call the first the Progressive Reductions Factor. It is based on the pattern of emission reductions (relative to BAU) assigned to countries under the Kyoto Protocol, as a function of income per capita. This pattern is illustrated in Figure 1, which comes from the data as they were reported at that time. Other things equal, richer countries are asked to make more severe cuts relative to BAU, the status quo from which they are departing in the first period. Specifically, each 1 percent difference in income per capita, measured relative to EU income in 1997, increases the abatement obligation by 0.14 percent, where the abatement obligation is measured in terms of reductions from BAU relative to the EU cuts agreed at Kyoto. Normally, at least in their early budget periods, most countries’ incomes will be below what the Europeans had in 1997, so that this factor dictates milder cuts relative to BAU than Europe made at Kyoto. In fact the resulting targets are likely to reflect a “growth path”—that is, they will allow for actual emission increases relative to the preceding periods. The formula is: PRF expressed as country cuts vs. BAU = EU's Kyoto commitment for 2008 relative to its BAU + .14 * (gap between the country’s income per capita and the EU’s 2007 income per capita). The parameter (0.14) was suggested ordinary least squares (OLS) regression estimates on the data shown in Figure 1. Other parameters could be chosen instead, if the parties to a new agreement wanted to increase or decrease the degree of progressivity. 15
  • 16. Figure 1: The Emissions Cuts Agreed at Kyoto Were Progressive with Respect to Income, when Expressed Relative to BAU 50% Percent reduction from 2010 business-as-usual . 40% 30% 20% 10% 0% -10% -20% -30% 500 1,000 2,000 5,000 10,000 20,000 50,000 2.699 3.699 4.699 1996 GDP per capita (1987 US dollars, ratio scale) Sources: The World Bank, the U.S. Energy Information Administration, and national communications to the UNFCCC The Latecomer Catch-up Factor is the second element in the formula. Latecomers are defined as those countries that have not ratified Kyoto or for which Kyoto did not set quantitative targets. (Perhaps it would also include those like Canada that ratified the treaty but, based on current trends, are not expected to meet the goal.) The formula would be badly designed if it rewarded these countries by permanently readjusting their targets to a higher baseline. Aside from notions of fairness, such re- basing would give all latecomers an incentive to ramp up their emissions before signing on to binding targets, or at a minimum would undercut any socially-conscious incentives they might otherwise introduce to reduce emissions unilaterally in the time period before they join the system. Thus the Latecomer Catch-up factor is designed to gradually close the gap between the starting point of the latecomers and their 1990 emission levels. It is parameterized according to the numbers implicit in the Lieberman bill to bring US emissions to 70 percent below 1990 levels by 2050 and the Lee goal to flatten South Korea’s emissions over a period beginning in 2008. In other words, countries are asked to move gradually in the direction of 1990 emissions in the same way that the United States and Korea under current plans will have done before them. 16
  • 17. The formula for a country’s Latecomer Catch-up Factor (LCF) is as follows. Further percentage cuts (relative to BAU plus a Progressive Reductions Factor) are proportional to how far emissions have been allowed to rise above 1990 levels by the time the country joins in. That is, it is given by: LCF = α + λ percentage gap between country’s lagged emissions and 1990 emissions The parameter λ represents the firmness with which latecomers are pulled back toward their 1990 emission levels. The value of λ implicit for Europe at the time the Kyoto Protocol was negotiated was sufficient to pull the EU-average below its 1990 level. But to calibrate this formula, the most relevant countries are not European (since the Europeans are not latecomers), but rather the United States and Korea, since these are the only countries among those that did not commit themselves to Kyoto targets whose political leaders have said explicitly what targets they are willing to accept in the second budget period. The parameters α and λ were chosen as the unique solutions to two simultaneous equations representing the US target in bills sponsored by Senator Lieberman and the Korean target (a flattening of emissions being interpreted here as holding absolute emissions in 2022 equal to 2007 levels). The parameters then work out to α = 0.2115 and λ = -0.3400 Thus: LCF = 0 .2115 -0 .3400 log(country’s current emissions / country’s 1990 emissions) 28 The third element is the Gradual Equalization Factor (GEF). Even though developing countries under this plan benefit from delaying abatement efforts until after the rich countries have begun to act, and face milder reduction requirements, they will still complain that it is the rich countries that originally created an environmental problem for which the poor will disproportionately bear the costs, rather than the other way around. Such complaints are not unreasonable. If we stopped with the first two factors, the richer countries would be left with the permanent right to emit more GHGs, every year in perpetuity, which seems unfair. In the short run, pointing out the gap in per capita targets is simply not going to alter the outcome. The poor countries will have to live with it. Calls for the rich countries to cut per capita emissions rapidly, in the direction of poor-country levels, ignore the fact that the economic costs of such a requirement would be so astronomical that no rich country would ever agree to it. The same goes for calls for massive transfer payments from the rich to the poor (as in a call by the Group of 77 developing countries) When one is talking about a lead time of 50 to 100 years, however, the situation changes. With time to adjust, the economic costs are not as impossibly high, and it is reasonable to ask rich countries to bear their full share of the burden. Furthermore, over a time horizon this long some of the poor countries will in any case become rich (and possible vice versa). 28 If Korea were to back away from its president’s commitment in light of recent economic difficulties, but some other important middle-income country were to step up to the plate with explicit and specific numerical targets, then the calculation could be redone. 17
  • 18. Accordingly, during each decade of the second half of the century, the formula includes an equity factor that moves per capita emissions in each country a small step in the direction of the global average. This means downward in the case of the rich countries and upward in the case of the poor countries. Asymptotically, the repeated application of this factor would eventually leave all countries with equal emissions per capita, although corresponding national targets would not necessarily converge fully by 2100.29 The parameter (δ) for the speed of adjustment in the direction of the world average was initially chosen to match the rate at which the EU’s already-announced goals for 2045–2050 converge to the world average. This number is δ=0.1 per decade, which is also very similar to the rate of convergence implicit in the goals set by the Lieberman bills for the United States during 2045–2050. Thus: GEF = -0 .1 ( percentage gap between country’s lagged emissions per capita and the world’s). We expected to have to adjust the δ parameter, and indeed to add a fourth parameter for the “aggressiveness” of global emissions targets, in order to ensure that no single country was confronted with costs above our threshold constraint while still achieving a relevant global environmental goal in 2100. By lucky coincidence, our initial method of computing δ satisfied the economic objectives and delivered year-2100 atmospheric CO2 concentrations of 500 ppm. In extensions of this research—where, for example, we try to hit a year-2100 goal of 450 ppm—we will have to adjust δ and probably will need to add an aggressiveness parameter, while also adjusting some countries’ start dates. One possibility is to write an algorithm that searches over these parameters so as to find values that minimize the threshold of economic cost to any given country for any given year-2100 environmental goal. The formulas are summarized overall as follows: Log Target (country i, t) = log (BAU i, t ) – (PCF i, t ) + (LCF i, t ) + (GEF i, t ) , where the three factors (except in periods when set = 0 as indicated in Table 2) are given by: PCF i,t = log (emission target EU 2008/ BAU EU 2008) + 0.14 log (country i's income/cap t-1 / EU income/cap 2007); LCF i,t = 0.2115 - 0.3400 log (country i's emissions t-1 / country i's emissions 1990). GEFi,t = - 0.1 log (country i's emissions per capita t-1 / global average emissions per capita t-1). 29 Zhang (2008) and others, motivated by a rights-based approach, propose that countries “contract and converge” to targets that reflect equal emissions per capita. The Greenhouse Development Rights approach of Baer et al. (2008), as extended by Cao (2008), emphasizes, from a philosophical standpoint, the allocation of emission rights at the individual level, though these authors apparently recognize that, in practice, individual targets would have to be aggregated and implemented at the national level. 18
  • 19. The numerical emission target: paths that follow from the formulas Table 1, at the end of the chapter, reports the emissions targets produced by the formulas for each of eleven geographical regions, for every period between now and the end of the century. We express the emission targets in several terms: • in absolute tons (which is what ultimately matters for determining economic and environmental effects) • in per capita terms (which is necessary for considering any issues of cross-country distribution of burden) • relative to 1990 levels, which is the baseline used for Kyoto, and which remains relevant in our framework in the form of the Latecomer Catch-up term, and • relative to the BAU path, which is important for evaluating the sacrifice asked of individual countries as they join the agreement in the early decades. The eleven regions are: EUROPE = Old Europe and New Europe US = United States KOSAU = Korea, South Africa, and Australia (3 coal-users) CAJAZ = Canada, Japan, and New Zealand TE = Russia and other Transition Economies MENA = Middle East and North Africa SSA = Sub-Saharan Africa SASIA= India and the rest of South Asia CHINA = PRC EASIA = Smaller countries of East Asia LACA = Latin America and the Caribbean In the first version of this exercise, China sells over a gigaton of carbon in 2040. Its permit sales fall off thereafter, as its target kicks in; but Southeast Asian countries take its place, selling similar quantities in the last two decades of the century. Southeast Asia and sub-Saharan Africa registered rather substantial economic gains toward the end of the century.30 These gains reflect the benefits of being spared emissions cuts and being able to sell permits to richer countries during the period when those countries are already implementing reductions. Some may judge it appropriate that poor countries register net economic gains from the abatement regime, since these are also the countries that will bear the heaviest burden from climate change in any case (by virtue of the fact that most are located nearer the equator and rely on large agricultural sectors). But we judge the massive international transfers that are implicit in this scenario to be highly unsustainable politically. They are not necessary in any case to satisfy the key economic and political constraints laid out at the beginning of this chapter. Accordingly, subsequent versions of the exercise assign Southeast Asia and Africa emission targets somewhat below BAU in the latter half of the century, with the result that they do not gain so much for the century as a whole. In addition we move forward by ten years the date at which China is asked to take on below-BAU targets and by five years the date at which the Middle East and North African (MENA) countries are asked to do so. An additional reason for this change was to reduce the slackening in global targets—observable as a dip in the price of carbon—that would otherwise occur around 2035. Results for the case where the four developing regions are given more stringent (earlier) targets are given in Tables 1 and 3b, and in the corresponding figures. Table 2 summarizes the dates at which all countries are asked to take on BAU targets and 30 Figures 2a-6a and Table 3a here; or Figures 2-8 and Tables 1 and 2 – especially Figure 7 -- in HPICA Discussion Paper 08-08, October 2008. 19
  • 20. then reductions below BAU as governed by the different formula elements discussed previously (i.e., PRF, LCF, and then GEF). The United States, even more than other rich countries, is currently conspicuous by virtue of its high per capita emissions.31 But its target path peaks after 2010 and then begins to decline. Emissions in all the rich regions peak by 2015, and then start to decline. Figure 2a reports aggregate targets for member countries of the Organisation for Economic Co-operation and Development (OECD). It also shows actual emissions, which decline more gradually than the targets through 2045 because about 1 million metric tons (equal to 1 gigaton or Gt) of carbon permits are purchased on the world market, as is economically efficient, out of roughly 4 Gt. (Permit sales to the richer countries exceed 1 Gt more often in the version where Southeast Asia and Africa are never asked for targets below BAU, and China and MENA start cutting emissions below BAU only at later dates.) Though the OECD countries buy a substantial amount of reductions in the early decades, it is always less than half their total reductions. The share falls off sharply in the second half of the century. We assume no banking. Figure 2a: Emissions path for industrialized countries in the aggregate -- with later targets for developing countries (Note: Predicted actual emissions exceed caps by amount of permit purchases) OECD Emissions 7 6 5 BA U GtC 4 Simulated Emissions 3 CA P 2 1 0 0 0 0 0 0 0 0 0 0 0 2 3 5 6 8 9 0 1 4 7 0 0 1 0 0 0 0 0 0 0 2 2 2 2 2 2 2 2 2 2 31 As shown in Figure 2 of HPICA Discussion Paper 08-08. The figure is omitted here to save space. 20
  • 21. Figure 2b: Emissions path for industrialized countries in the aggregate -- with earlier targets for developing countries (Note: Predicted actual emissions exceed caps by amount of permit purchases) OECD Emis ions s 7 6 5 BA U GtC 4 Simulated E iss ions m CA P 3 2 1 0 0 0 5 0 5 0 5 0 1 2 4 5 7 8 1 0 0 0 0 0 0 2 2 2 2 2 2 2 Figure 3a: Emission paths for poor countries in the aggregate -- with later targets for developing countries (Note: Predicted actual emissions fall below caps by amount of permit sales) NON OECD Emissions 20 13 BAU GtC Simulated Emissions CAP 7 0 5 0 5 5 0 0 0 2 4 5 8 0 1 7 0 0 0 0 0 1 0 2 2 2 2 2 2 2 21
  • 22. Figure 3b: Emission paths for poor countries in the aggregate -- with earlier targets for developing countries (Note: Predicted actual emissions fall below caps by amount of permit sales) NON OECD Emissions 20 BA U 13 Simulated Emissions GtC CA P 7 0 5 0 0 0 0 5 5 2 0 1 4 5 7 8 0 0 0 0 0 0 1 2 2 2 2 2 2 2 Figure 4a: Emissions path for the world, in the aggregate -- with later targets for developing countries World Industrial Carbon Emissions 25 20 bau 15 GtC 10 Sim ulated 5 Em is s ions 0 0 5 0 5 5 0 5 0 5 6 2 3 8 9 0 0 0 0 0 0 0 2 2 2 2 2 2 2 22
  • 23. Figure 4b: Emissions path for the world, in the aggregate -- with earlier targets for developing countries World Industrial Carbon Emissions 25 bau 20 GtC 15 Sim ulated 10 Em is s ions 5 0 0 5 0 5 5 0 5 2 6 0 3 5 8 9 0 0 0 0 0 0 0 2 2 2 2 2 2 2 Emissions in the non-rich countries, the TE group (transition economies), MENA, China, and Latin America all peak in 2040.32 Emissions in sub-Saharan Africa and the smaller East Asian economies all remain at very low levels throughout the century. Figure 3a shows that among non-OECD countries overall, both emissions targets and actual emissions peak in 2040, with the latter substantially below the former. In other words, the poor countries emit below their targets and sell permits to the rest. Total world emissions peak in 2045 at a little above 10 Gt, in the case where China and MENA are given the later starting points (Figure 4a). They peak ten years earlier, and without exceeding 10 Gt, in the case where China and MENA are given the earlier starting points (Firgure 4b). In either case, emissions subsequently decline rather rapidly, falling below 5 Gt by 2090. Thanks to the post-2050 equalization formula, emissions per capita converge nicely in the long run, falling to below 1 ton per capita toward the end of the century.33 Economic and environmental consequences of the numerical targets, according to the WITCH model Estimating the economic and environmental implications of these targets is a complex task. There are many fine models out there.34 I was fortunate to link up with the WITCH model of FEEM (Fondazione Eni Enrico Mattei, in Milan), as applied by Valentina Bosetti. 32 Figure 2 of HPICA Discussion Paper 08-08. 33 Figure 2 of HPICA Discussion Paper 08-08. 34 Researchers have applied a number of different models to estimate the economic and environmental effects of various specific emission paths; see, for example, Edmonds, Pitcher, Barns, Baron, and Wise (1992); Edmonds, Kim, McCracken, Sands, and Wise (1997); Hammett (1999); Manne, Mendelsohn, and Richels (1995); Manne and Richels (1997); McKibbin and Wilcoxen (2006); and Nordhaus (1994, 2008). Weyant (2001) provides an explanation and comparison of different models. 23
  • 24. WITCH (www.feem-web.it/witch) is an energy-economy-climate model developed by the climate change modeling group at FEEM. The model has been used extensively in the past three years to analyze the economic impacts of climate change policies. WITCH is a hybrid top-down economic model with energy sector disaggregation. Those who might be skeptical of economists’ models on the grounds that “technology is the answer” can rest assured that technology is central to this model. (Economists are optimists when it comes to what new technologies might be called forth by a higher price for carbon, but pessimists when it comes to how much technological response to international treaties will occur absent an increase in price.) The model features endogenous technological change via both experience and innovation processes. Countries are grouped in twelve regions, when Western Europe and Eastern Europe are counted separately, that cover the world and that strategically interact following a game theoretic set-up. The WITCH model and detailed structure are described in Bosetti et al. (2006) and Bosetti, Massetti, and Tavoni (2007). Original baselines in many models have been disrupted in recent years by such developments as stronger-than-expected growth in Chinese energy demand and the unexpected spike in world oil prices that culminated in 2008. WITCH has been updated with more recent data and revised projections for key drivers such as population, GDP, fuel prices, and energy technology characteristics. The base calibration year has been set at 2005, for which data on socio-economic, energy, and environmental variables are now available (Bosetti, Carraro, Sgobbi, and Tavoni 2008). Economic effects While economists trained in cost-benefit analysis tend to focus on economic costs expressed as a percentage of GDP, the politically attuned tend to focus at least as much on the predicted carbon price, which in turn has a direct impact on the prices of gasoline, home heating oil, and electric power.35 Figure 5a: Price of Carbon Dioxide Rises Slowly Over 50 Years, then Rapidly -- with later targets for developing countries Price of Carbon Permits 800 700 600 $/tCO2e 500 400 FRANKEL 300 Architecture 200 100 0 2005 2020 2035 2050 2065 2080 2095 Zoom on Price of Carbon Permits 140 120 100 $/tCO2e 80 35 Frankel (1998). This attitude may seem irrational to an 60 economist; after all, price effects are largely FRANKEL Architecture redistributional. But the public’s instincts may be correct 40 insofar as predicted price effects are more 20 reliable indicators of the degree of economic dislocation caused by a carbon policy than GDP losses, which 0 are subject to larger modeling uncertainty. Furthermore, distributional effects are 2035 drivers of political 2005 2015 2025 key 2045 support or opposition to a particular policy. 24
  • 25. Figure 5b: Price of Carbon Dioxide Rises Slowly Over 50 Years, then Rapidly -- with earlier targets for developing countries Price of Carbon Permits 1000 800 $/tCO2e 600 FRANKEL 400 Architecture 200 0 2005 2020 2035 2050 2065 2080 2095 Zoom on Price of Carbon Permits 180 160 140 120 $/tCO2e 100 80 FRANKEL 60 Architecture 40 20 0 2005 2015 2025 2035 2045 Based on the WITCH simulations conducted for this analysis, the world price of CO2 surpasses $20 per ton in 2015, as Figure 5 shows. It is then flat until 2030, as a consequence of the assumption that major developing countries do not take on major emission cuts before then. The price even dips slightly before beginning a steep ascent, an undesirable feature. It climbs steadily in the second half of the century, as the formula-based targets begin to bite seriously for developing countries. Before 2050 the carbon price has surpassed $100 per ton of CO2. Only toward the end of the century does it level off, at almost $700 per ton of CO2 in the case where some developing countries are spared early cuts, and at $800 per ton in the case where they are not spared. Most regions sustain economic losses that are small in the first half of the century —under 1 percent of GDP—but that rise toward the end of the century.36 Given a positive rate of time discount, this is a good outcome. No region in any period experiences costs in excess of our self-imposed threshold of 5 percent of GDP. The estimated costs of the policy to each country-group, in present discounted value (PDV) 36 Figure 7 of HPICA Discussion Paper 08-08, omitted here to save space, illustrates economic costs, expressed as fractions of GDP, by region, for the case where the developing countries take on later targets.. In this scenario, the highest decade costs are borne by China, just toward the end of the century, reaching 4.1% of GDP in 2100. (On the other hand the PDV of China’s cost is less than those of the United States and several other regions.) The maximum GDP loss for the United States in any decade is 1.9%, and for the EU 1.4%, both occurring around 2080. 25
  • 26. terms, are reported in Table 3a. No country is asked to incur costs that are expected to exceed 1 percent of GDP over the century. Only China’s costs creep up to 1.1% of GDP, when it takes on an earlier target, in Table 3b. (All economic effects are gross of environmental benefits—that is, no attempt is made to estimate environmental benefits or net them out.) These costs of participation are overestimated, and increasingly so in the later decades, if the alternative to staying in the treaty one more decade is dropping out after seven or eight decades of participation. The reason is that countries will have already substantially altered their capital stock and economic structure in a carbon-friendly direction. The economic costs reported in the simulations and graphs treat the alternative to participation as never having joined the treaty in the first place. Figure 6 provides Gross World Product loss aggregated across across regions worldwide, and discounted to present value using a discount rate of 5 percent. Total economic costs come to 0.24 percent of annual gross world product in the case where China and MENA start later and Southeast Asia and Africa are not given targets below BAU. Overall policy costs come to 0.65 percent in the case where the former two start earlier, the latter two are given targets below BAU, and as a result the price of carbon hits $800 per ton. 26
  • 27. Figure 6: Loss of Aggregate Gross World Product by Budget Period, 2015-2100 -- with later targets for developing countries GWP loss 0.0% 5 5 5 5 5 5 5 5 5 5 1 2 3 4 5 6 7 8 9 0 -0.1% 0 0 0 0 0 0 0 0 0 0 2 2 2 2 2 2 2 2 2 2 -0.2% -0.3% -0.4% FRA NKEL A rchitecture -0.5% -0.6% -0.7% -0.8% Environmental effects The outcome of this plan in terms of cumulative emissions of GHGs is close to those of some models that build in environmental effects or science-based constraints, even though no such inputs were used here. The concentration of CO2 in the atmosphere stabilizes at 500 ppm in the last quarter of the century. Figure 7a: CO2 concentrations nearly achieve year-2100 concentration goal of 500 ppm -- with later targets for developing countries Carbon Conce ntrations (CO2 only) 800 750 bau 700 650 ppmv 600 550 FRANK 500 EL 450 Archite cture 400 350 300 5 5 5 5 5 5 5 5 5 5 5 0 1 2 4 7 9 3 5 6 8 0 0 0 0 0 0 0 0 1 0 0 0 2 2 2 2 2 2 2 2 2 2 2 27