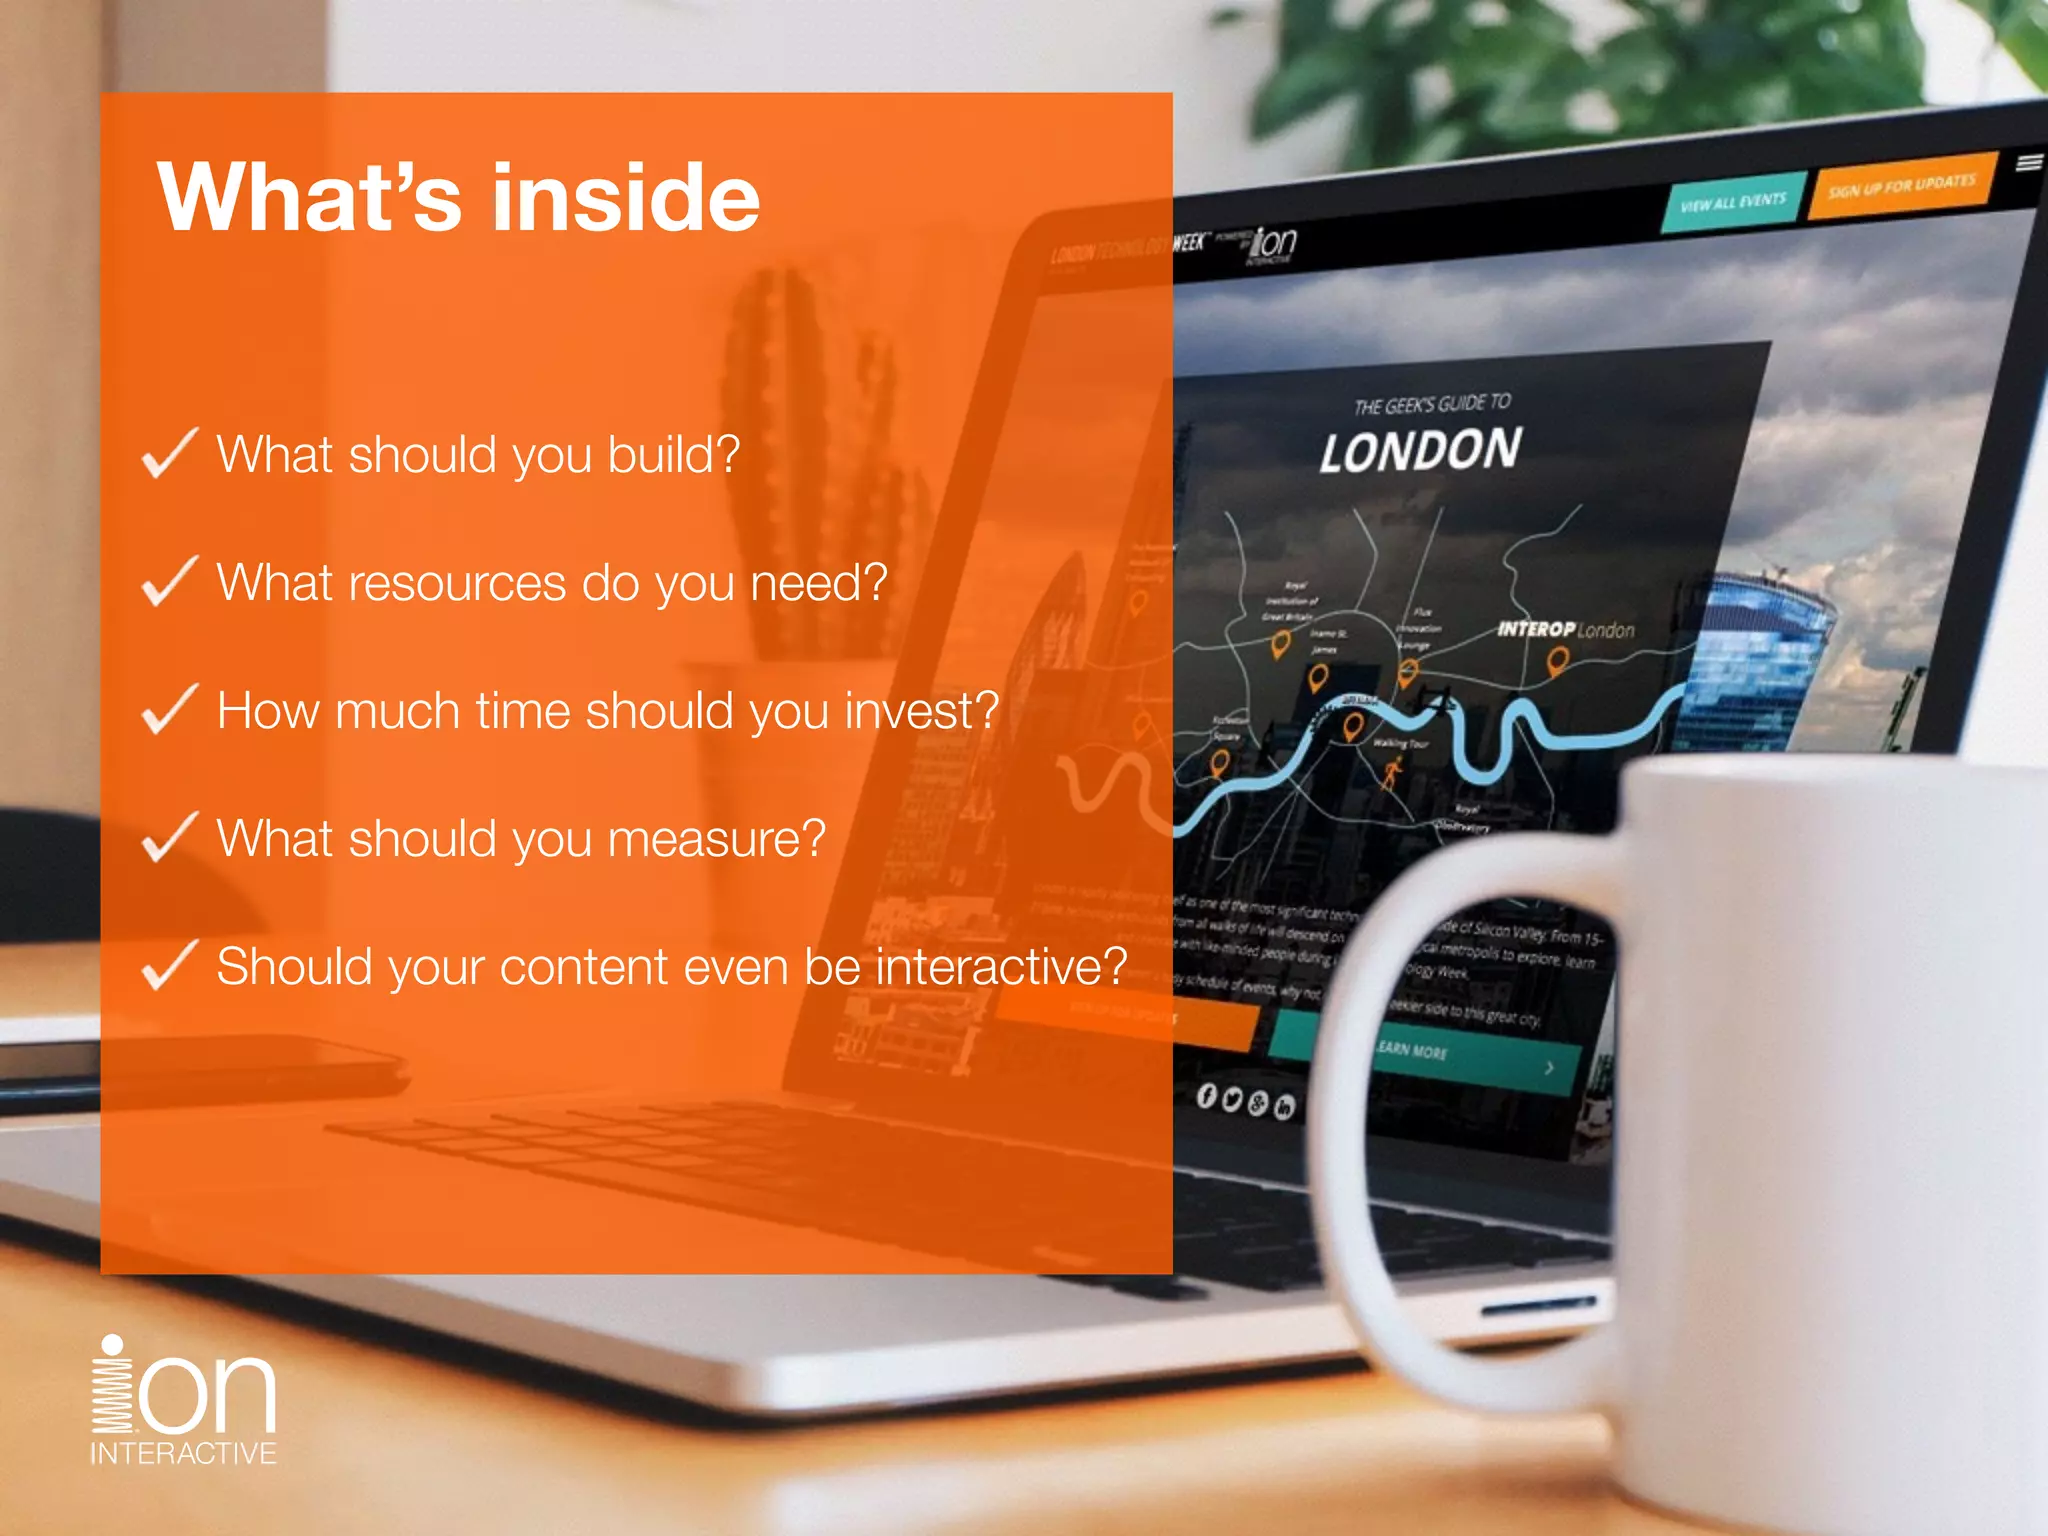
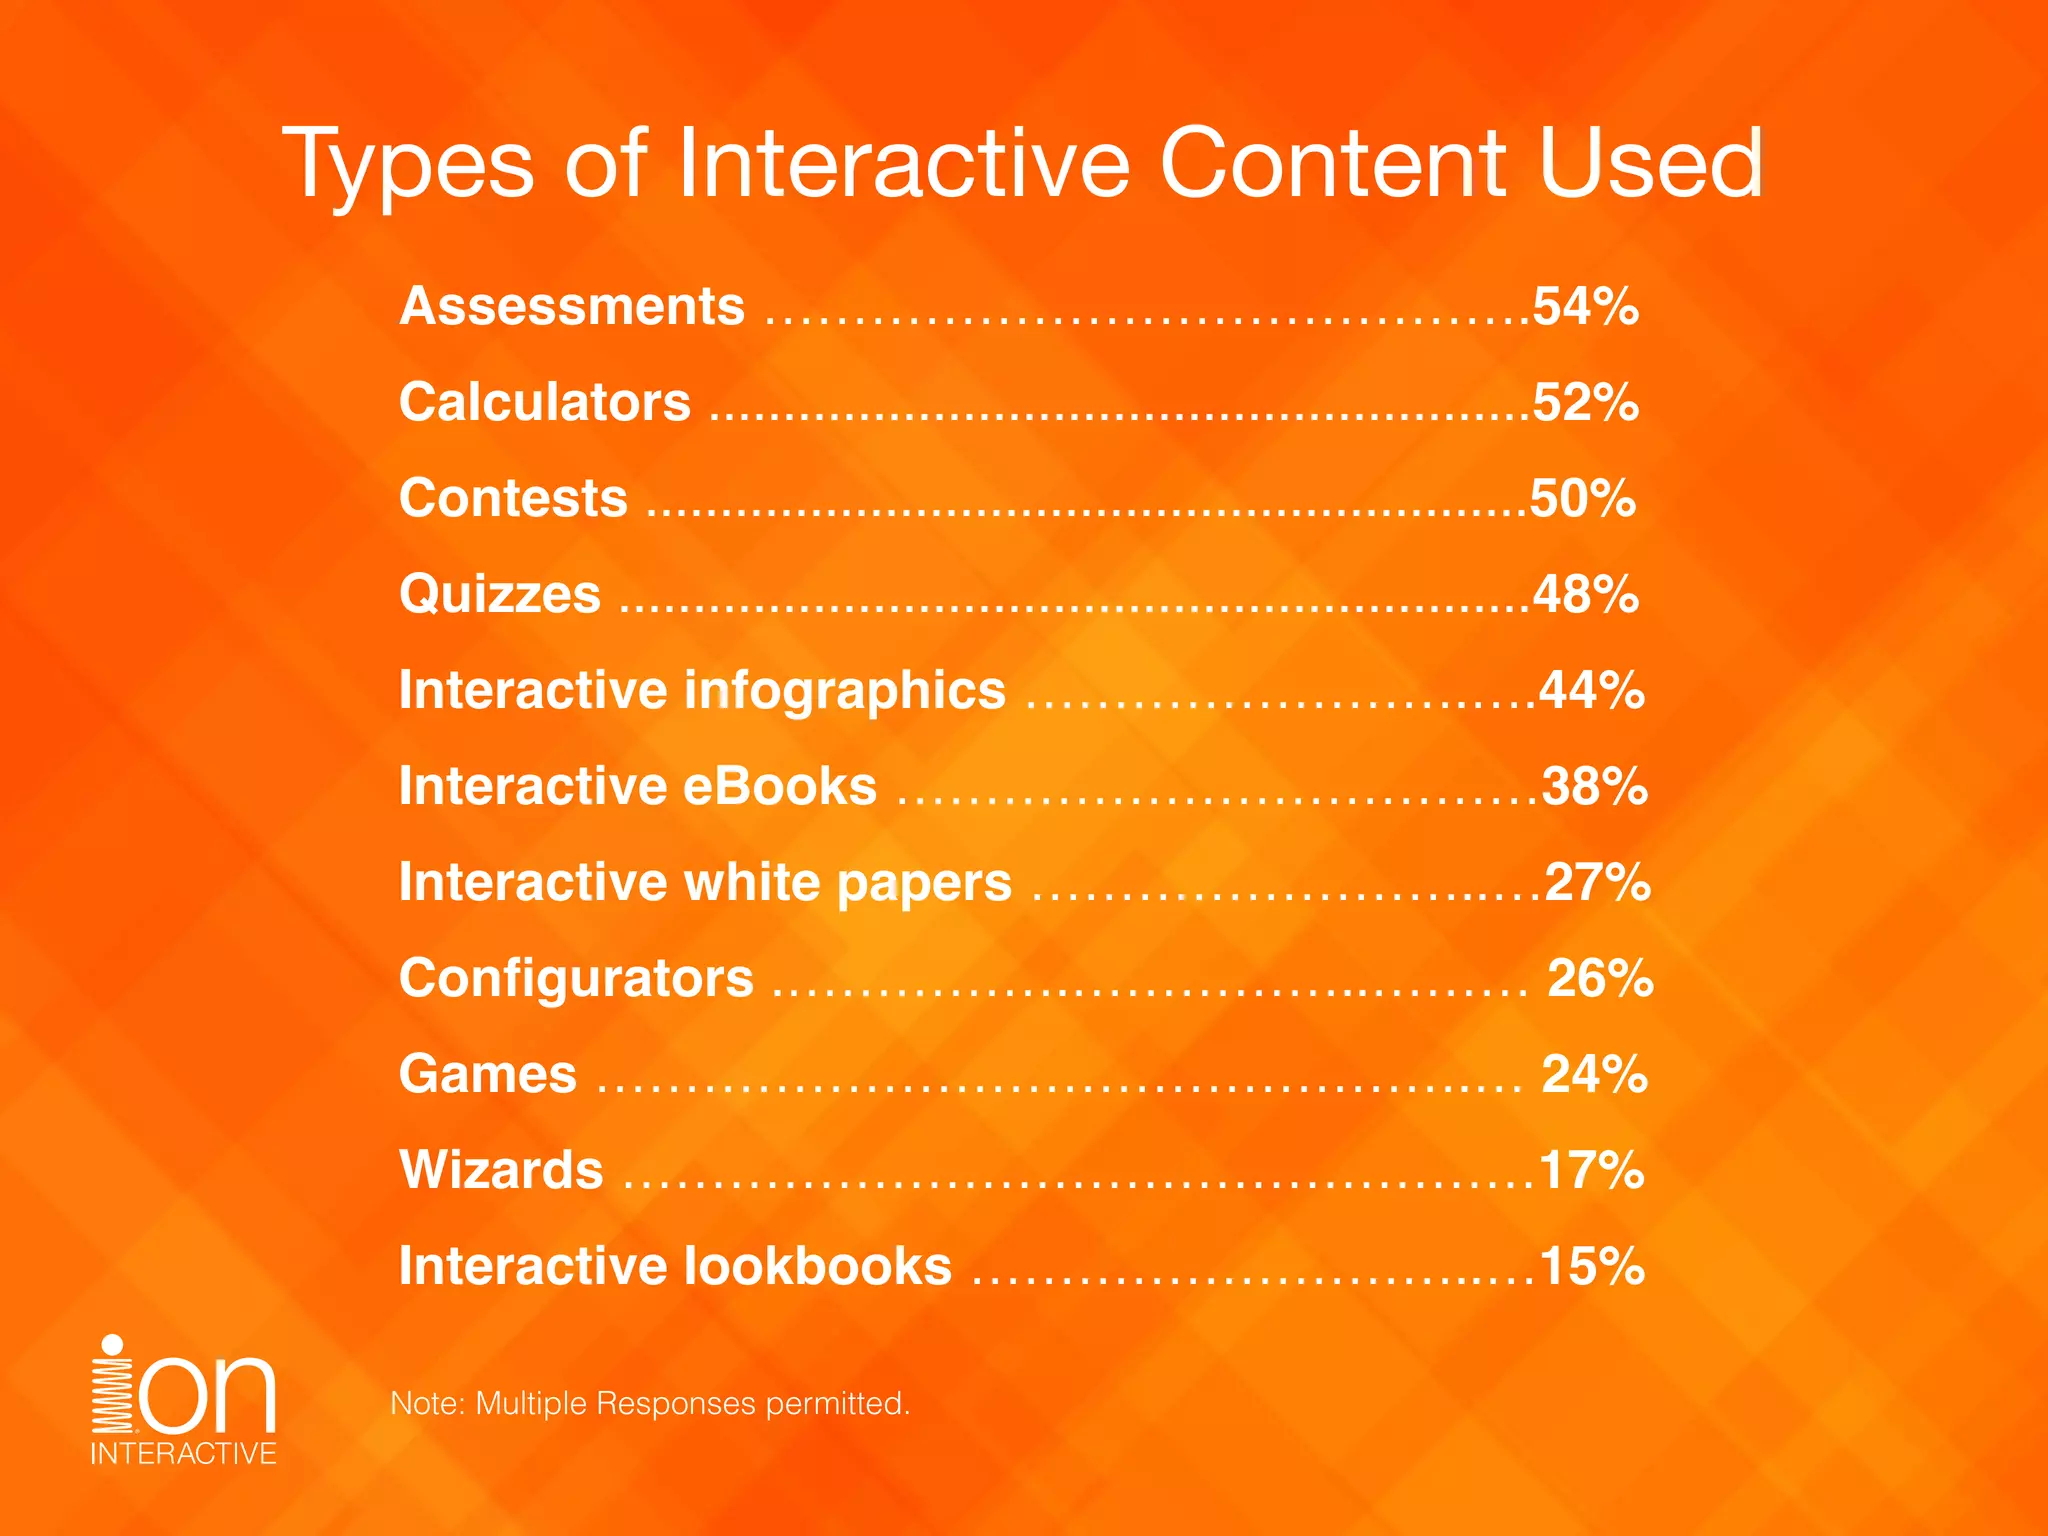
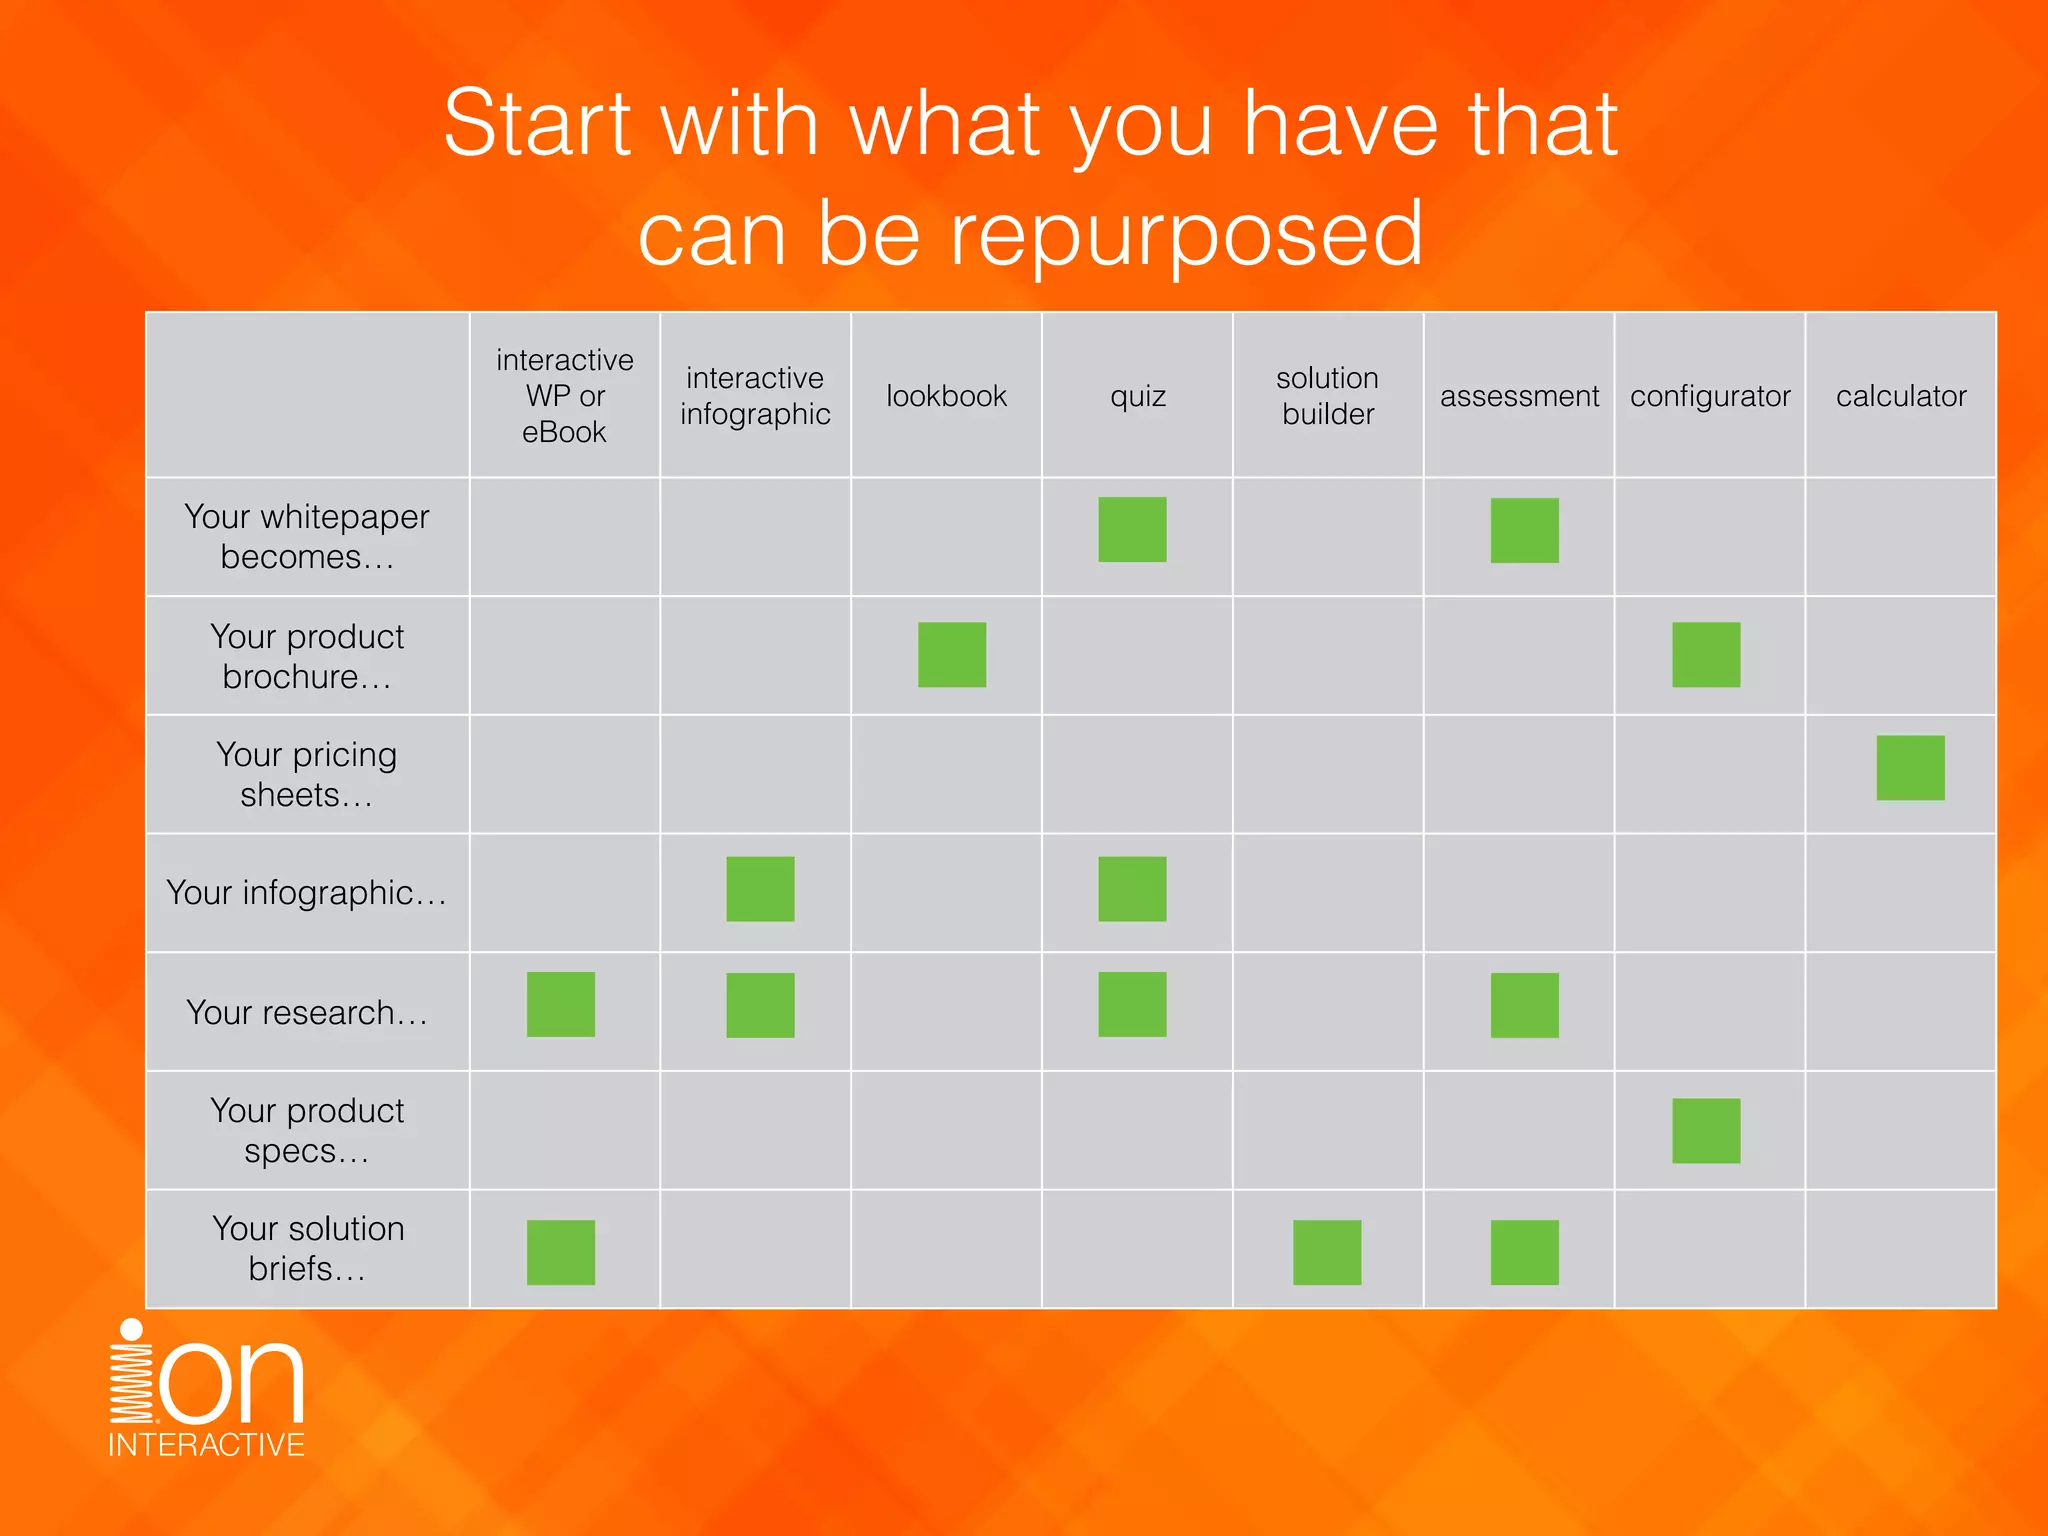
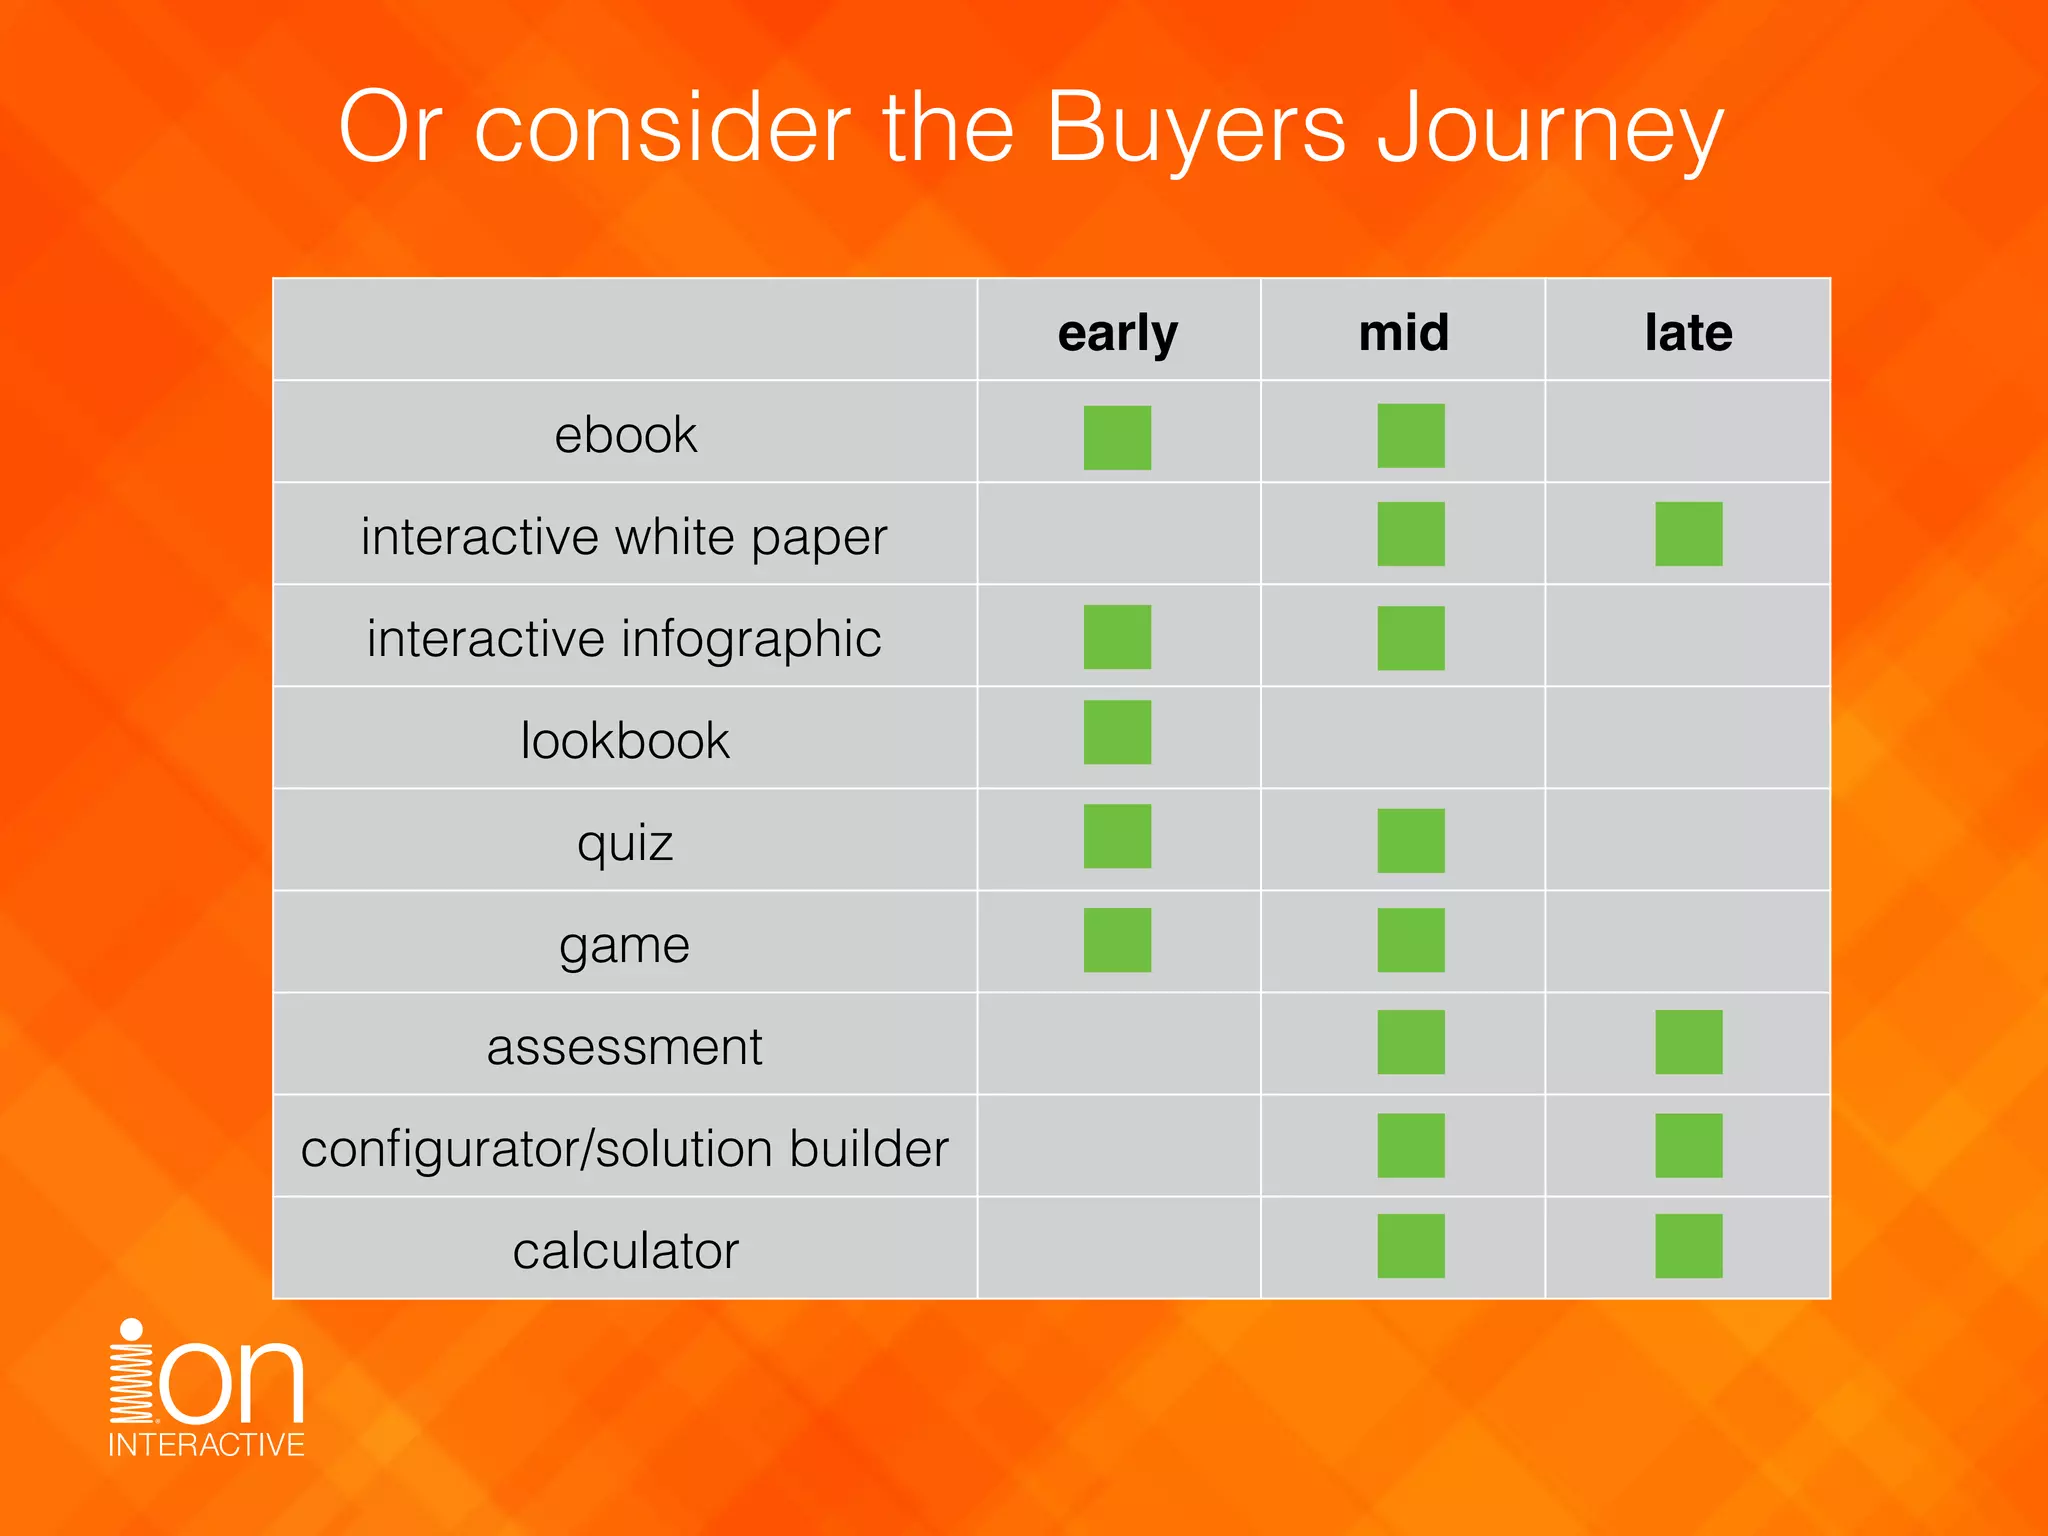
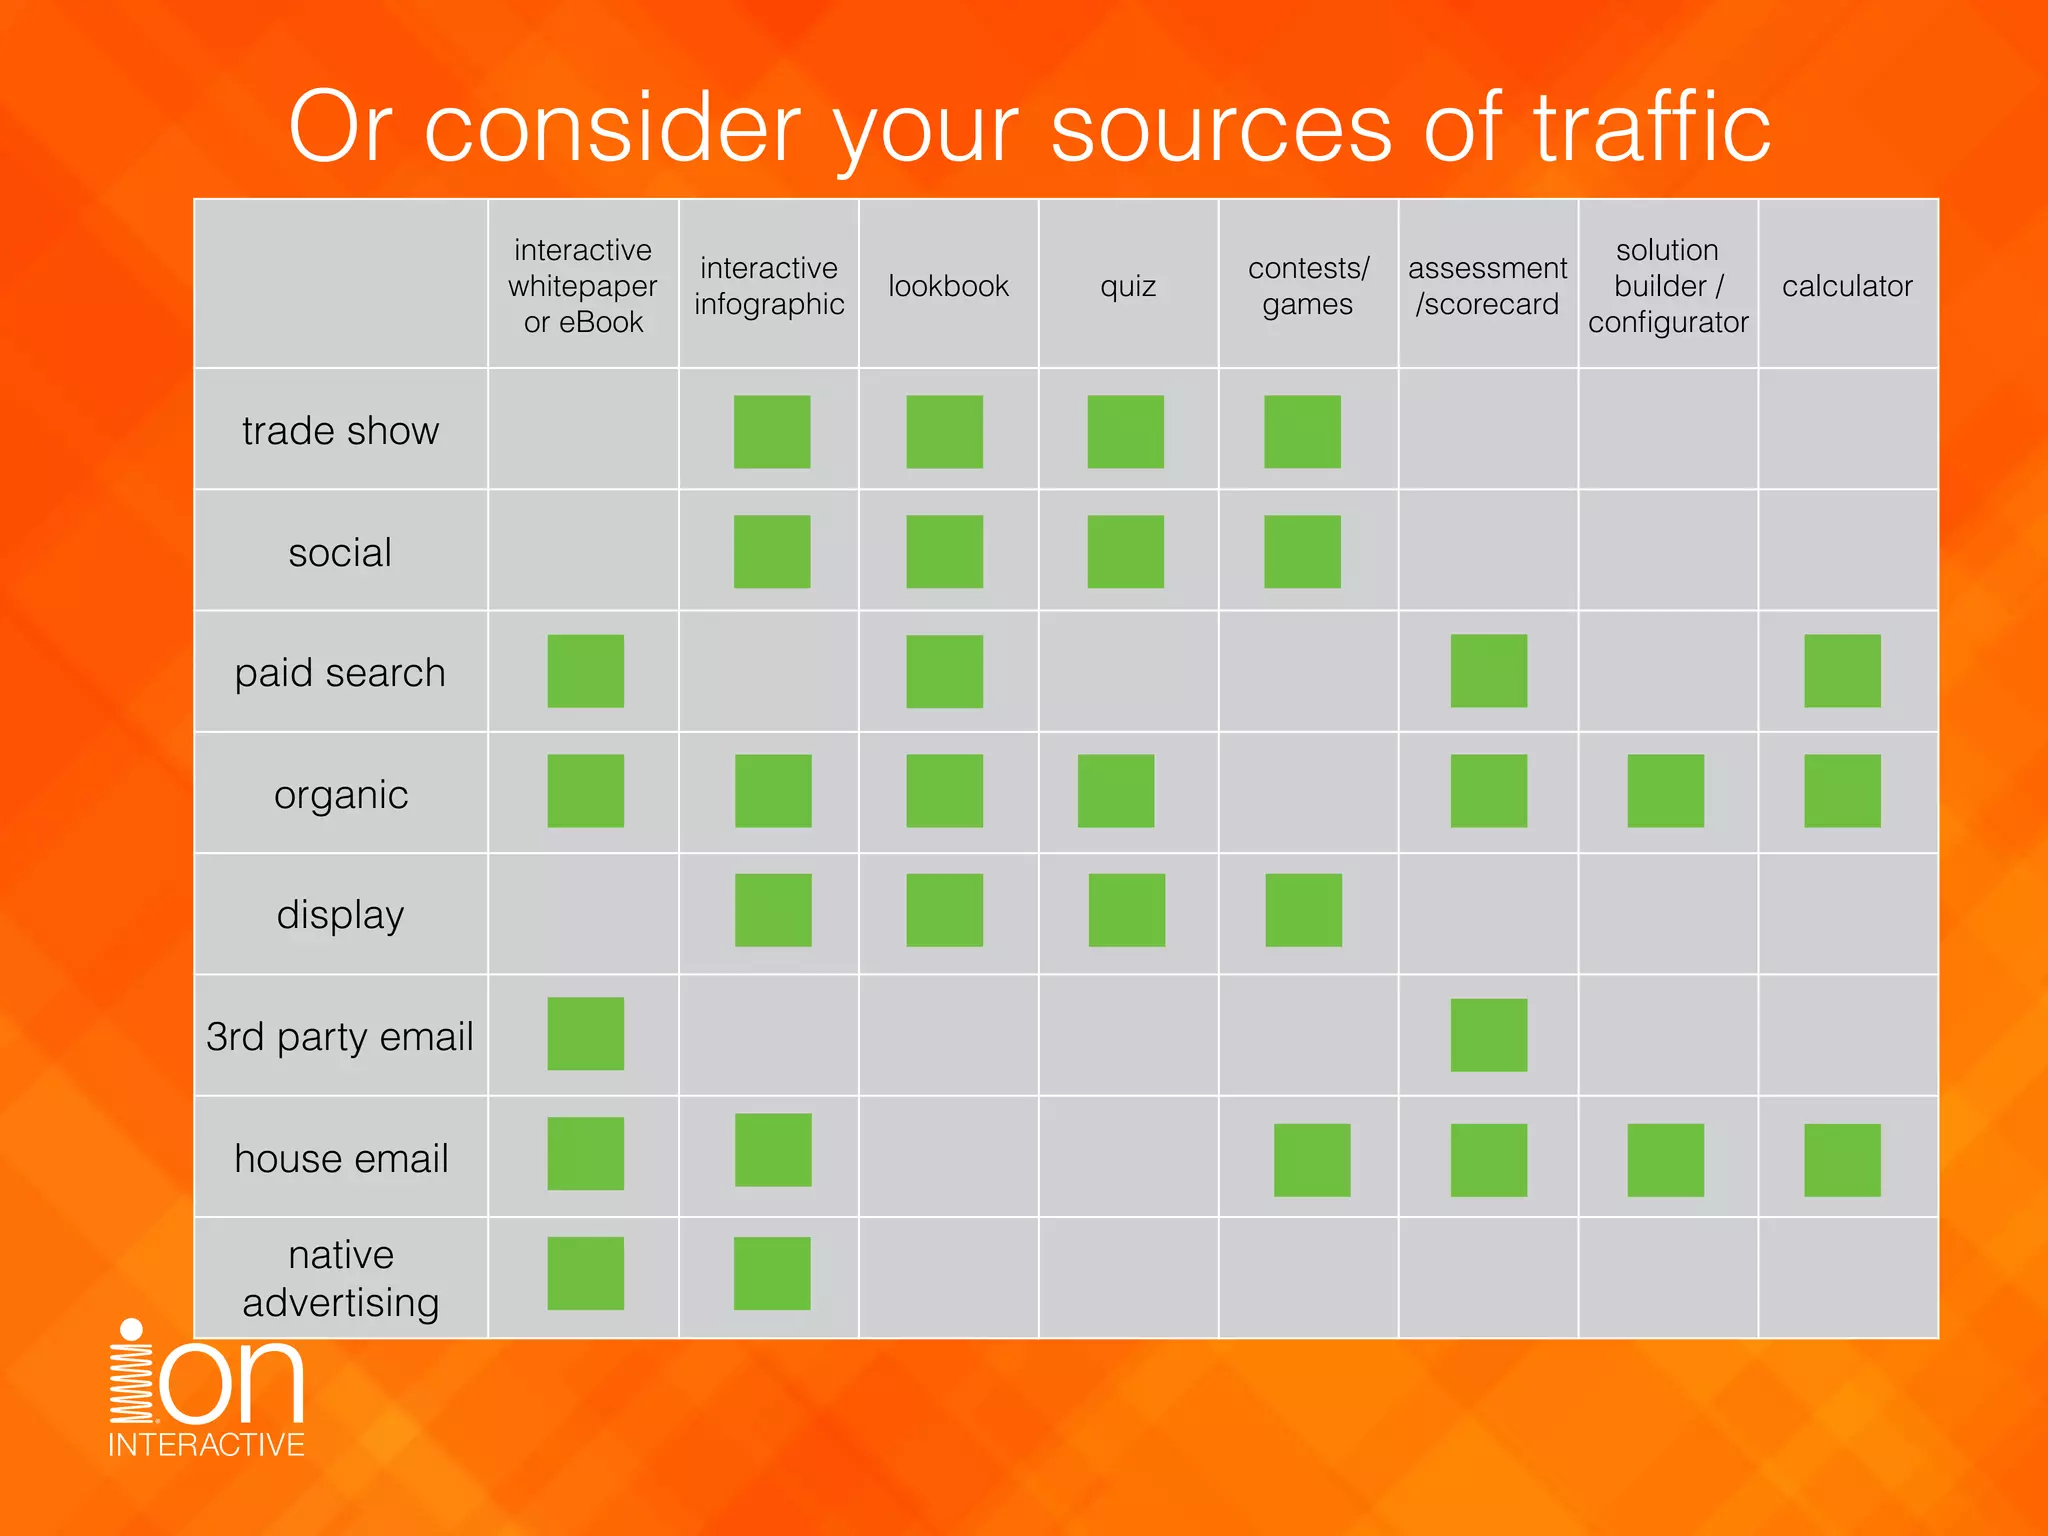
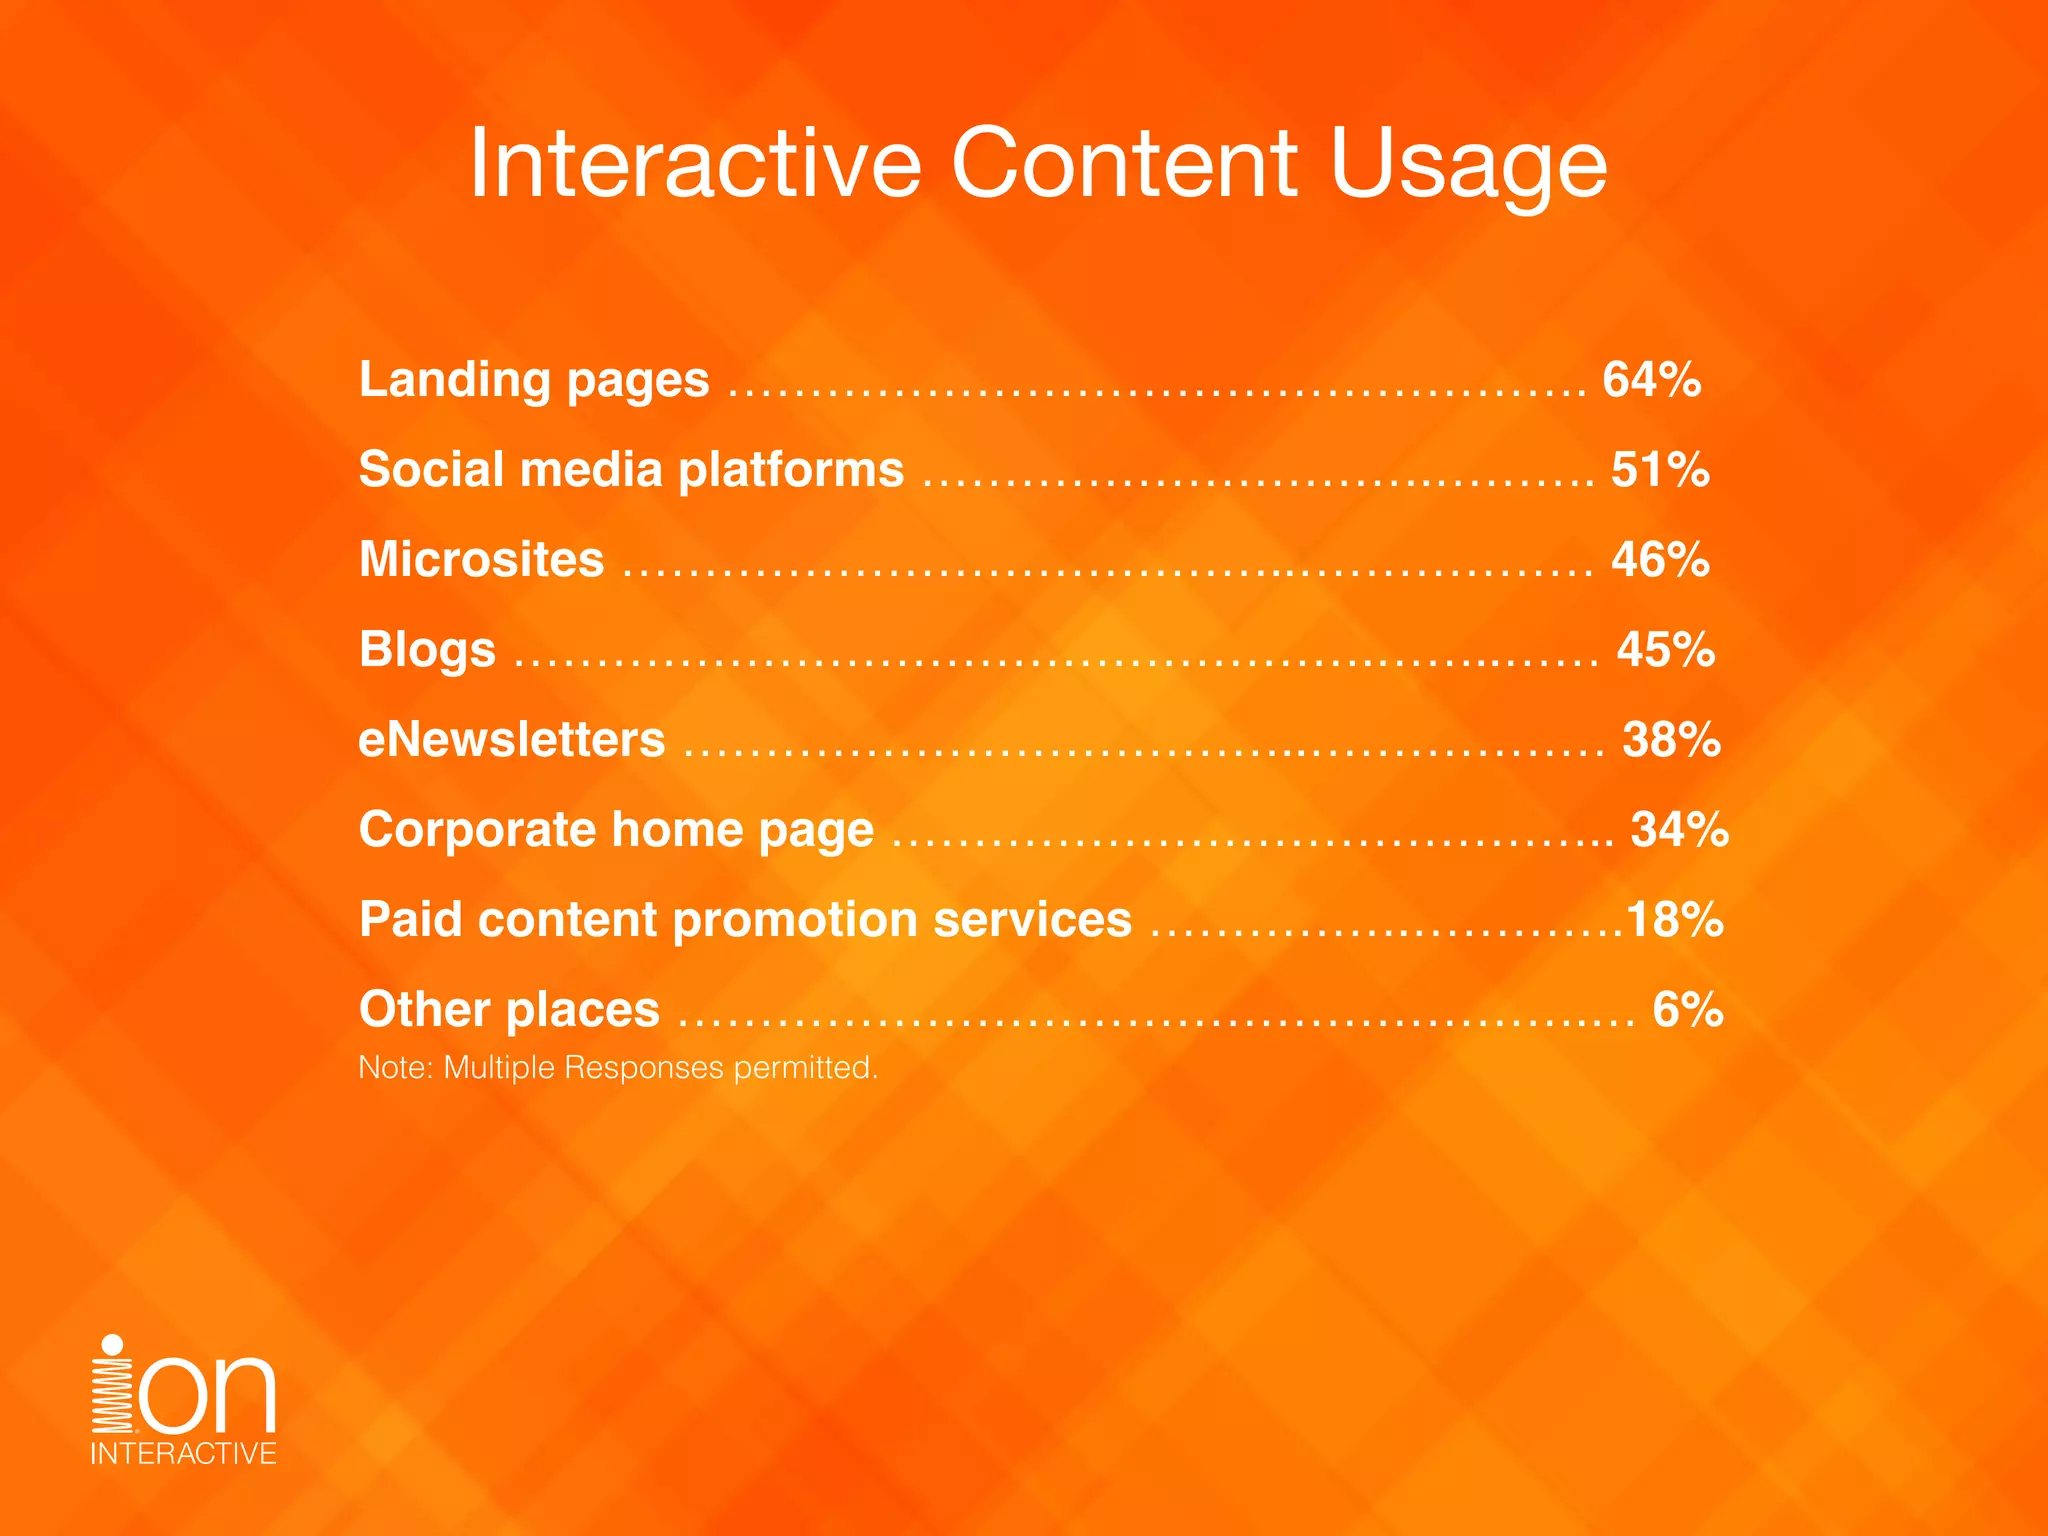
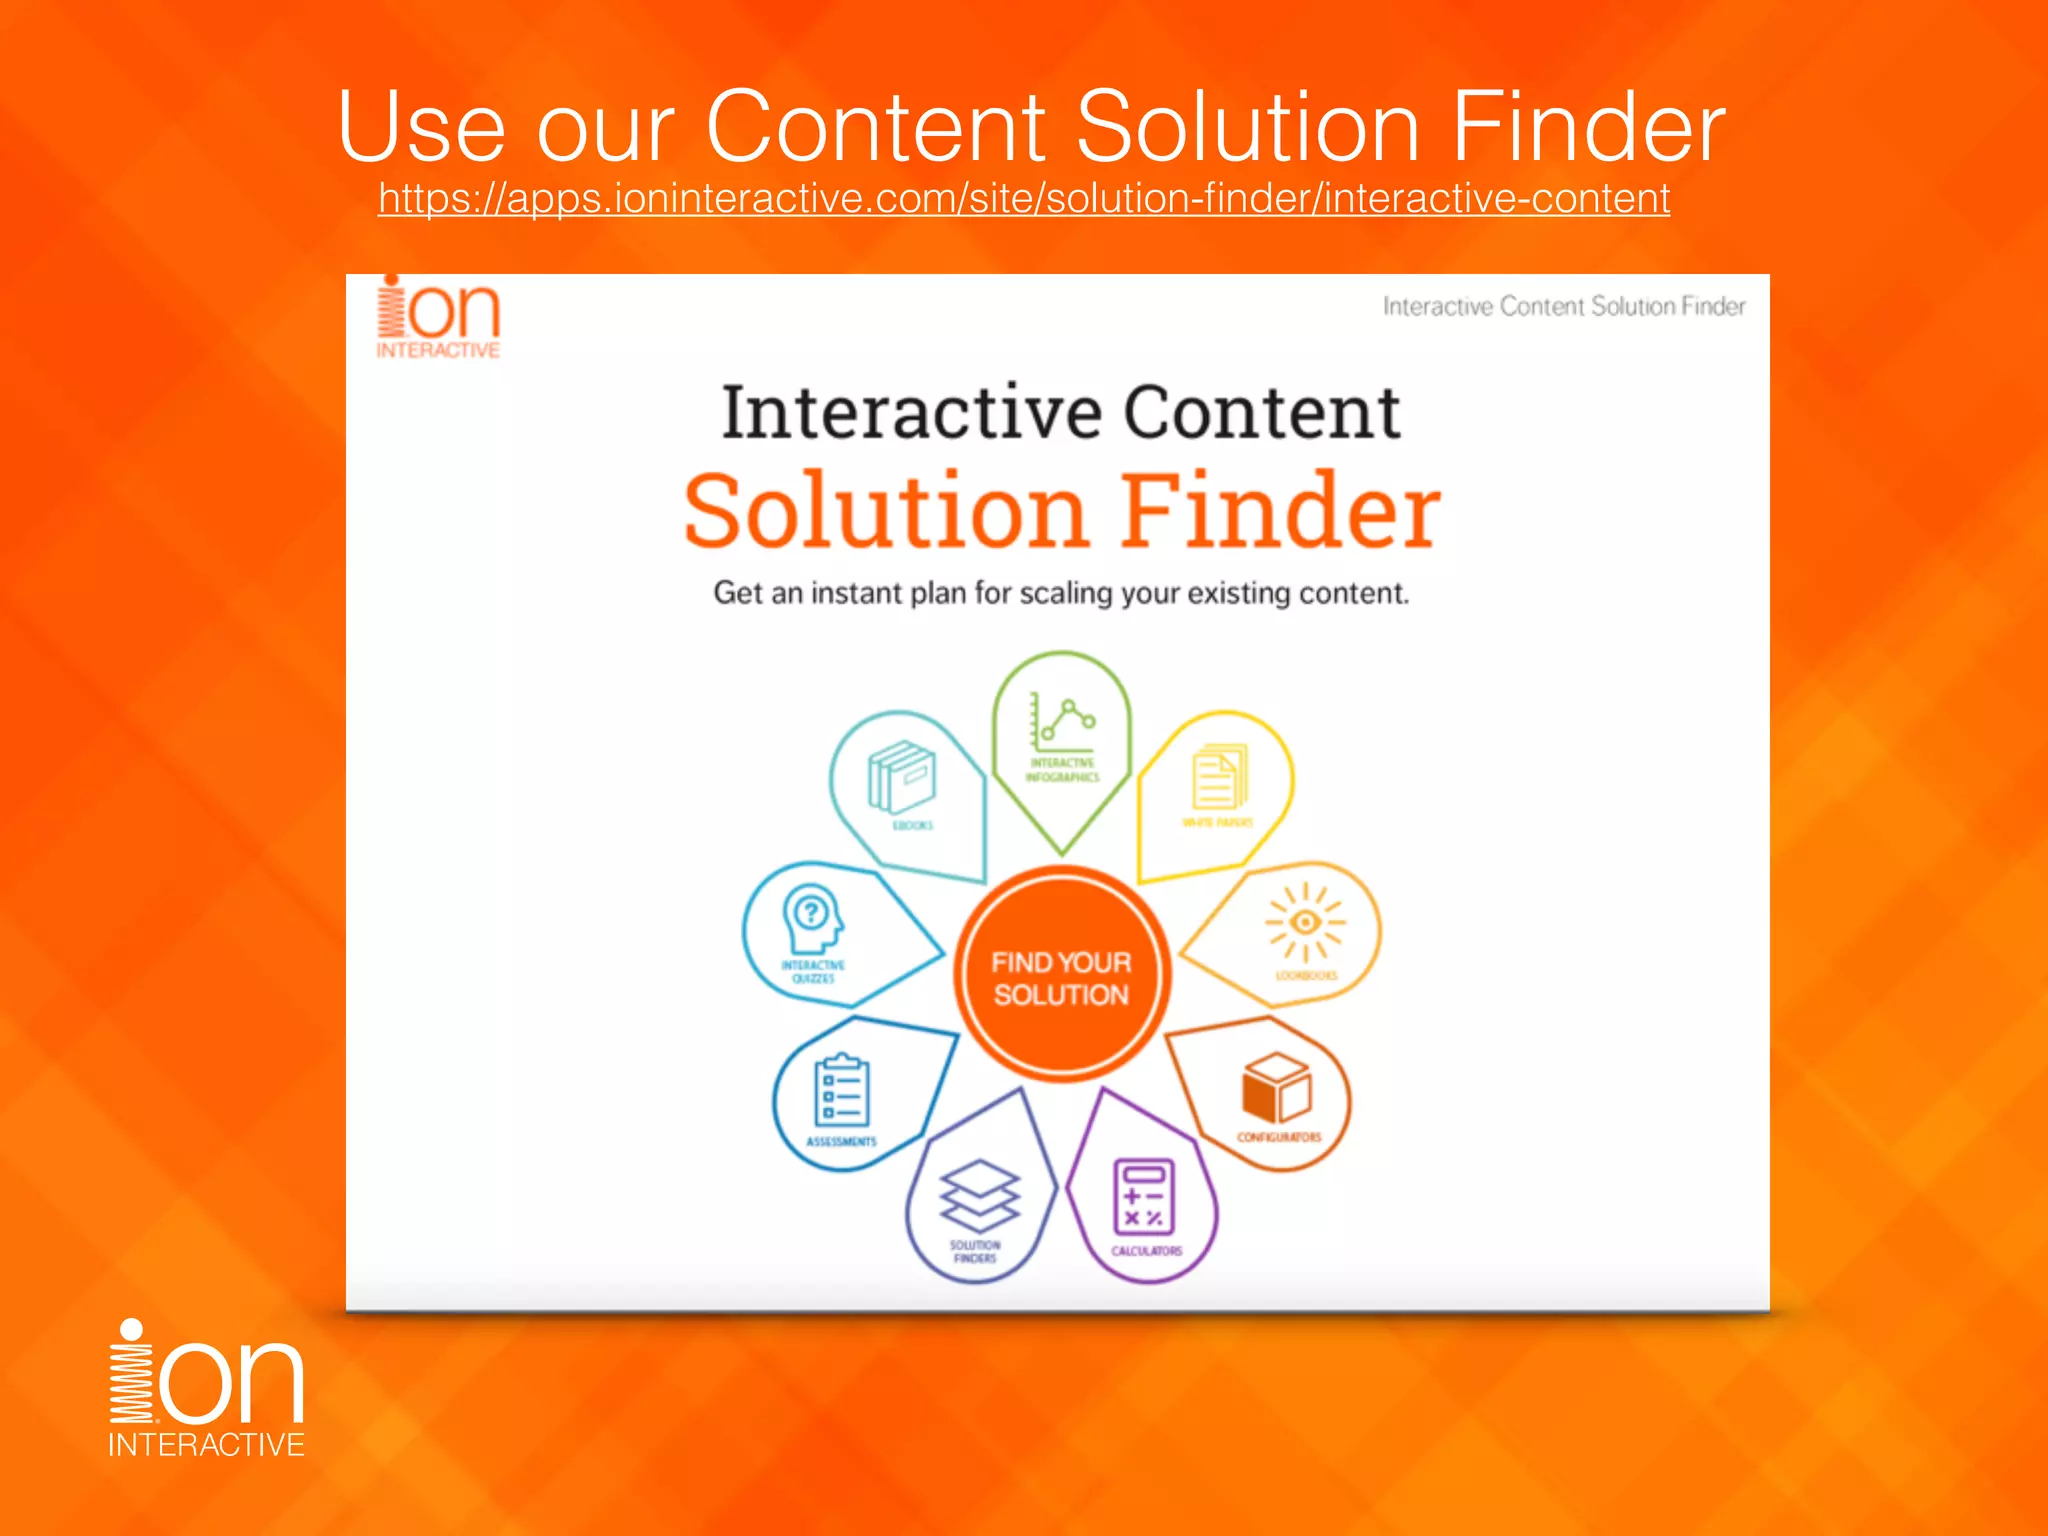
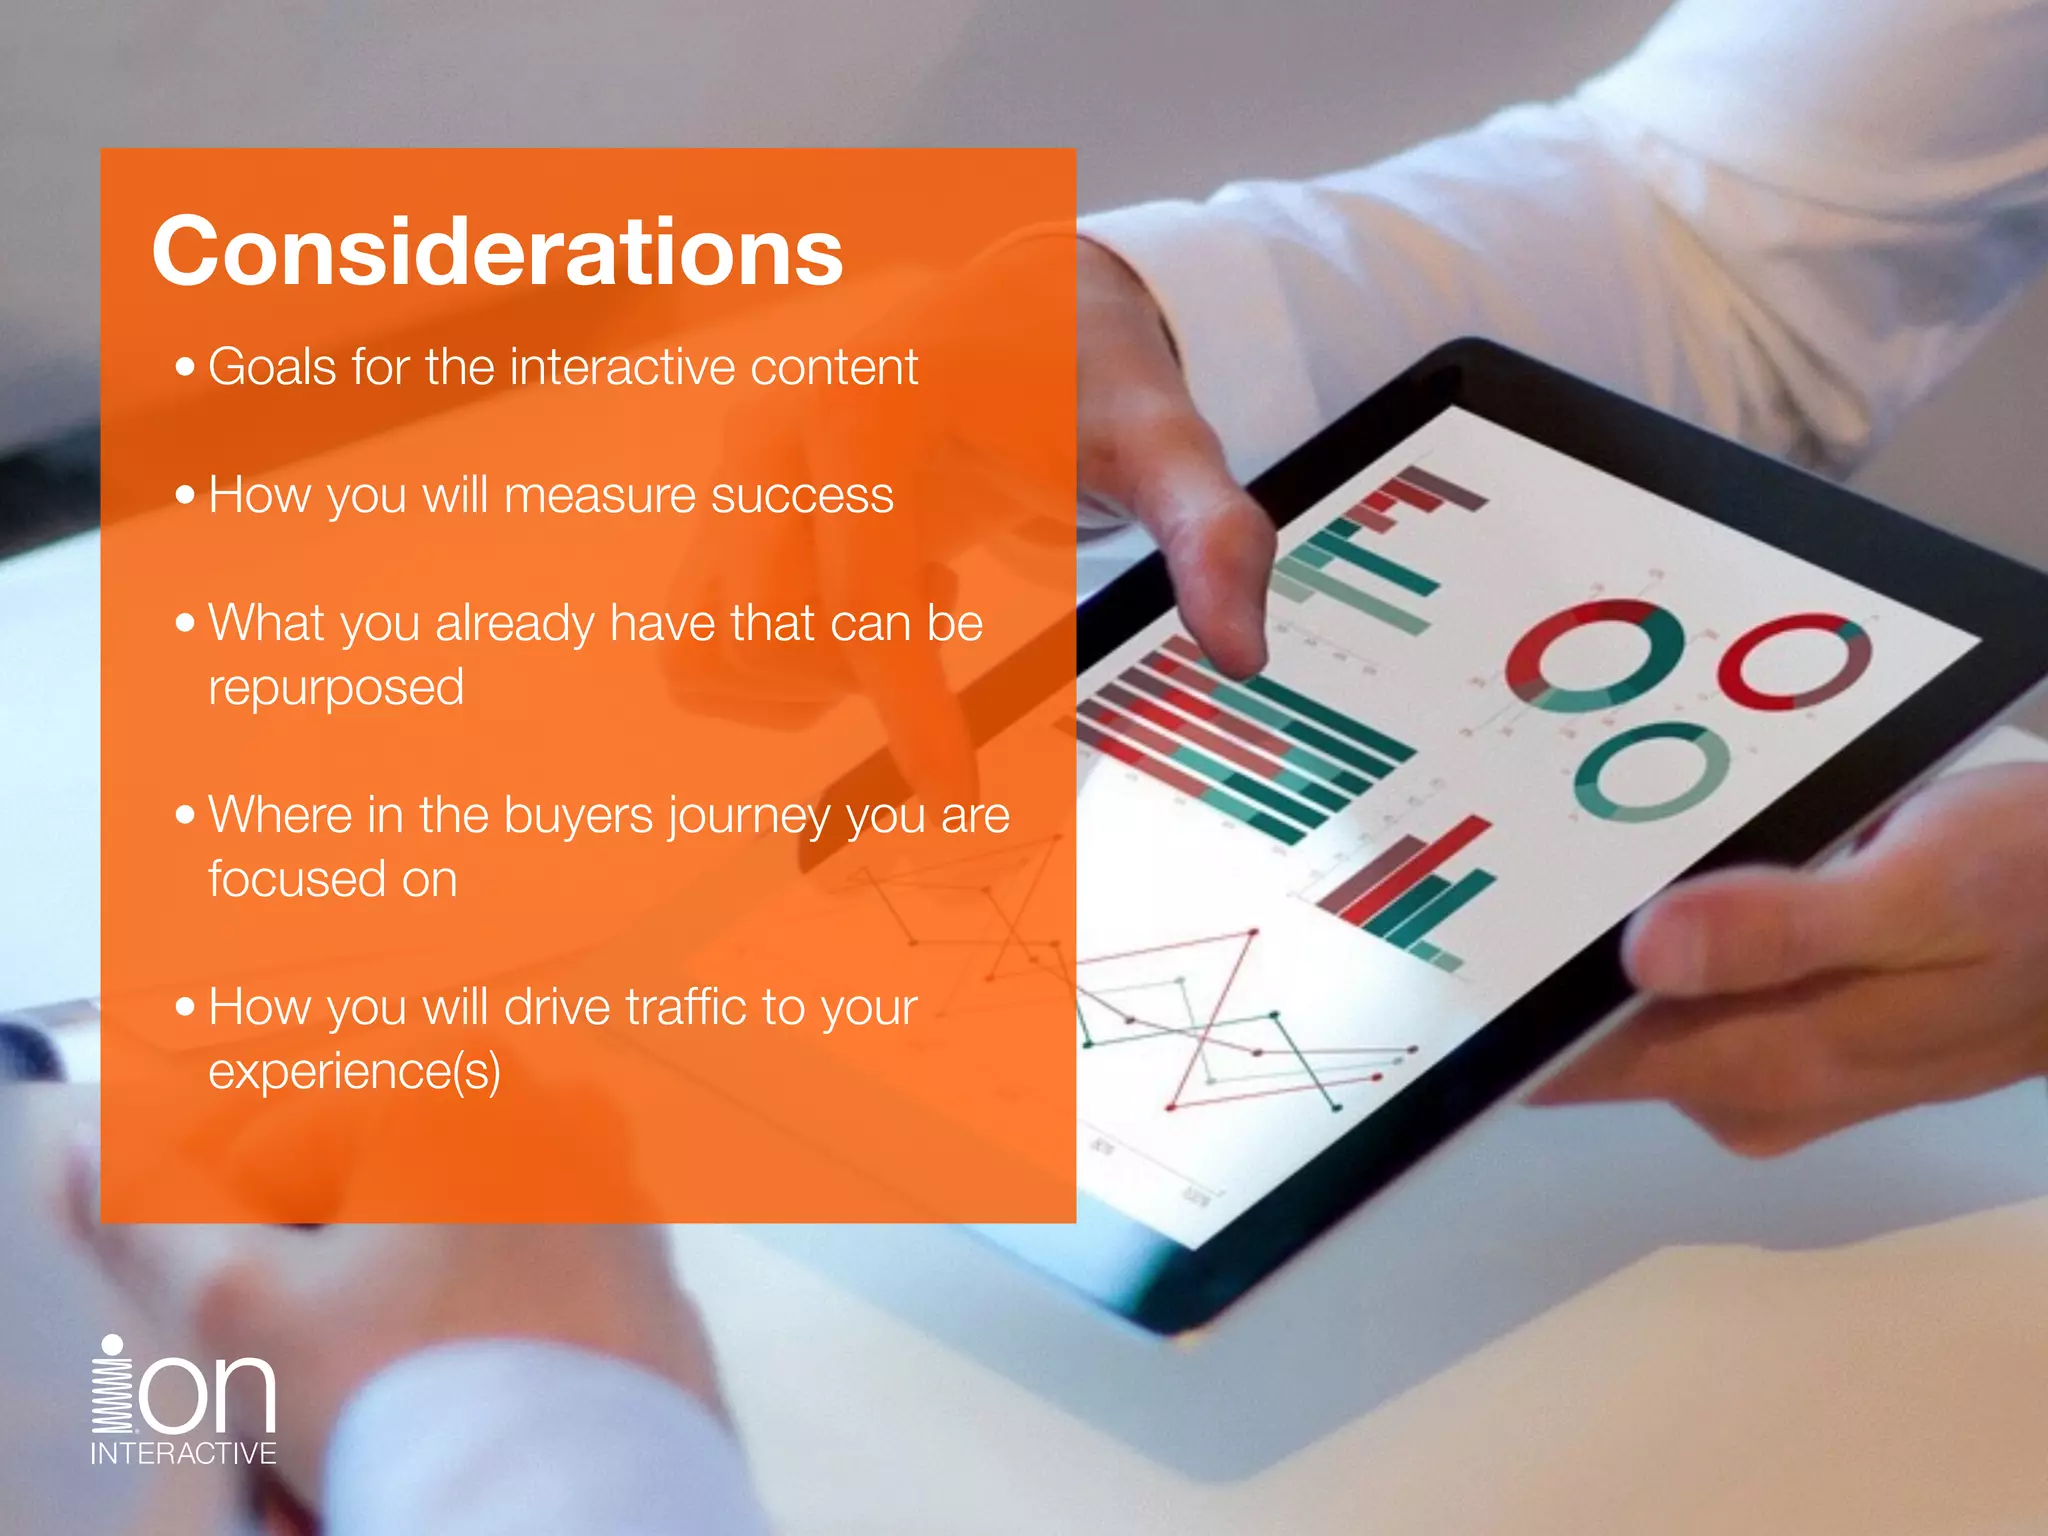
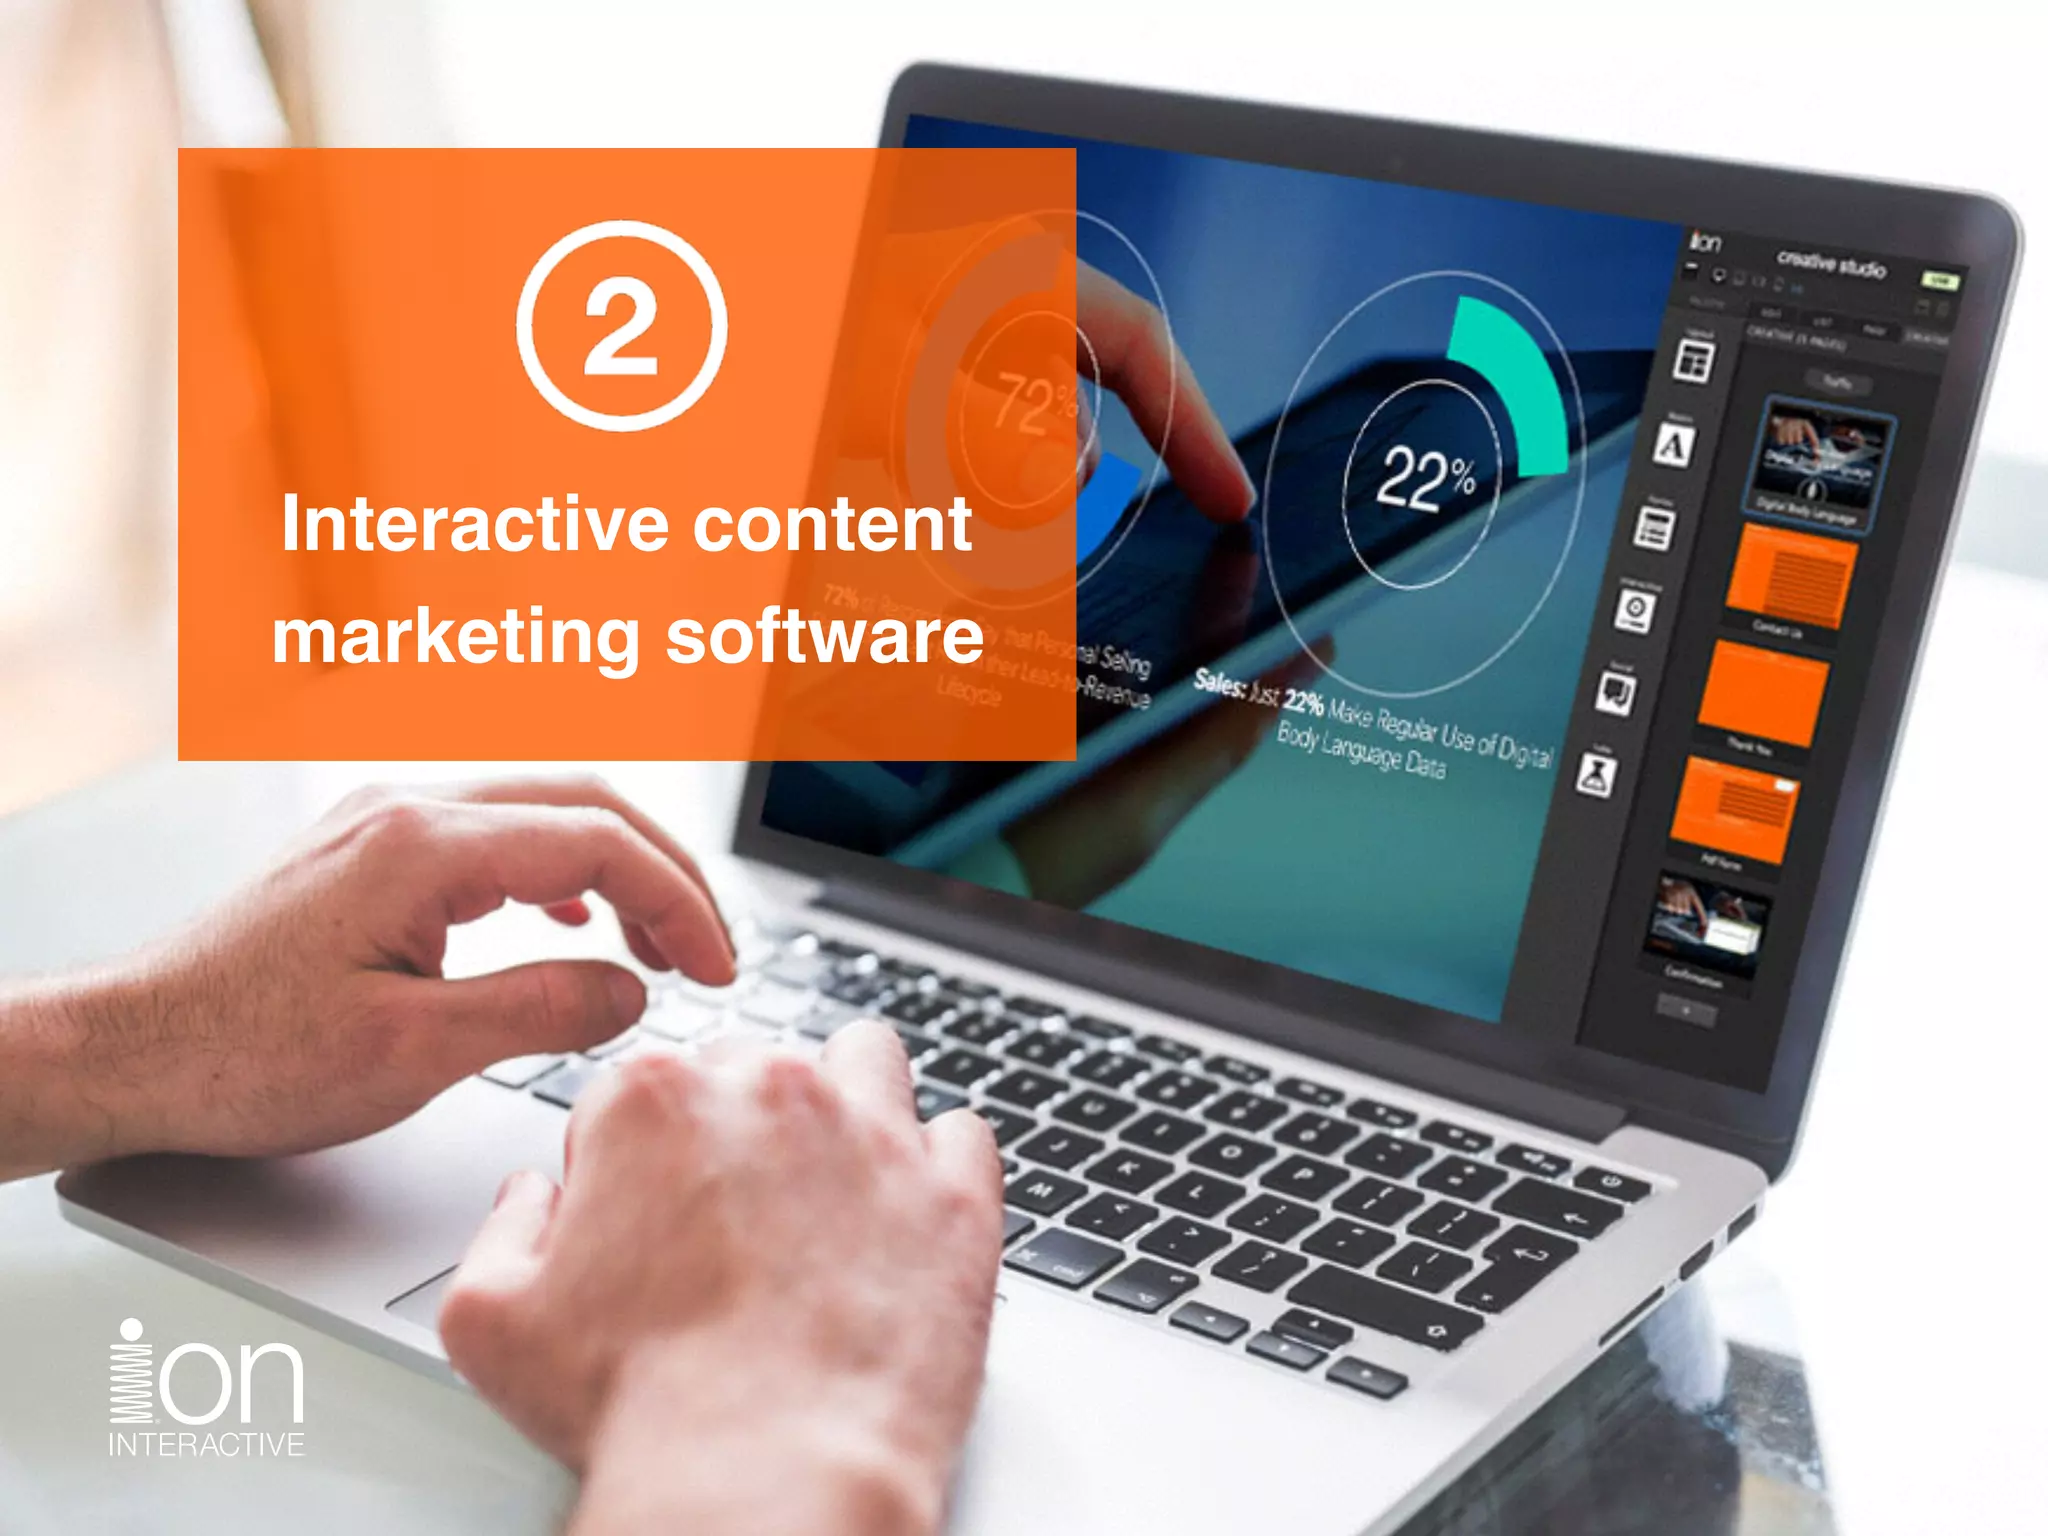
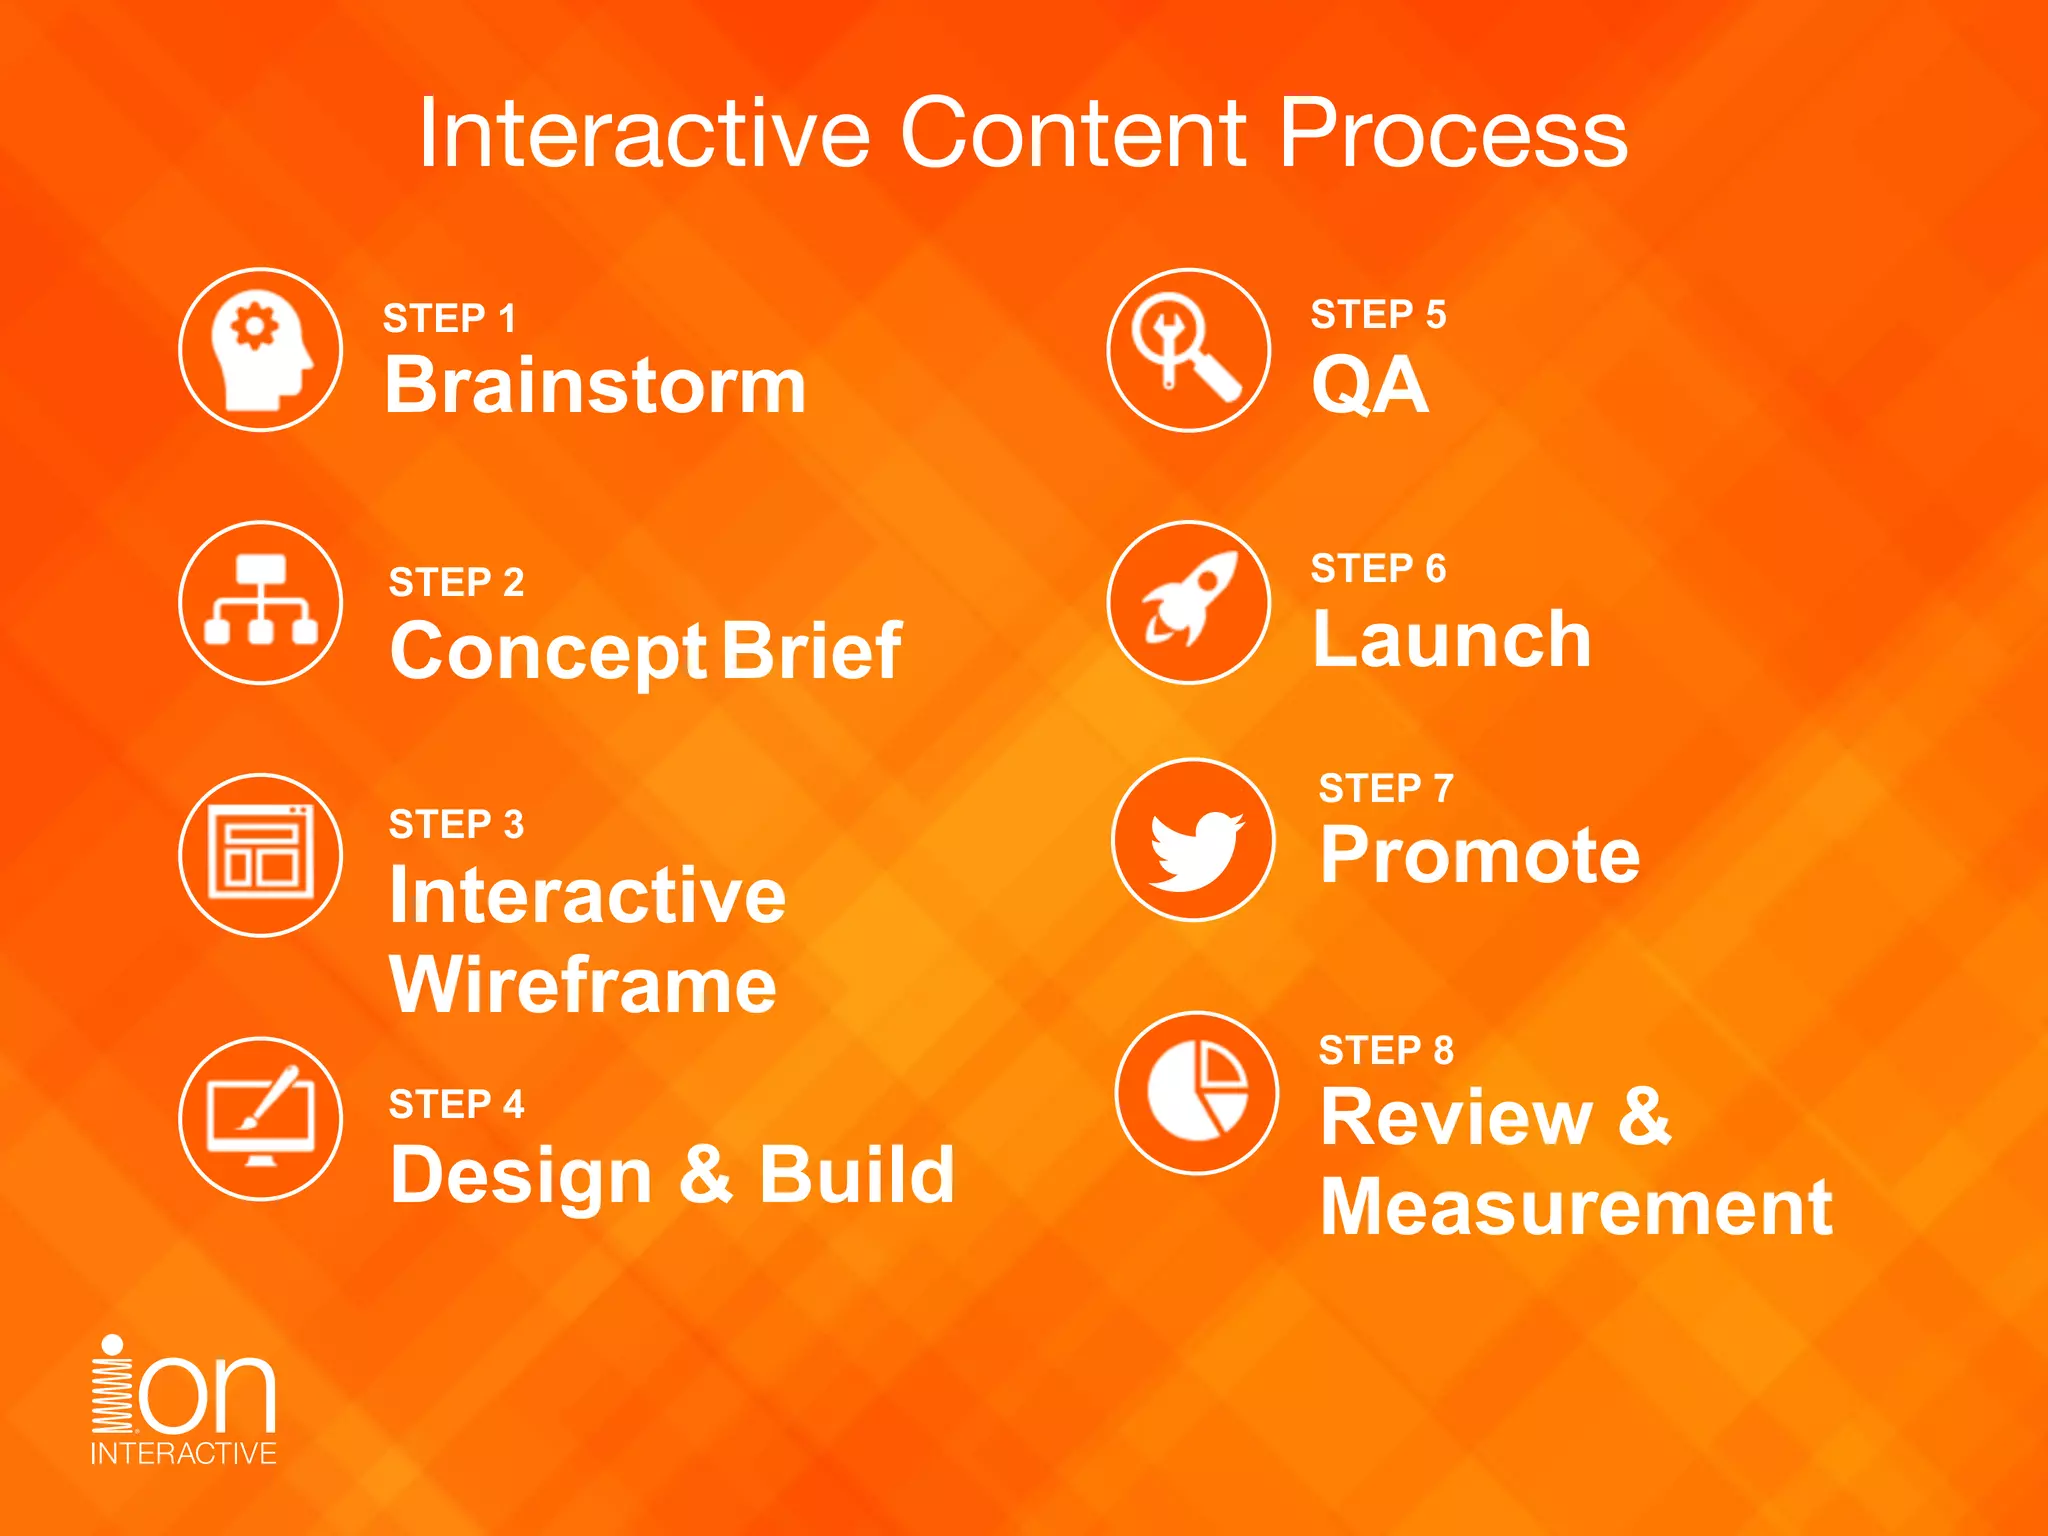
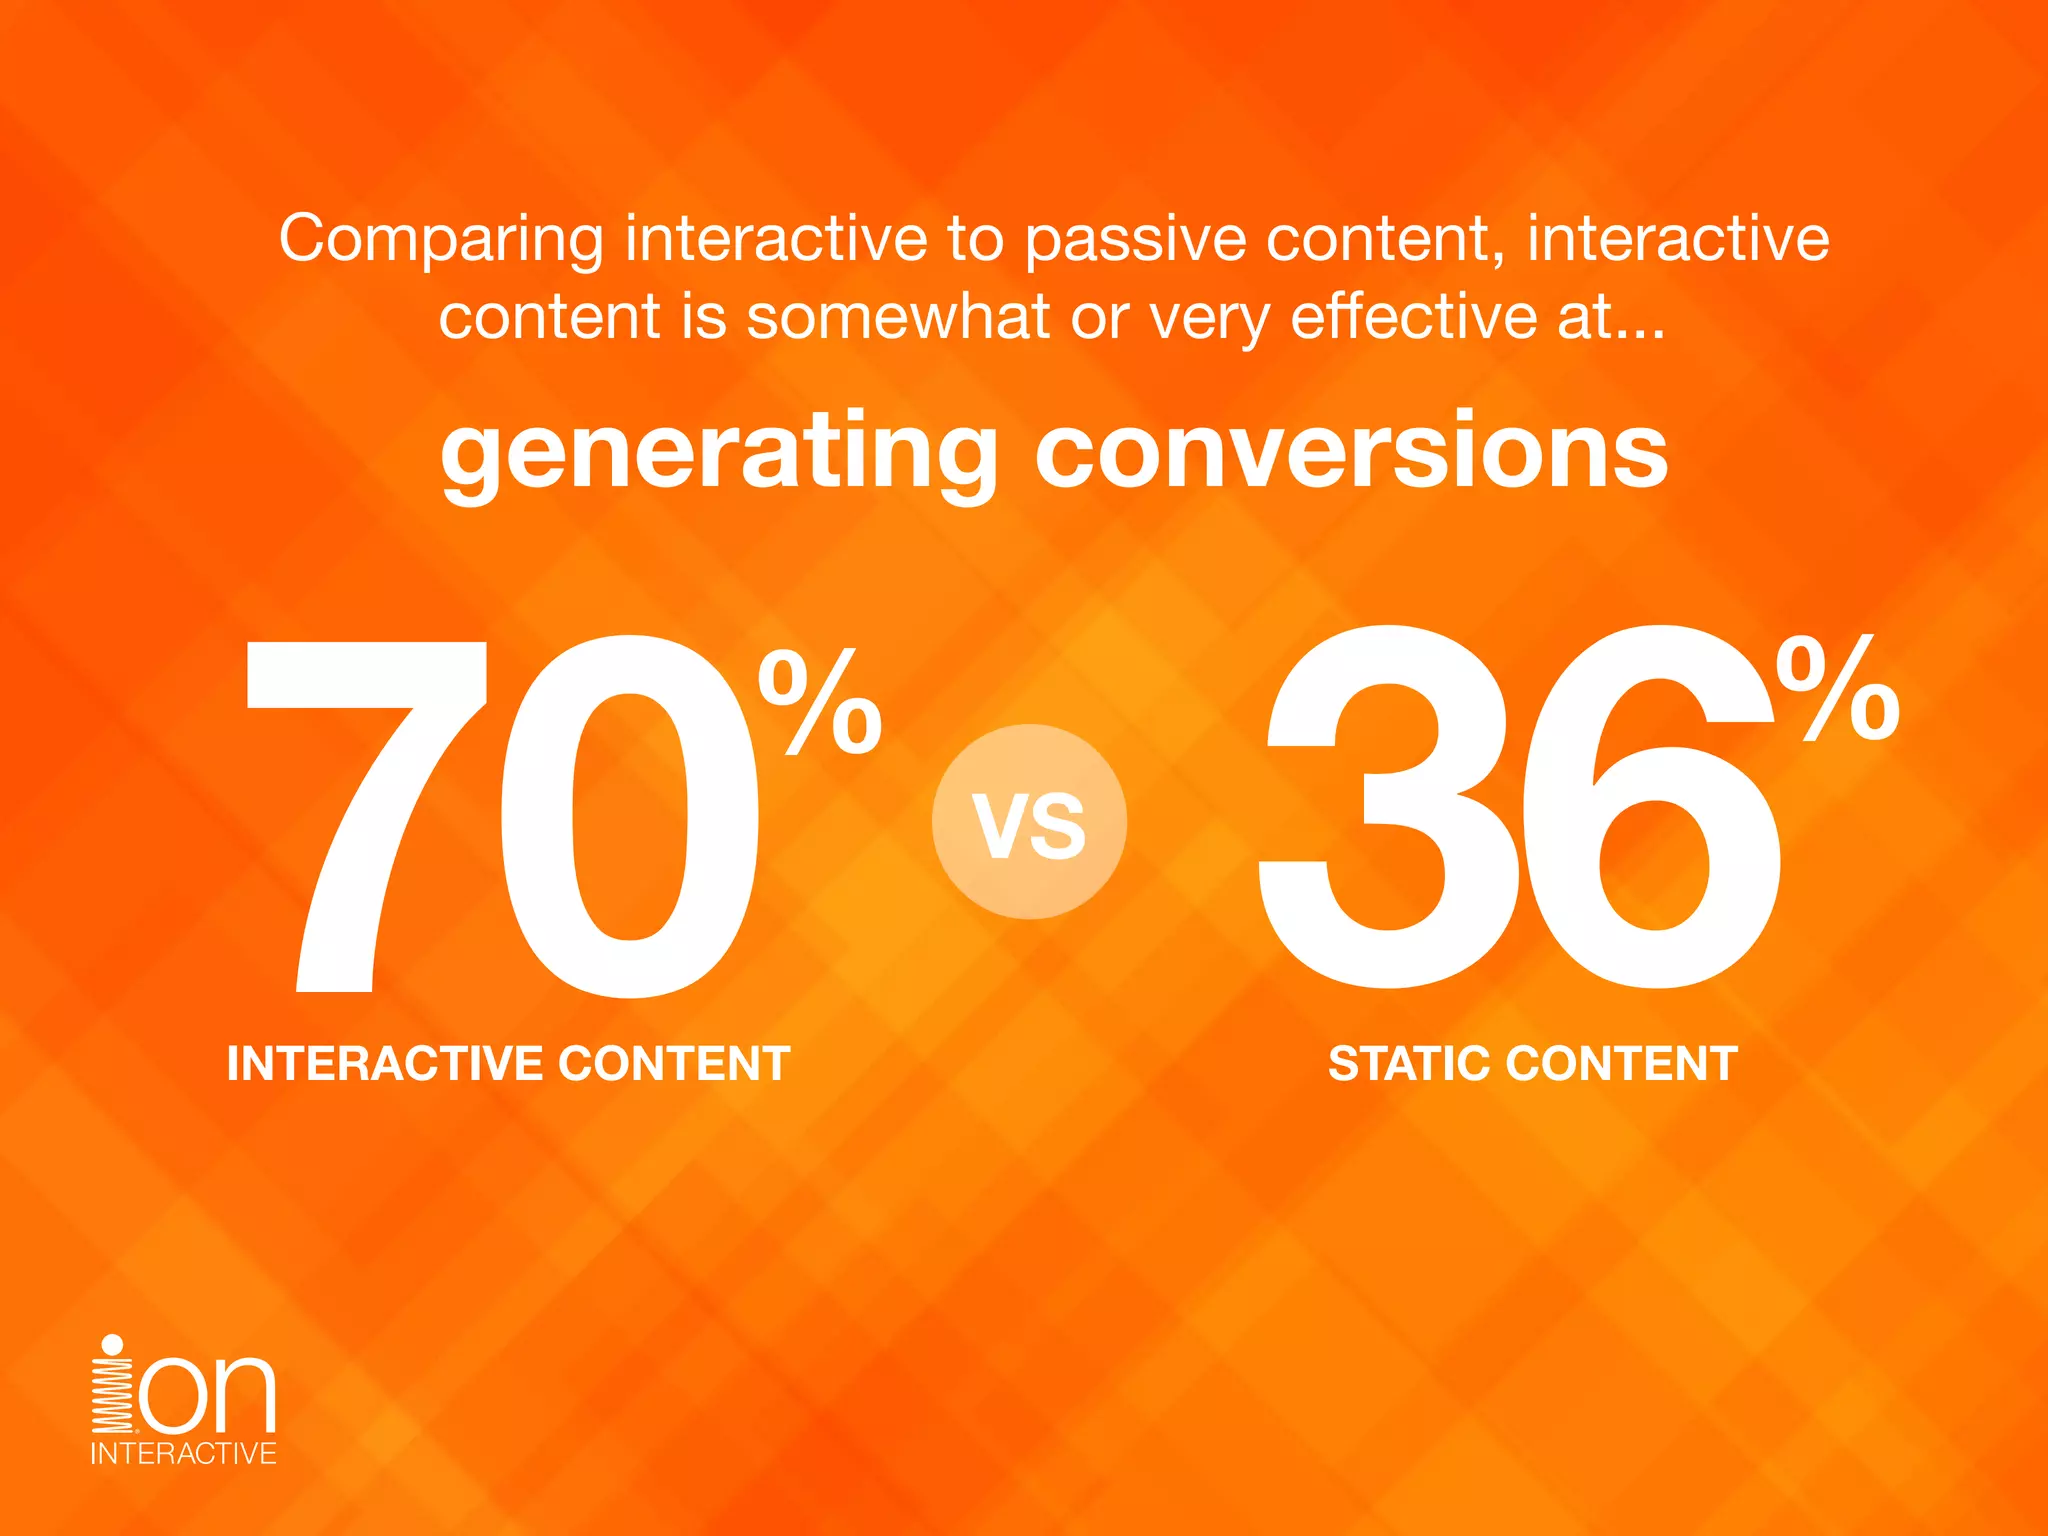
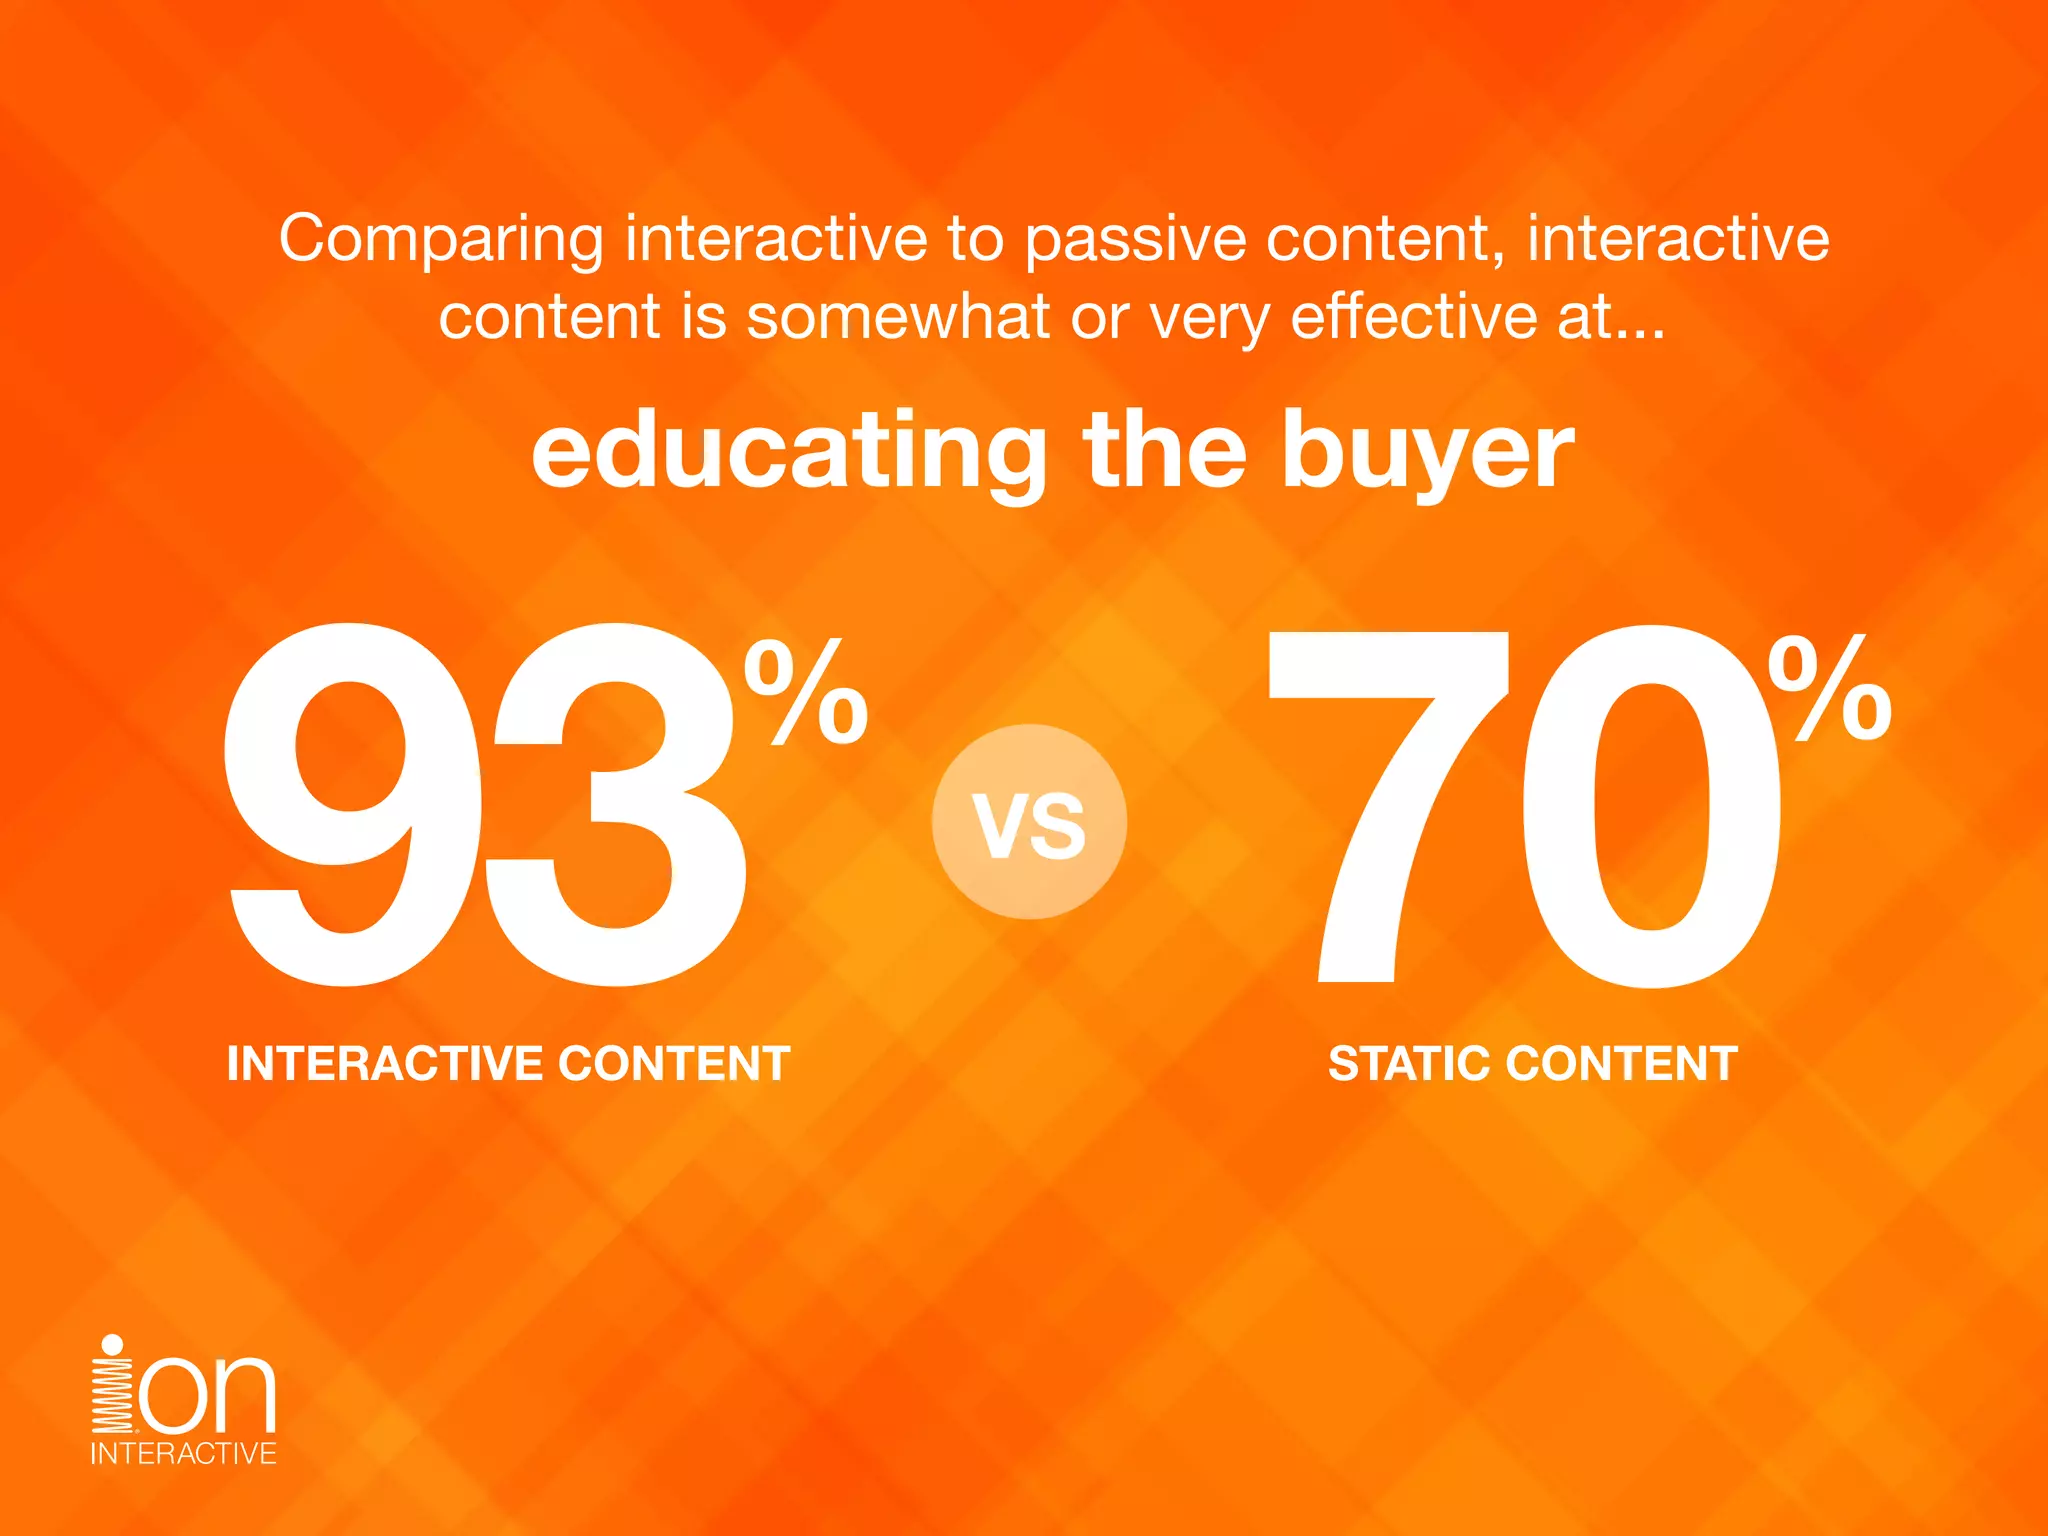
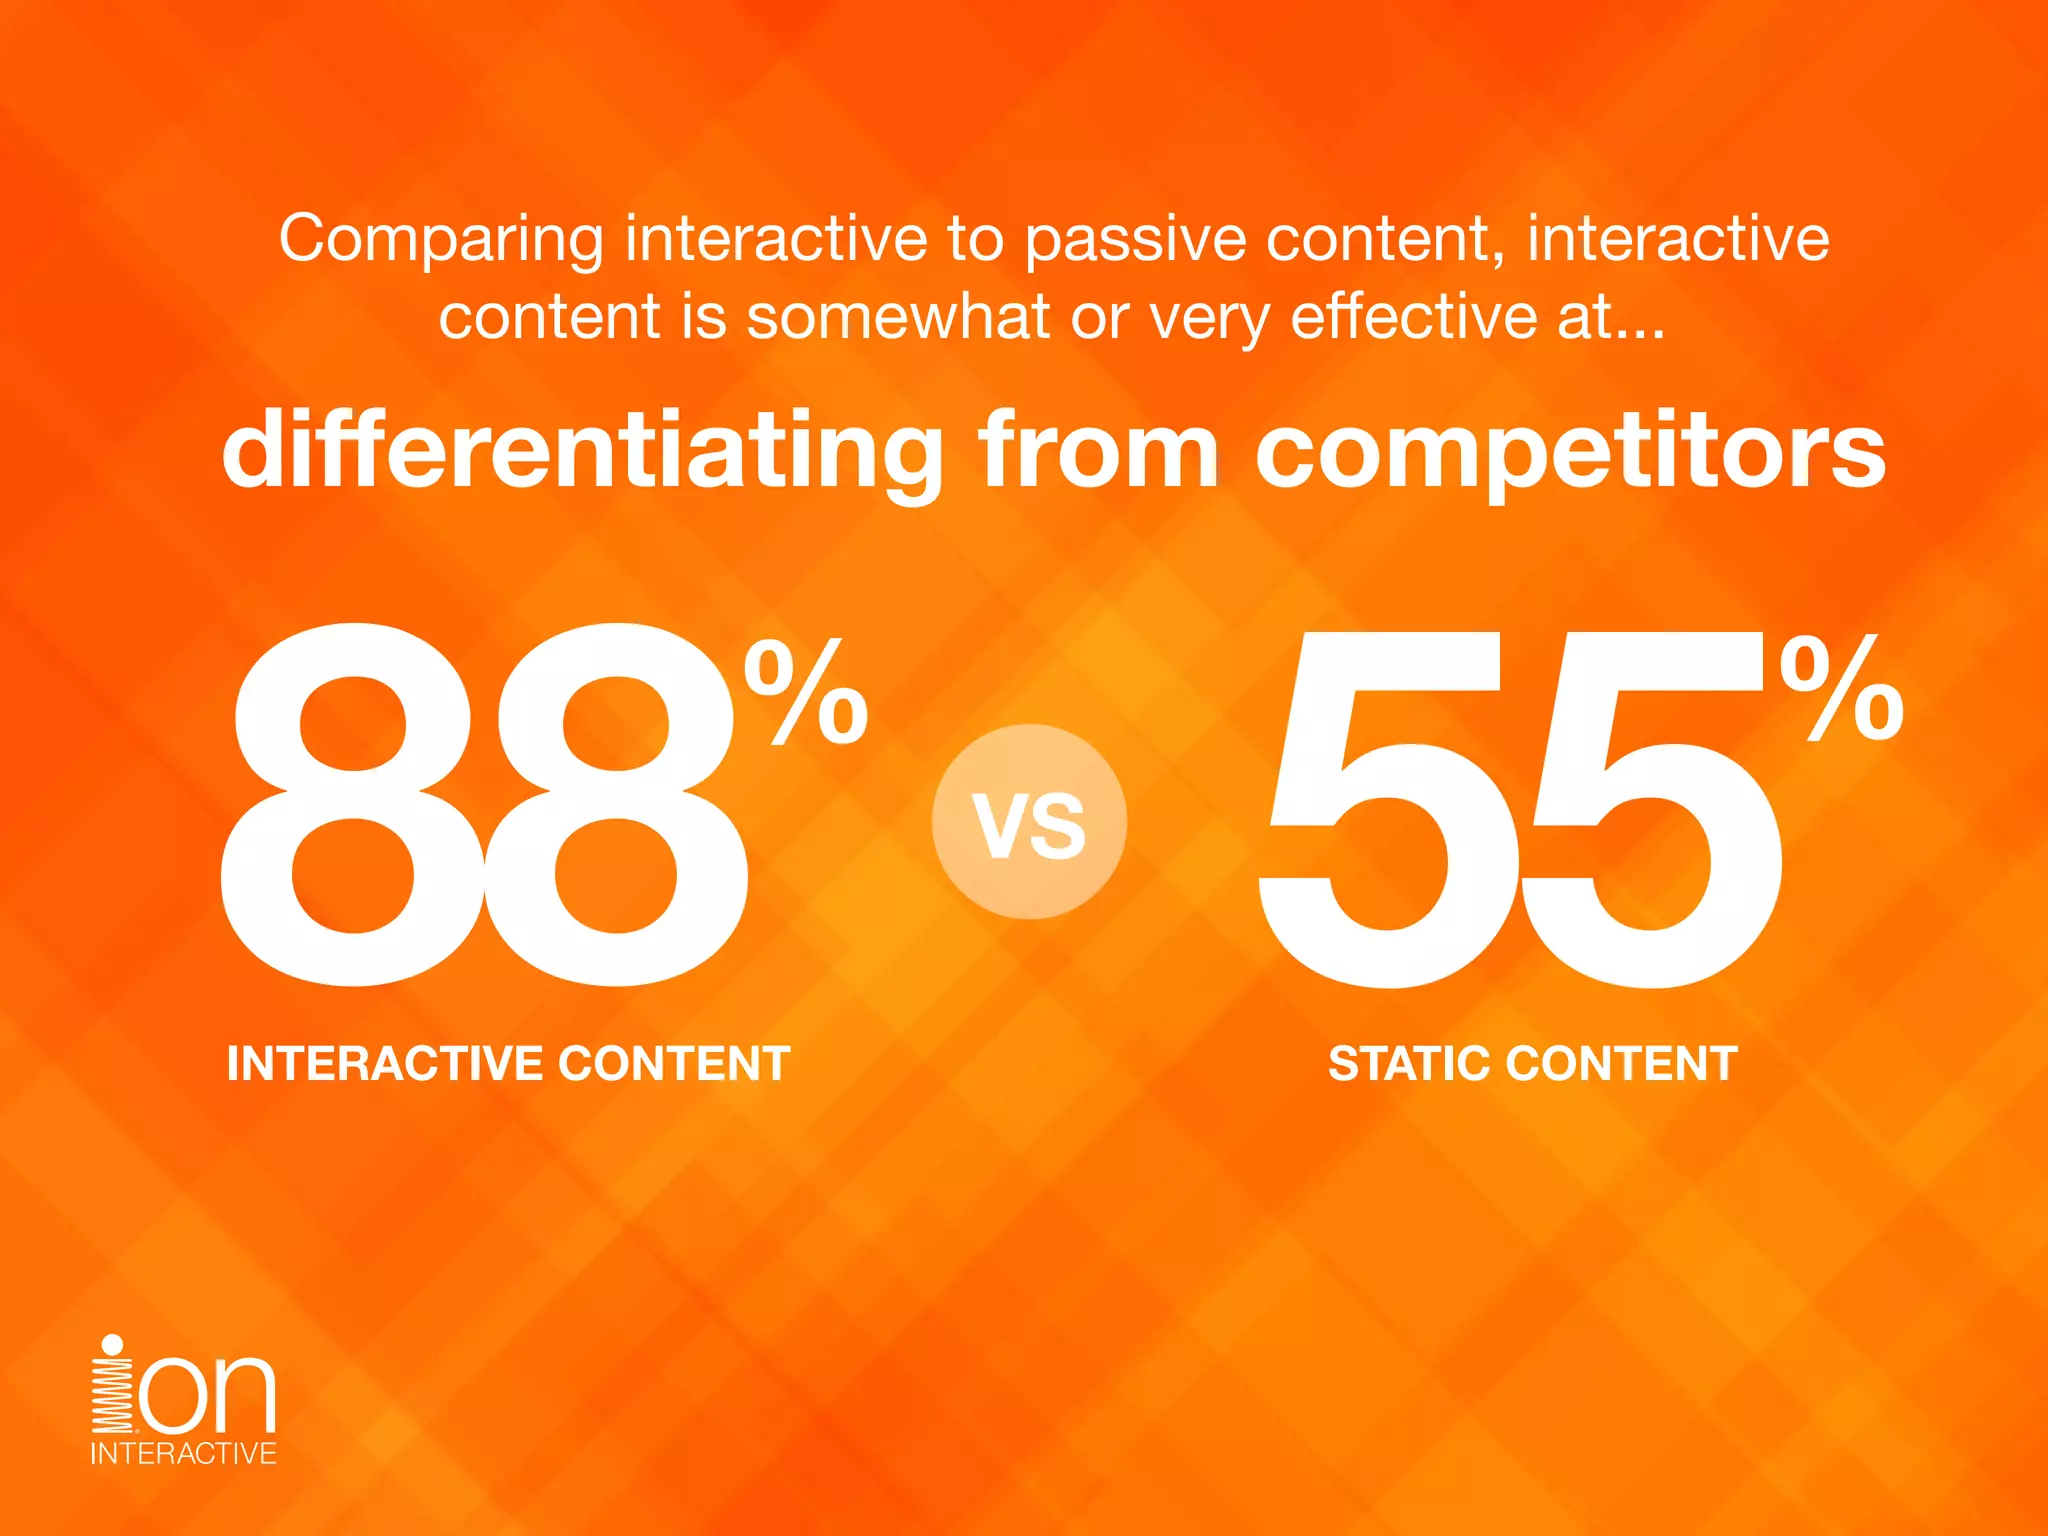
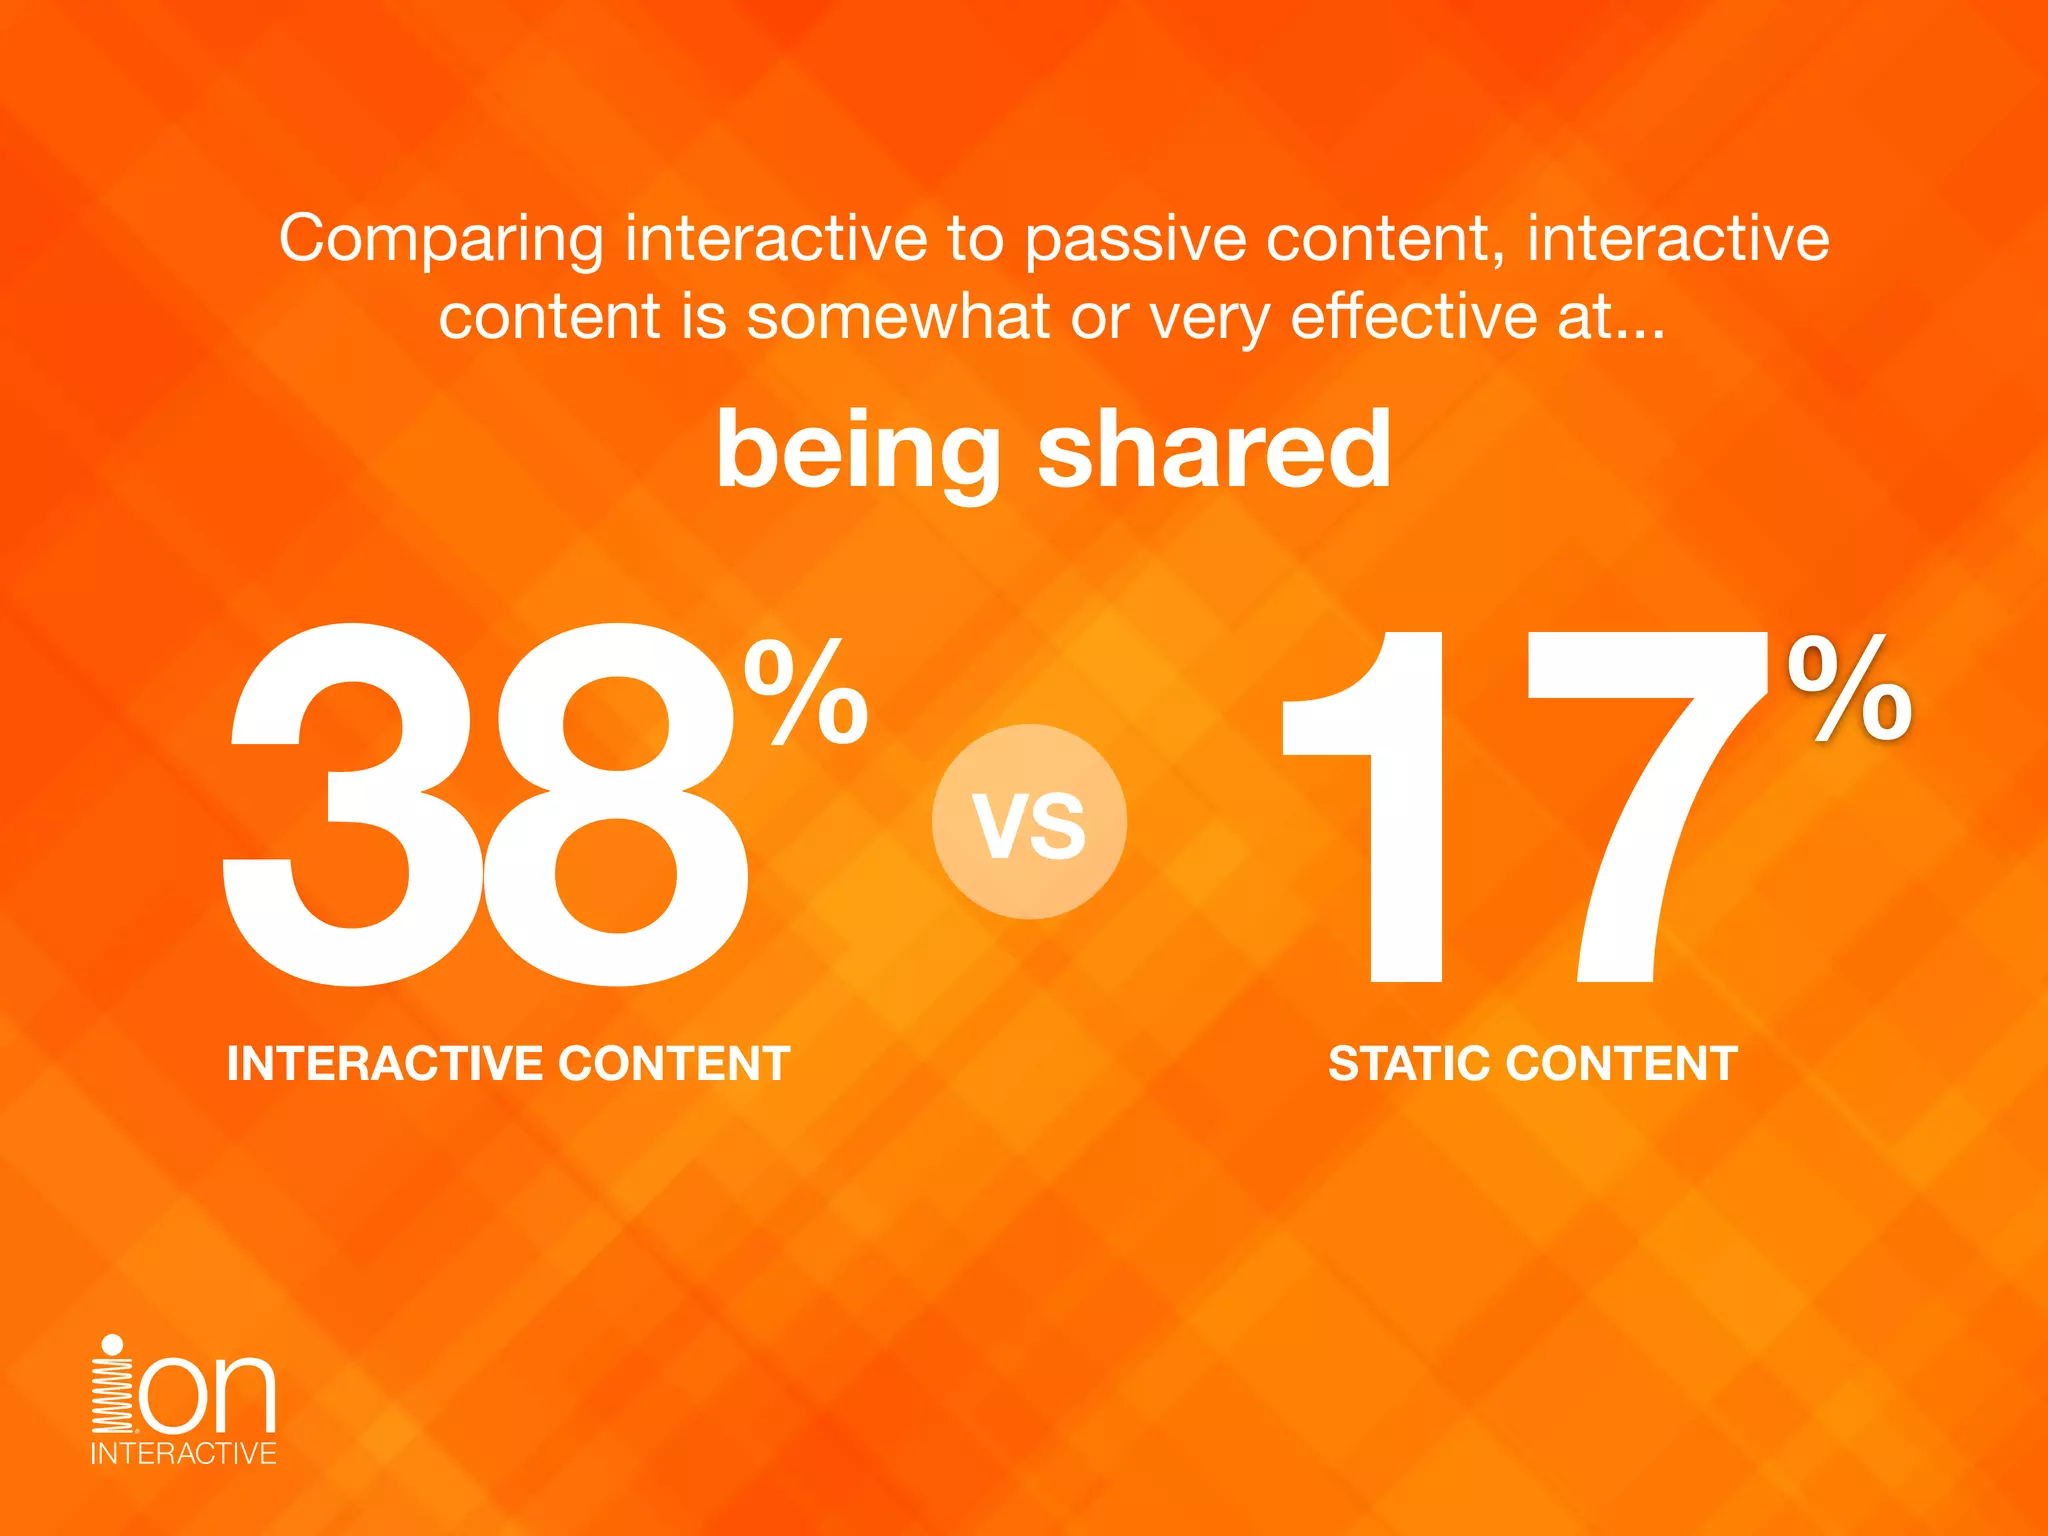
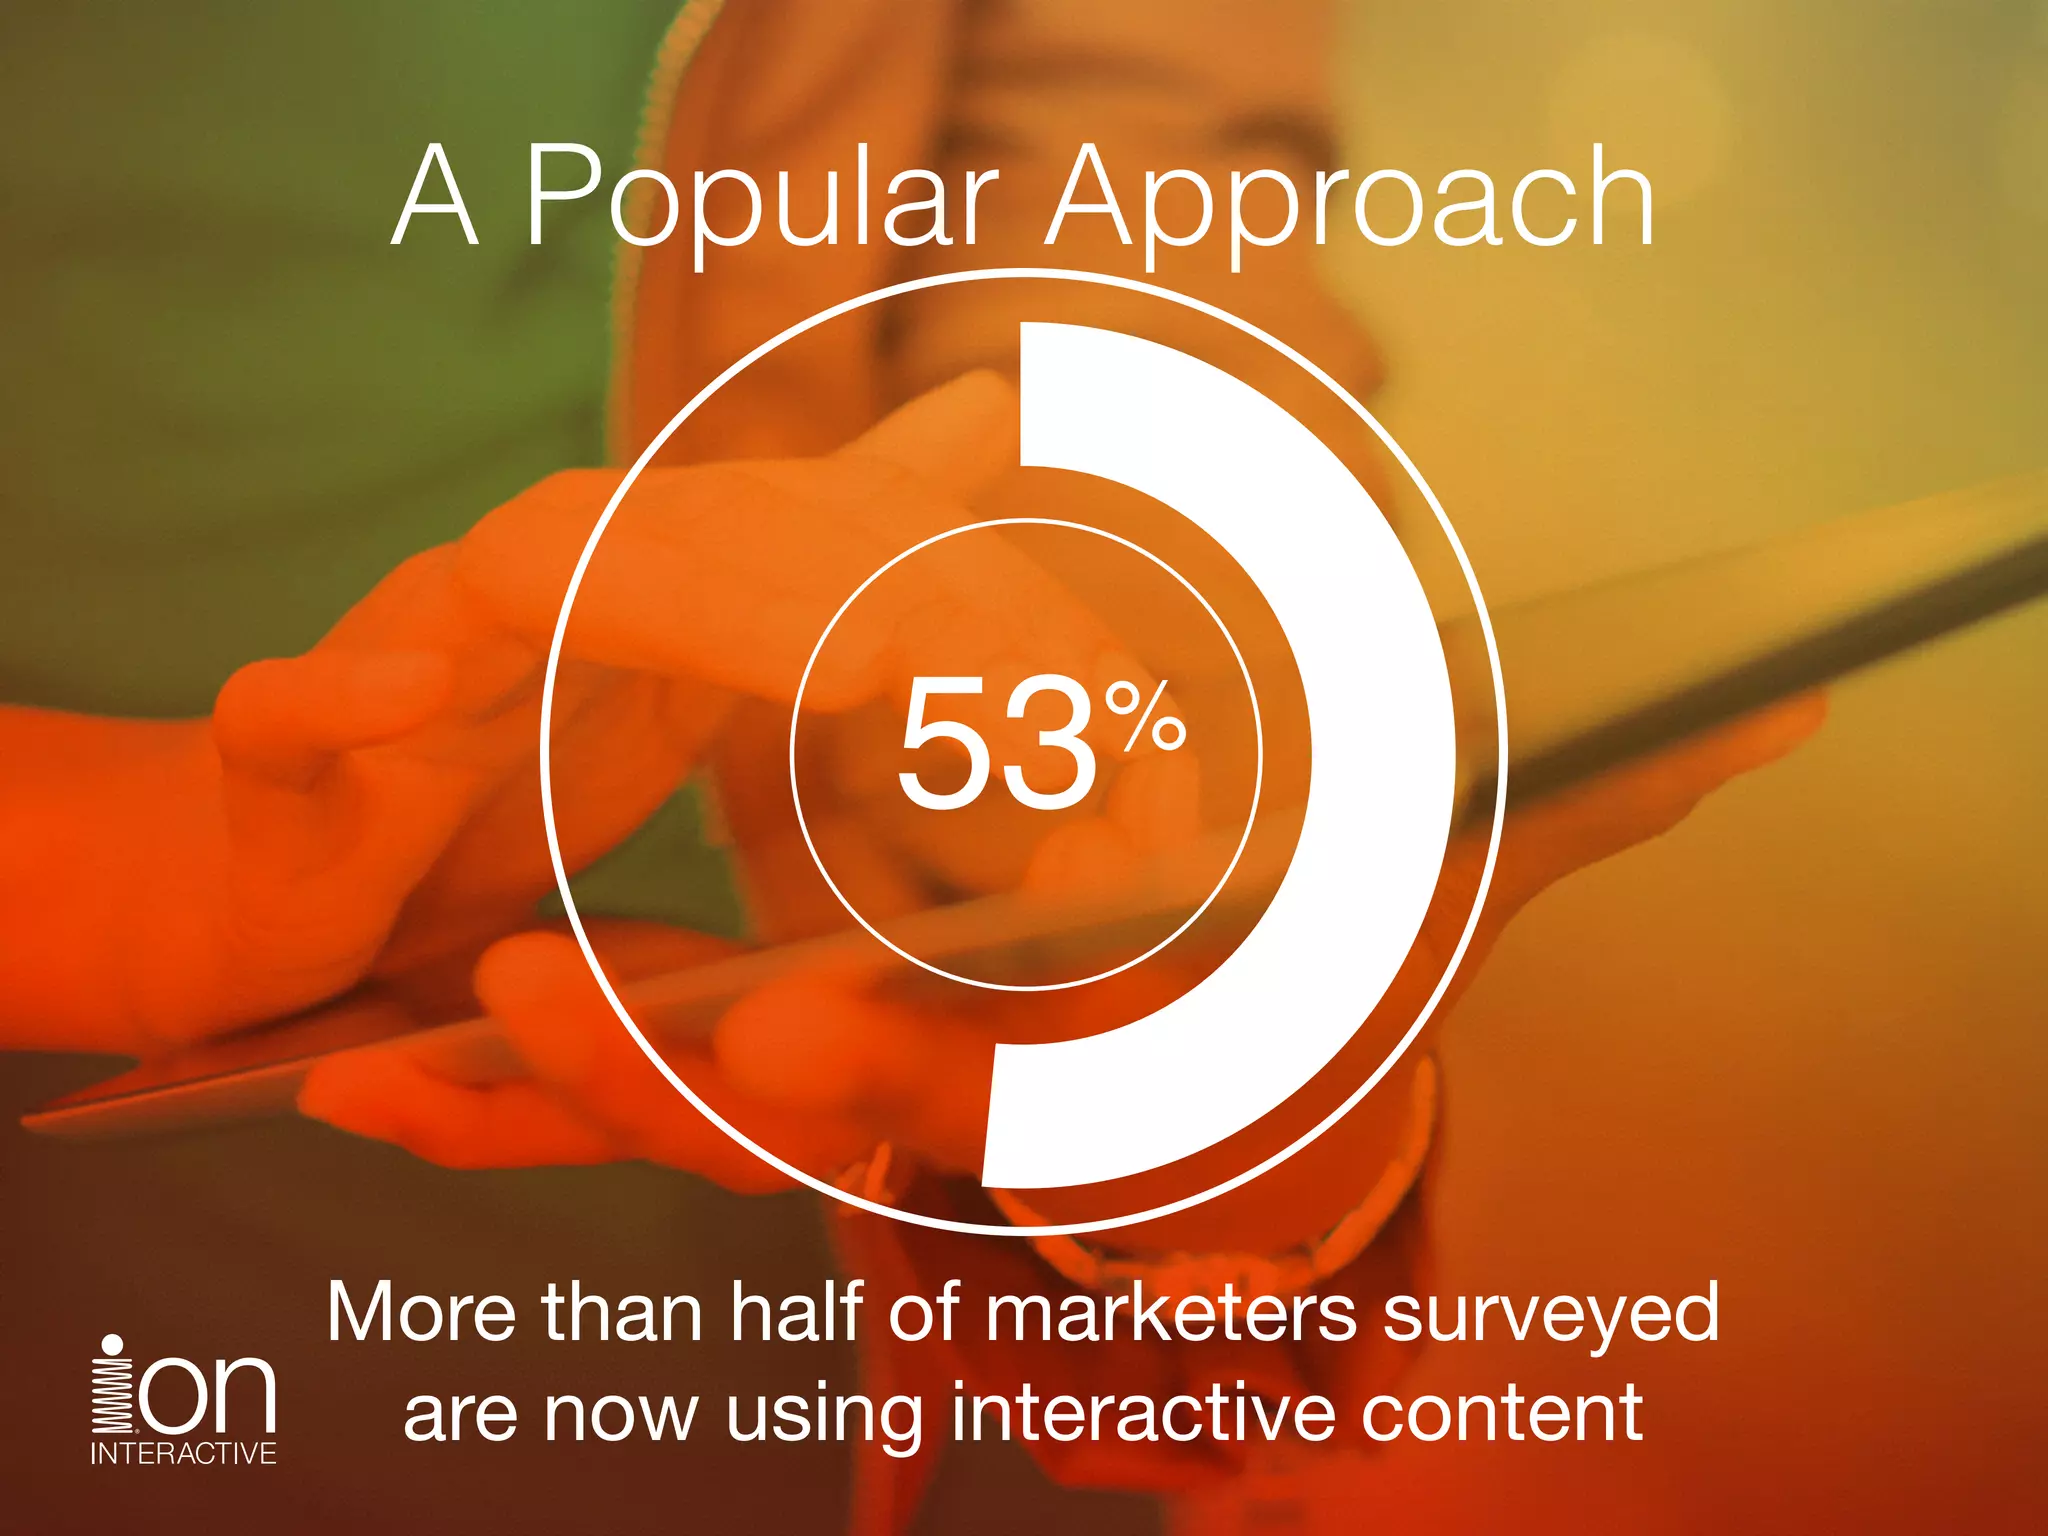
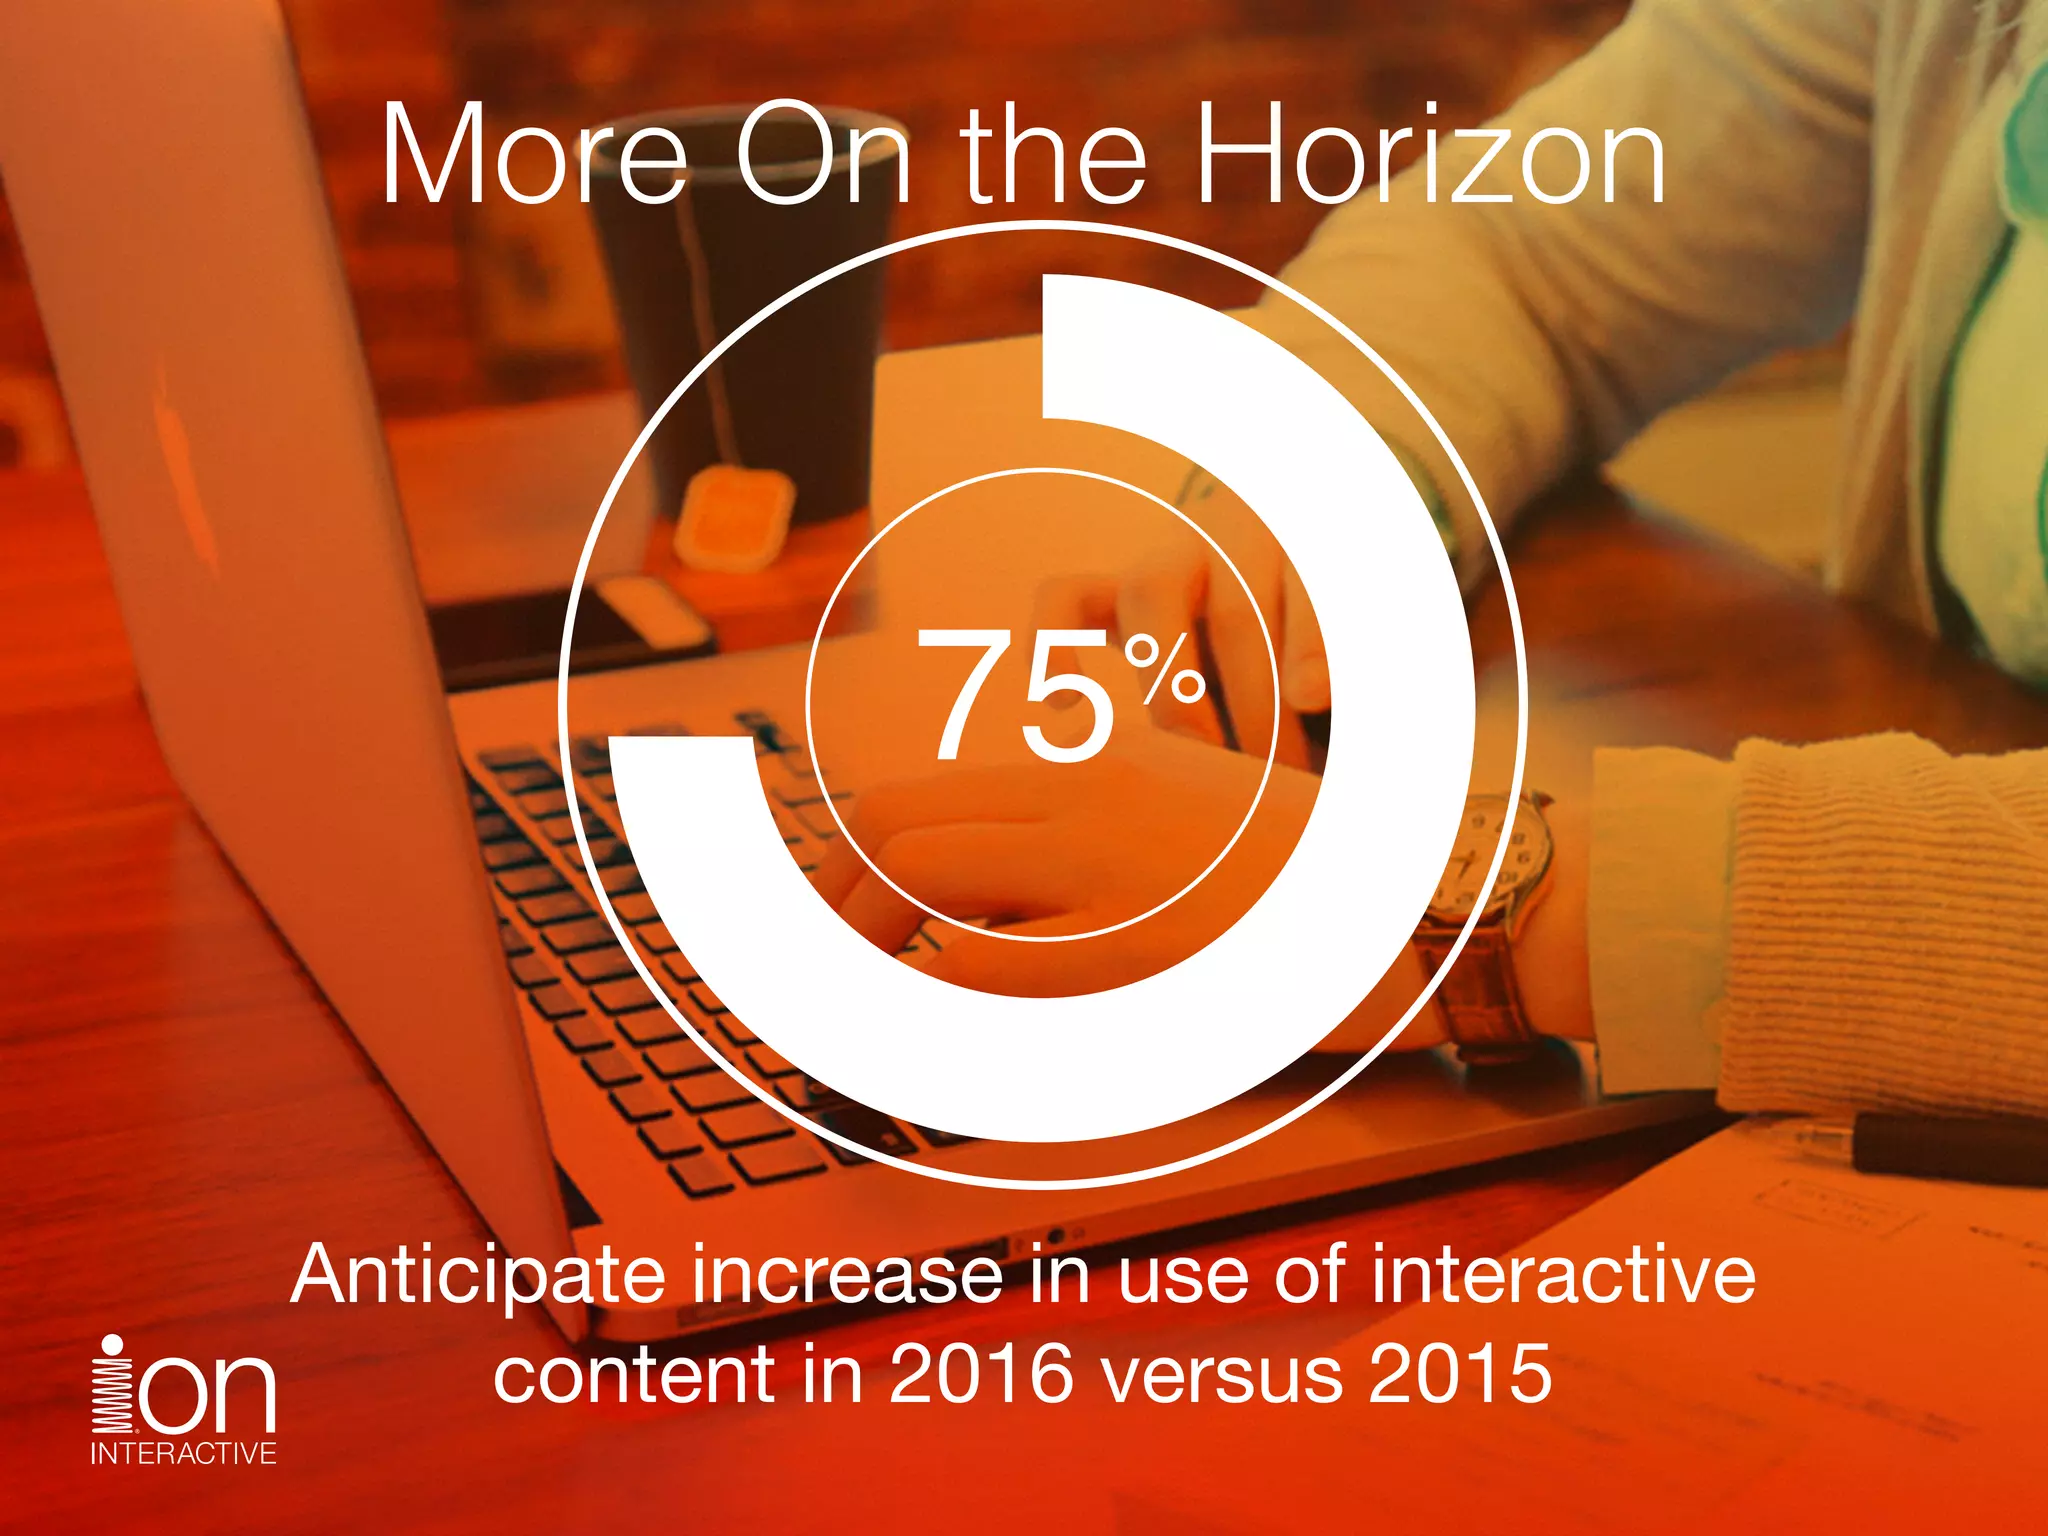
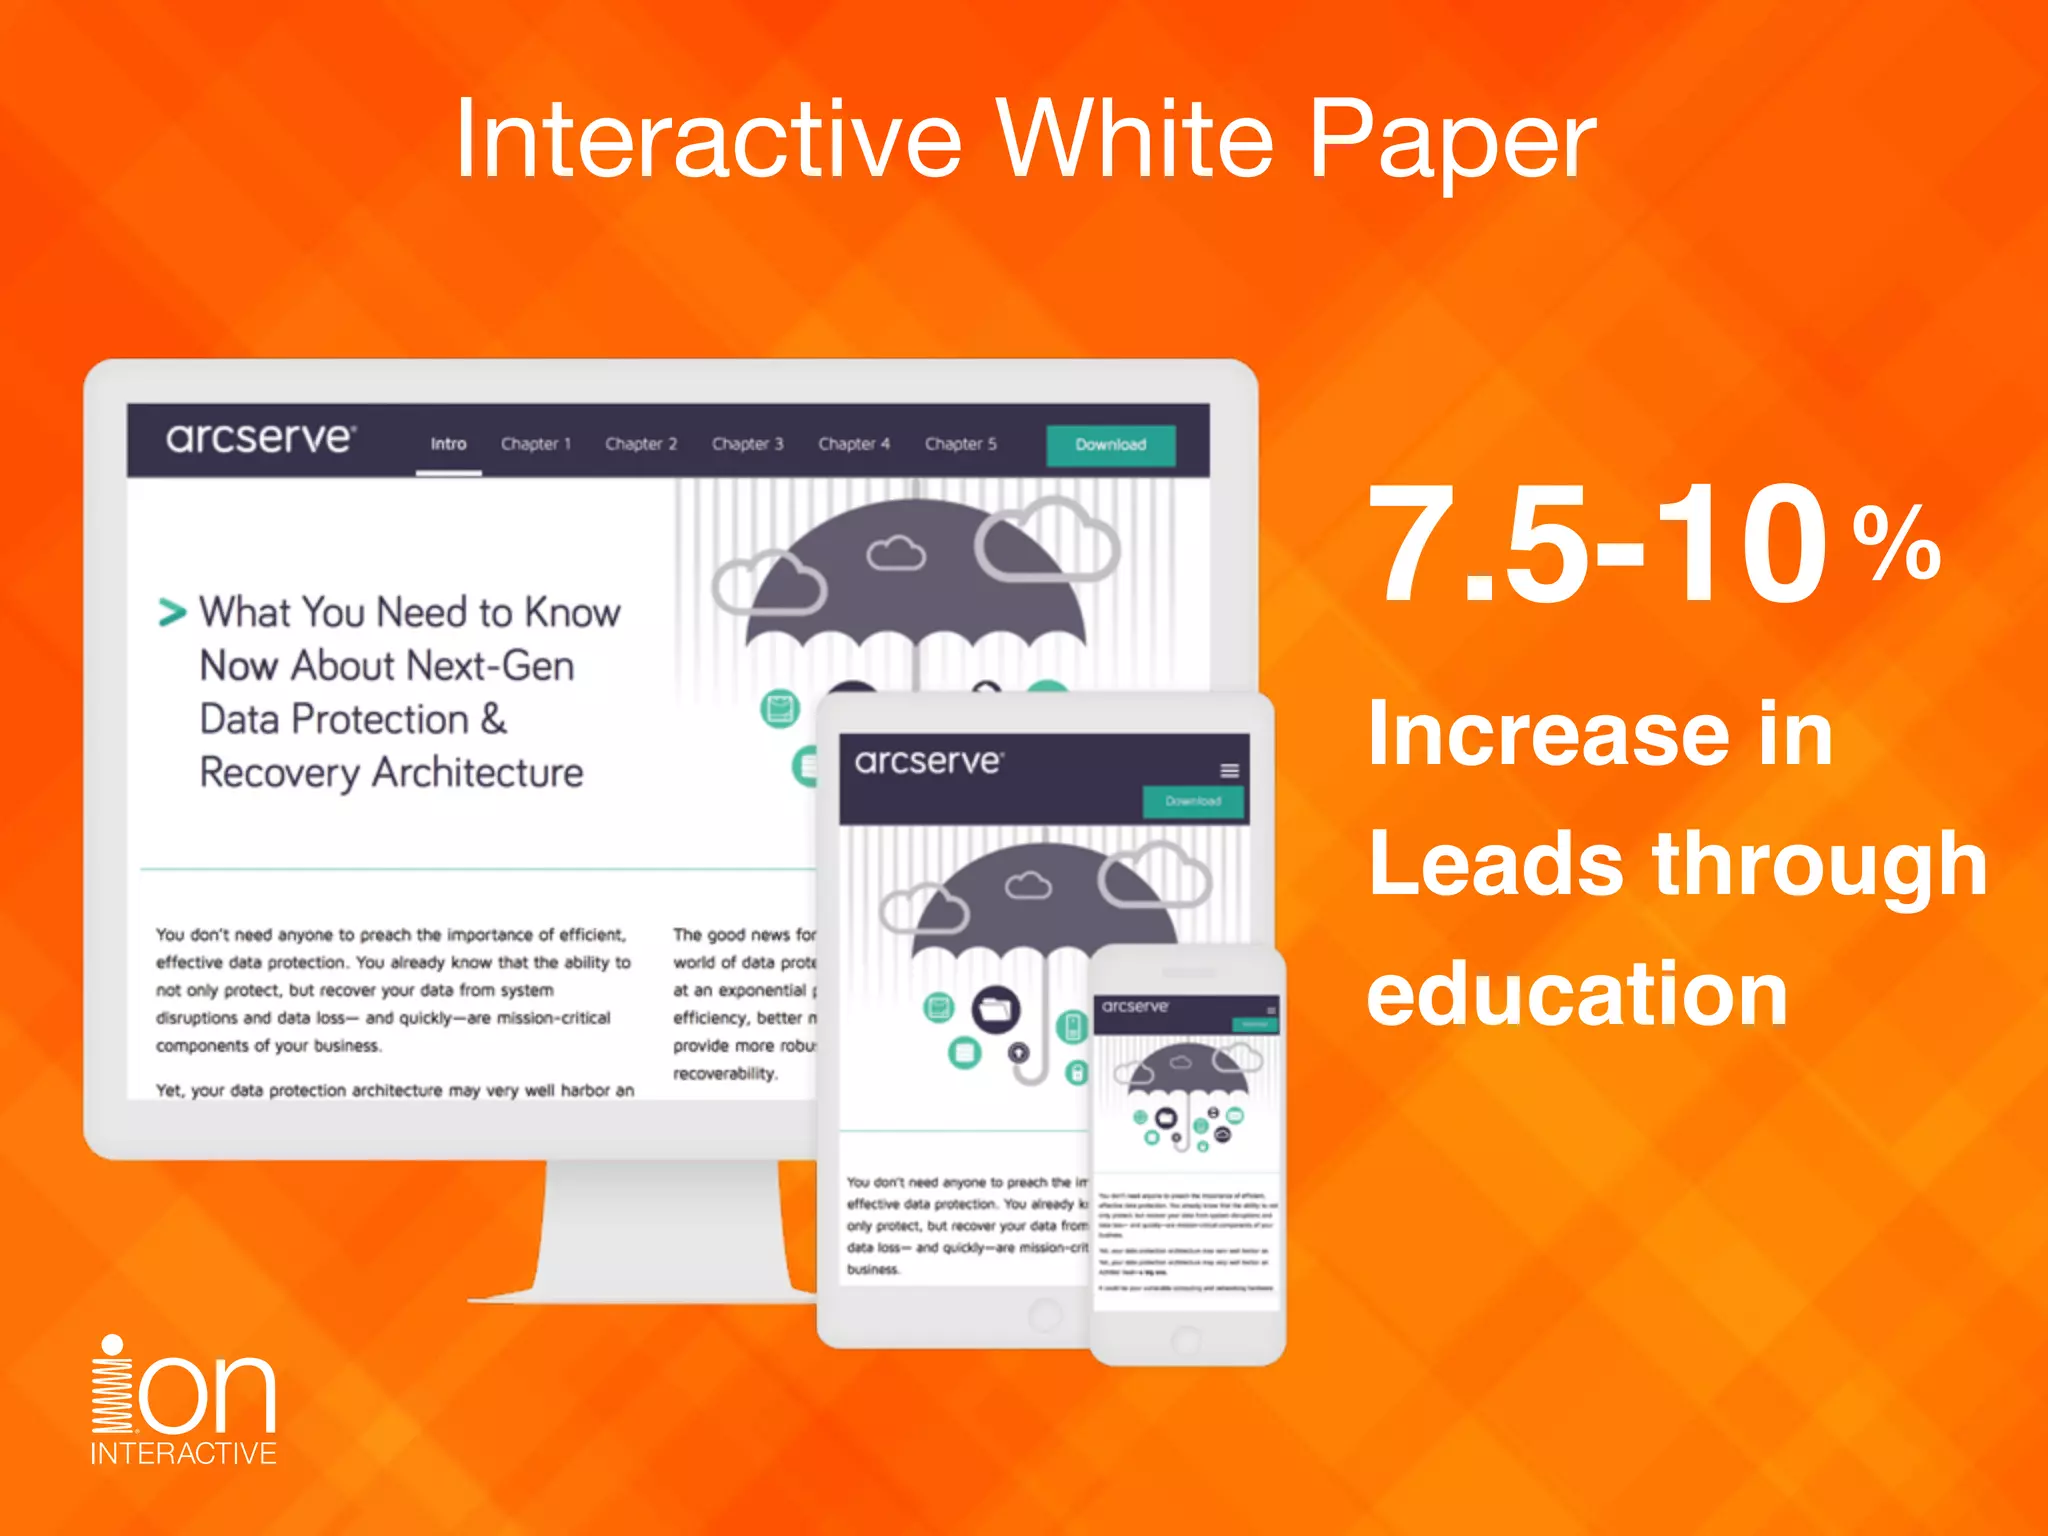
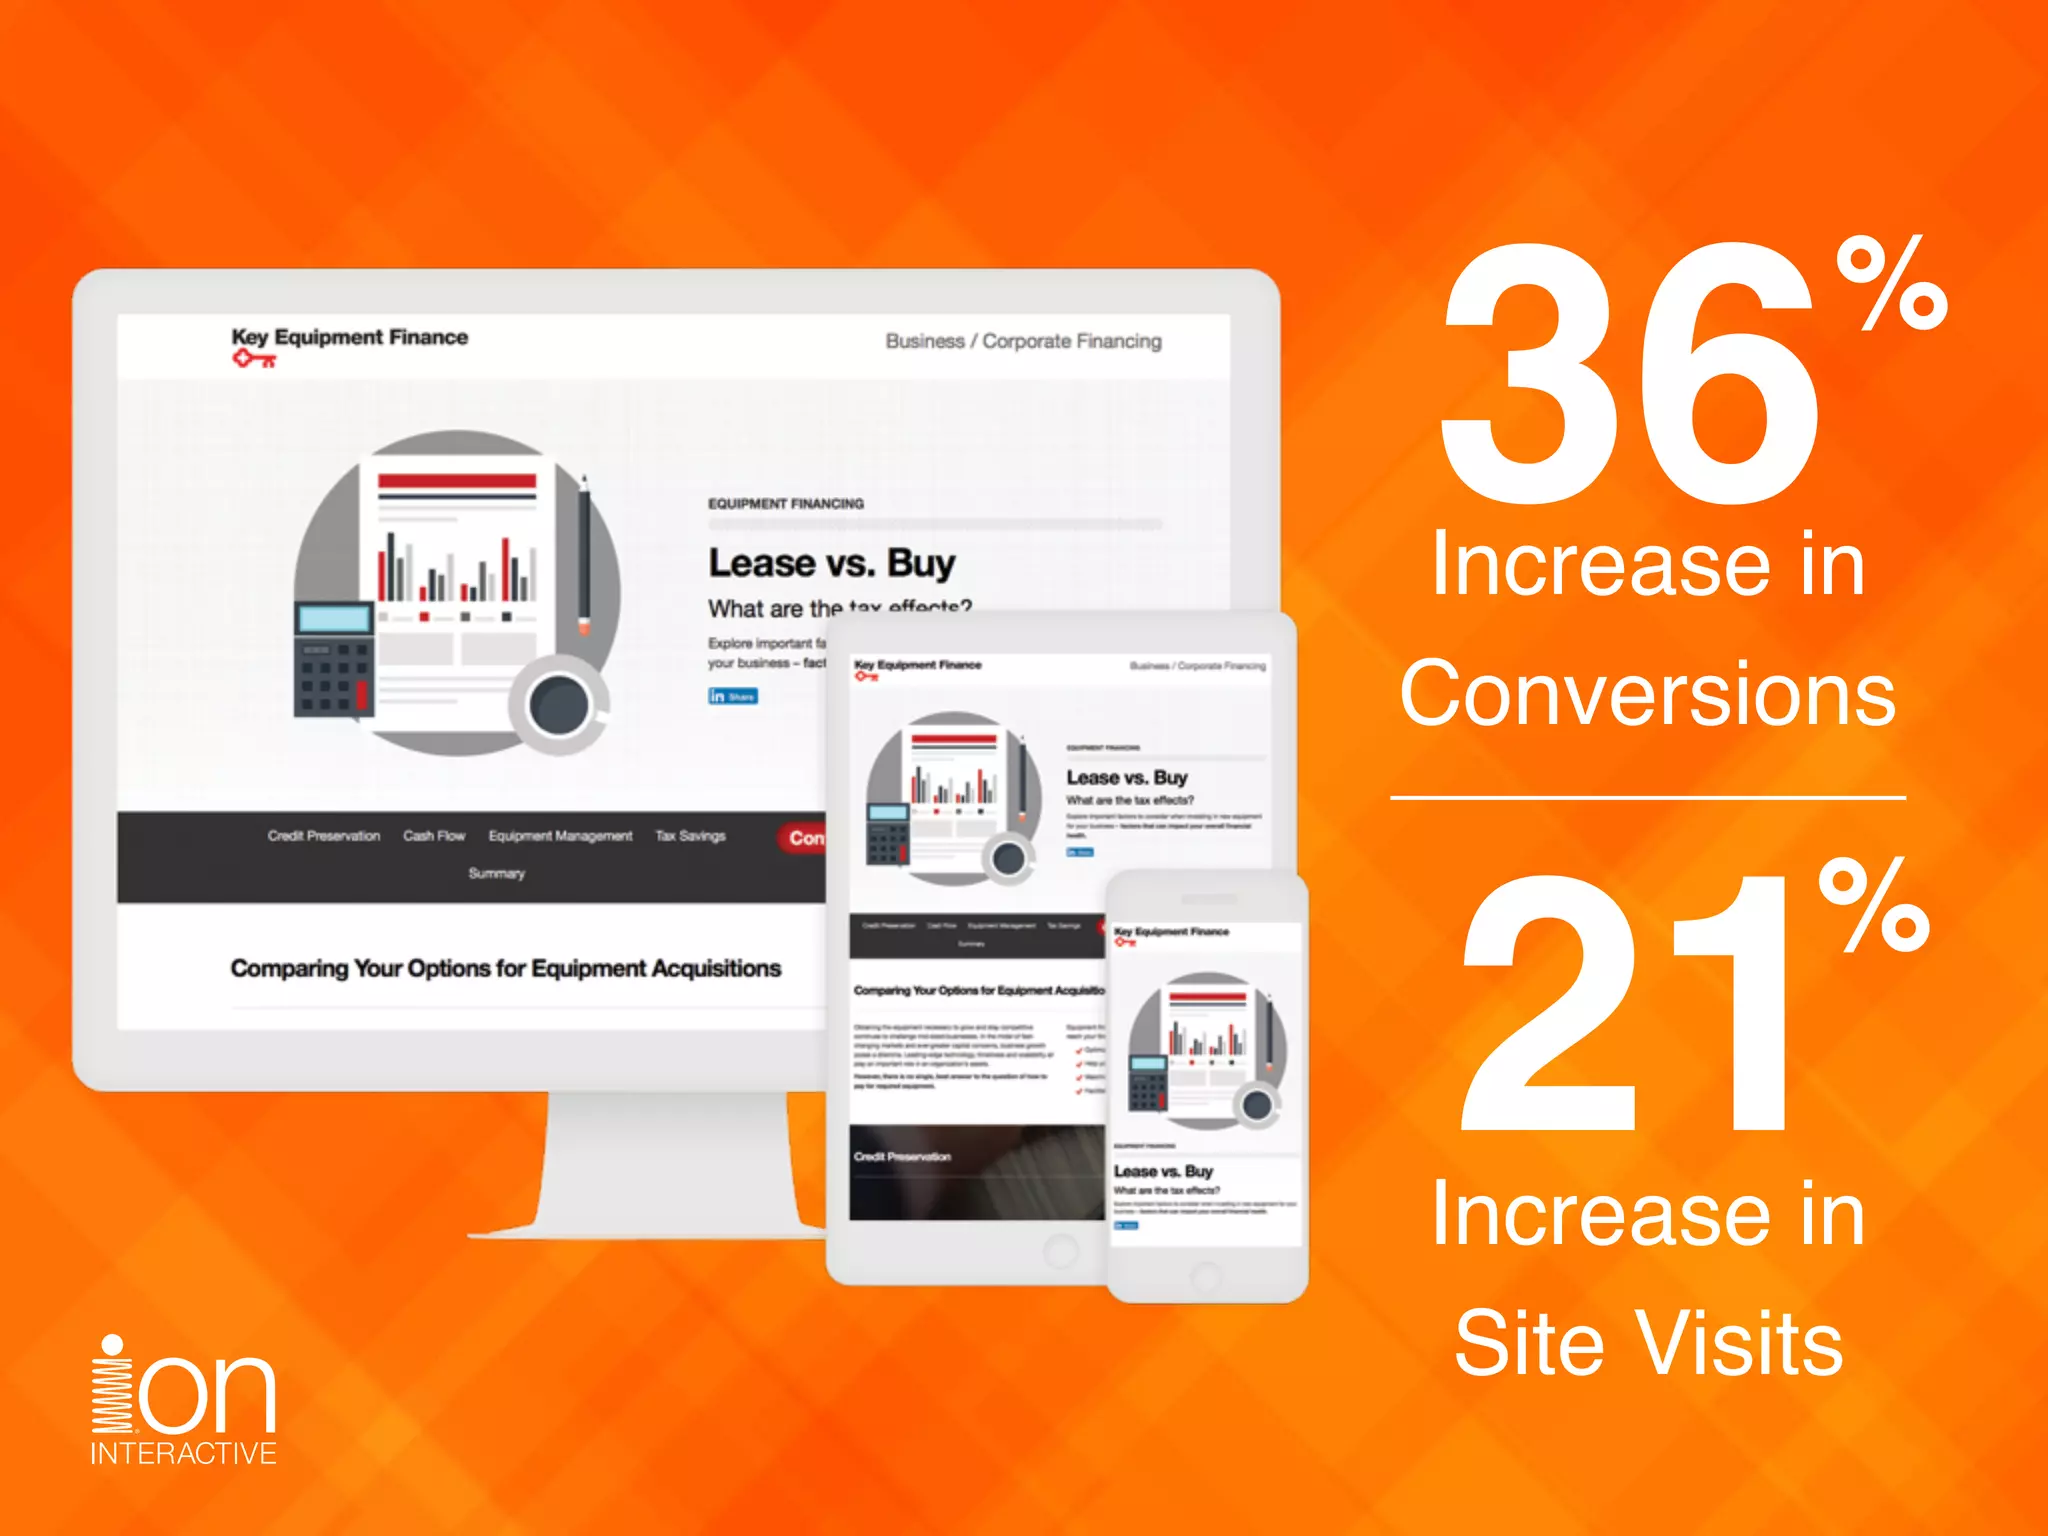
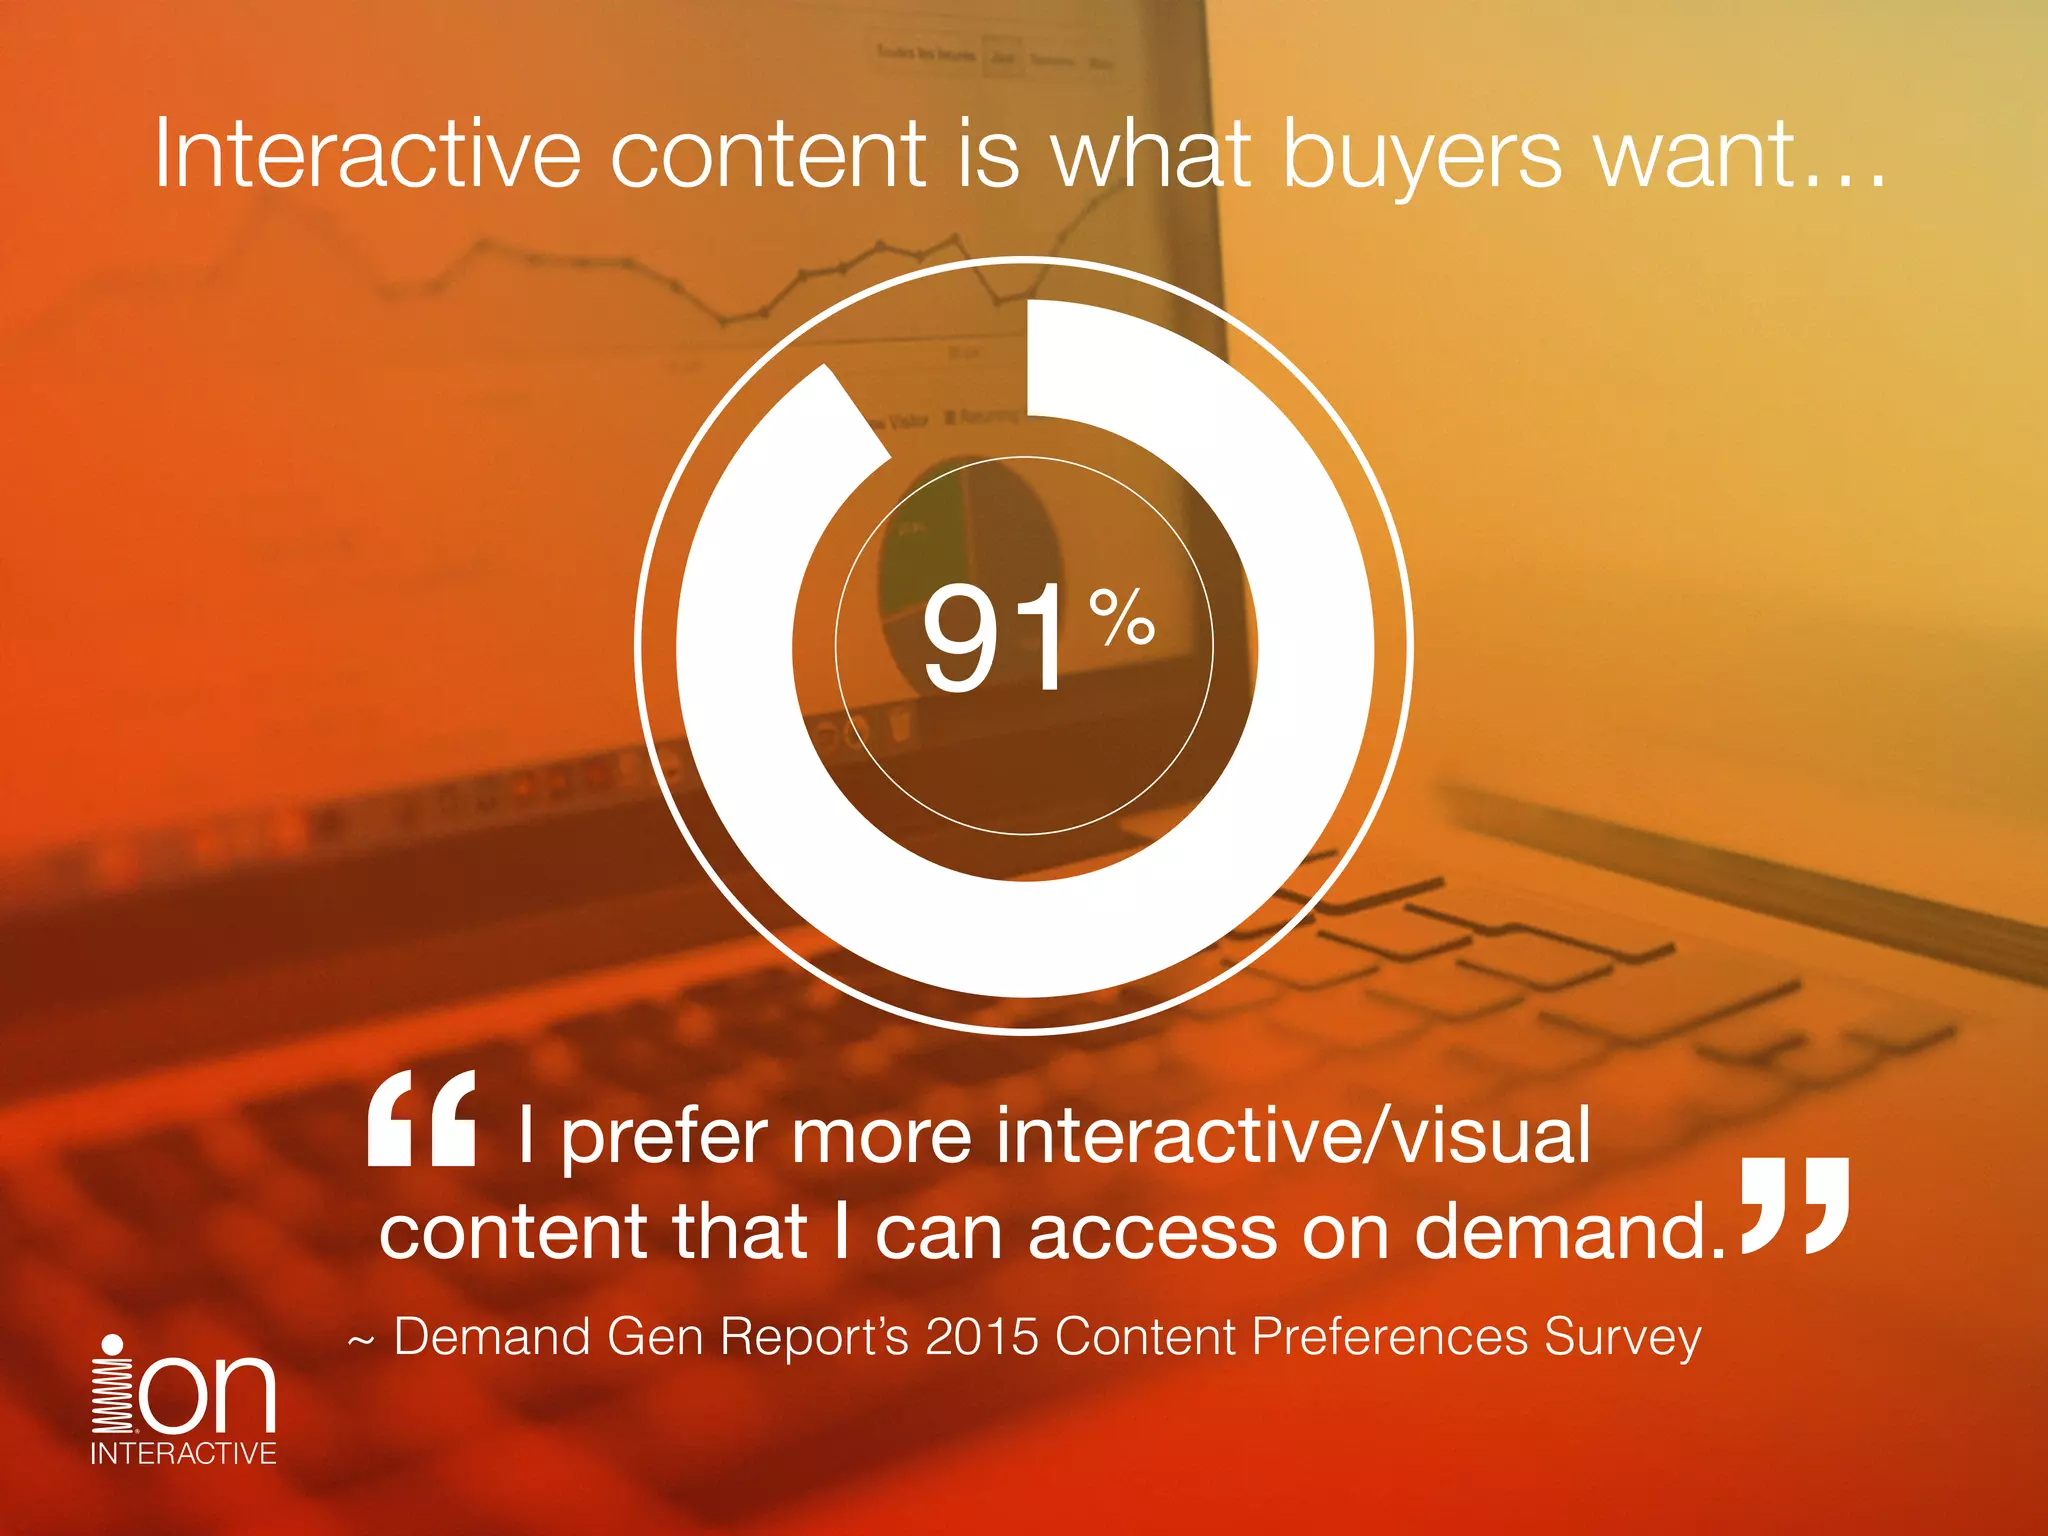
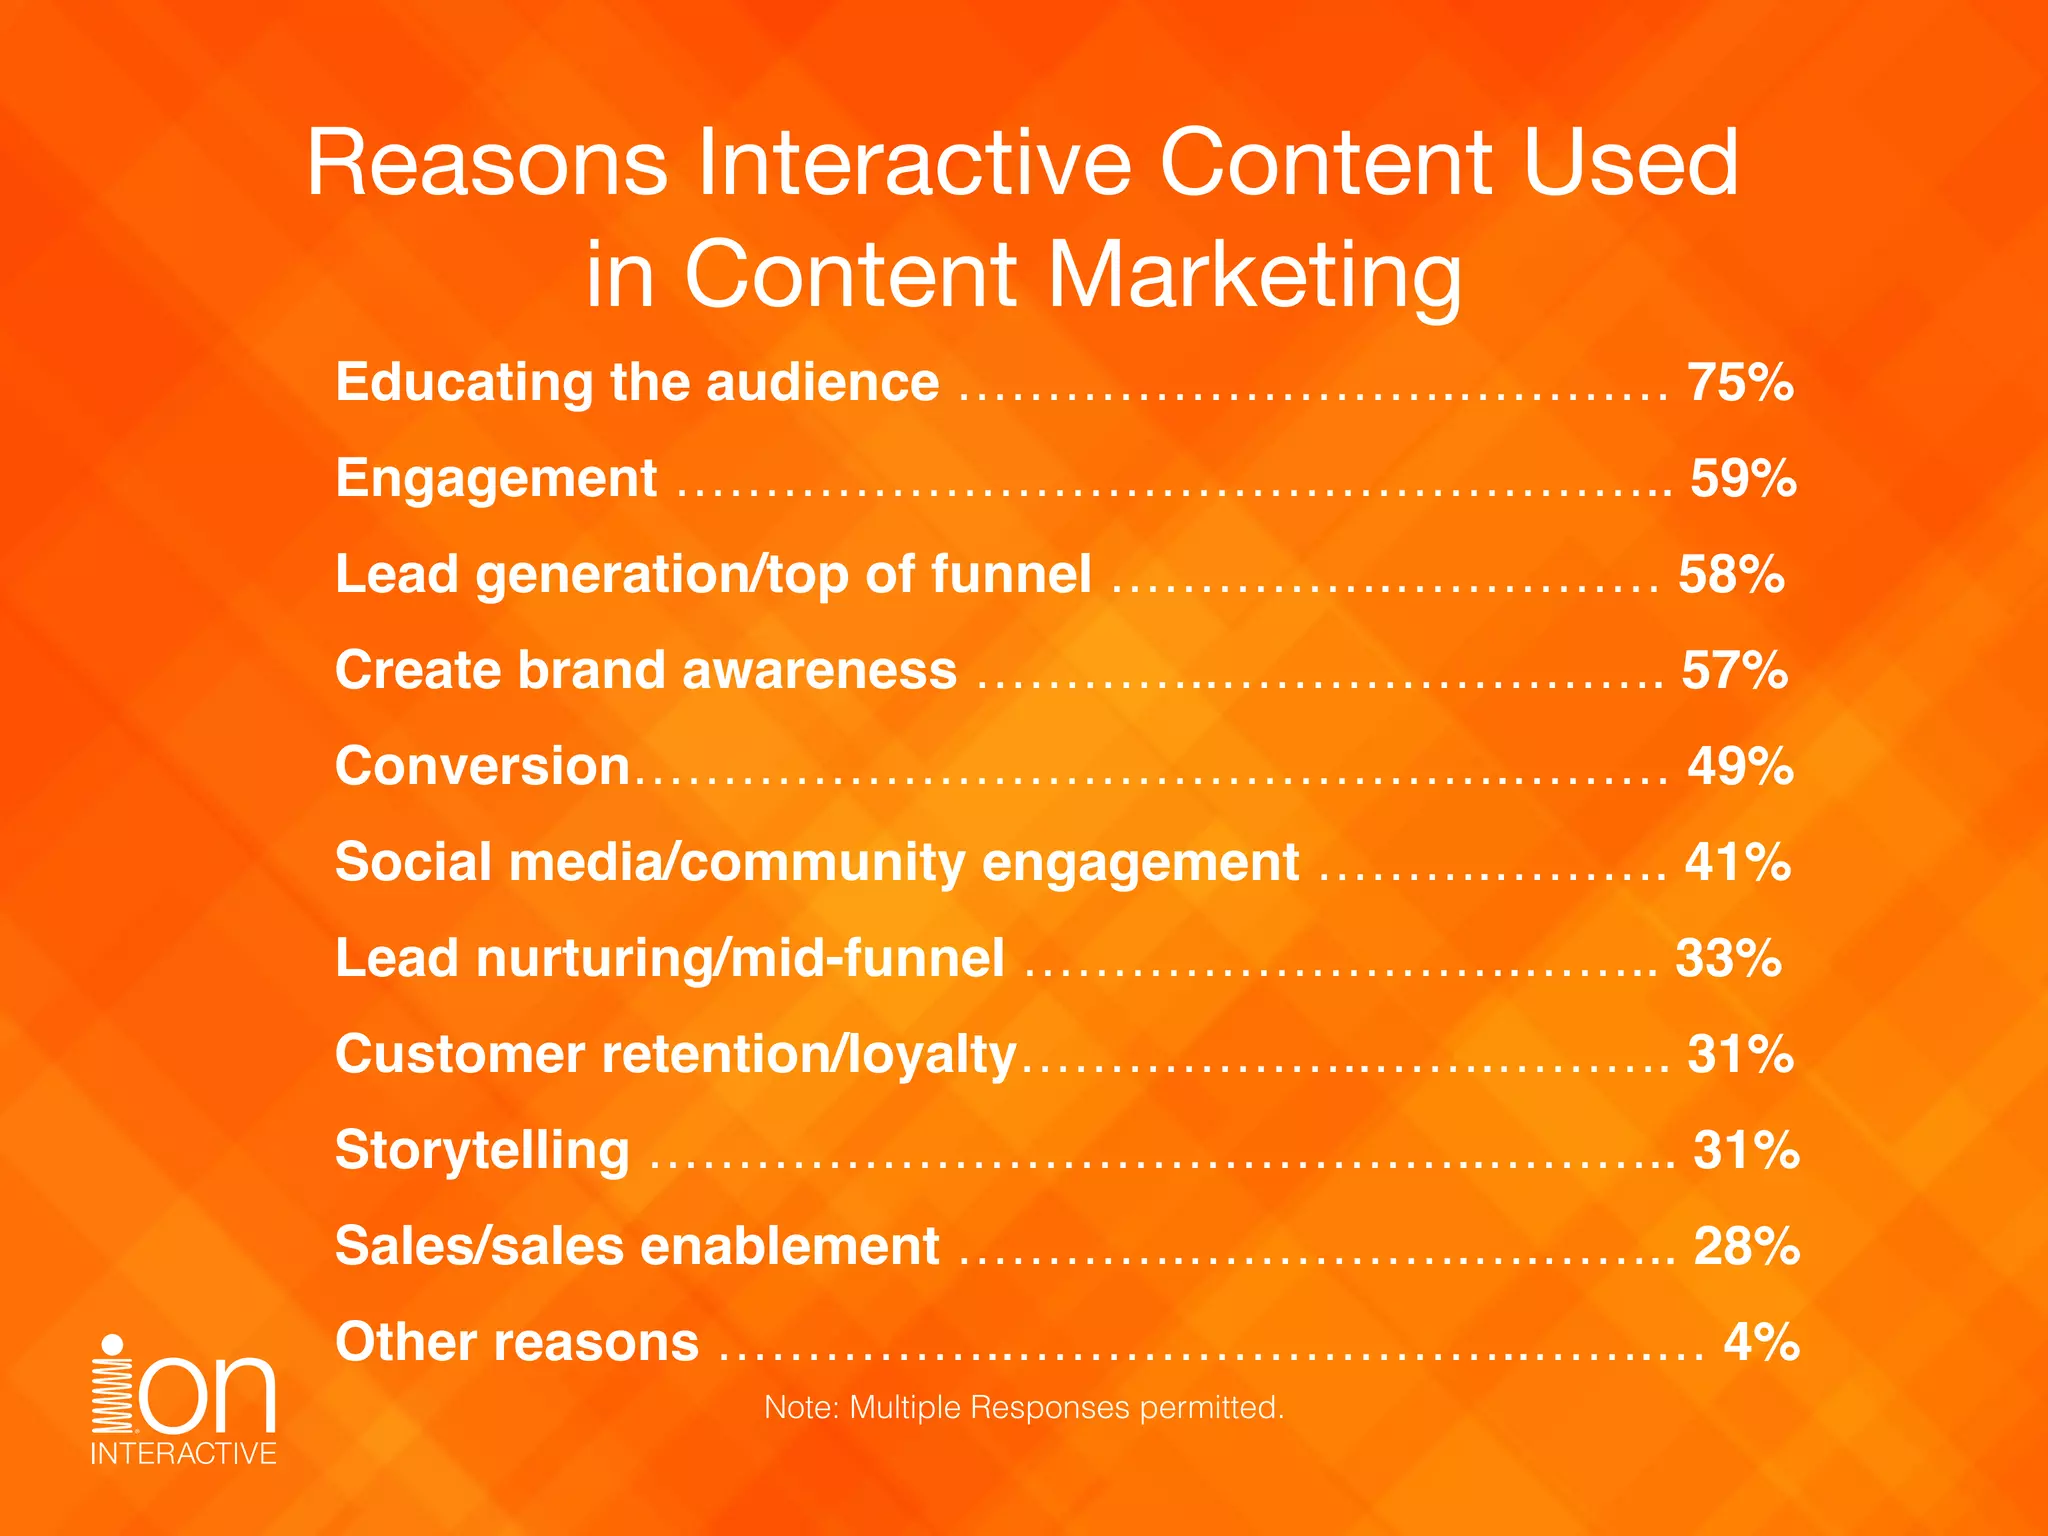
How to Make Your Content
Interactive
What should you build?

What resources do you need?

How much time should you invest?

What should you measure?

Should your content even be interactive?

What’s inside
What should 

you build?
Types of Interactive Content Used
Assessments …………………………………….54%
Calculators .......................................................52%
Contests ...........................................................50%
Quizzes .............................................................48%
Interactive infographics …………………….….44%
Interactive eBooks ………………………………38%
Interactive white papers ……………………..…27%
Configurators .…………….……………..……… 26%
Games ………………………………………….… 24%
Wizards ……………………………………………17%
Interactive lookbooks ………………………..…15%
Note: Multiple Responses permitted.
Start with what you have that

can be repurposed
interactive
WP or
eBook
interactive
infographic
lookbook quiz
solution
builder
assessment configurator calculator
Your whitepaper
becomes… X X
Your product
brochure… X X
Your pricing
sheets… X
Your infographic… X X
Your research… X X X X
Your product
specs… X
Your solution
briefs… X X X
Or consider the Buyers Journey
early mid late
ebook X X
interactive white paper X X
interactive infographic X
lookbook X
quiz X X
game X X
assessment X X
configurator/solution builder X X
calculator X X
Or consider your sources of traffic
interactive
whitepaper
or eBook
interactive
infographic
lookbook quiz
contests/
games
assessment
/scorecard
solution
builder /
configurator
calculator
trade show X X X X
social X X X X
paid search X X X X
organic X X X X X X X
display X X X X
3rd party email X X
house email X X X X X X
native
advertising X
Interactive Content Usage
Note: Multiple Responses permitted.
Landing pages ……………………………………………. 64%
Social media platforms ………………………….………. 51%
Microsites …………………………………..……………… 46%
Blogs …………………………………………….……..…… 45%
eNewsletters ………………………………..……………… 38%
Corporate home page …………………………………….. 34%
Paid content promotion services …………….………….18%
Other places ……………………………………………….… 6%
https://apps.ioninteractive.com/site/solution-finder/interactive-content
Use our Content Solution Finder
Considerations
• Goals for the interactive content

• How you will measure success

• What you already have that can be
repurposed

• Where in the buyers journey you are
focused on

• How you will drive traffic to your
experience(s)
What resources

do you need?
There are only

two ways

interactive content

gets made…
Web developer

(Codes it)
Interactive content
marketing software
Functional 

Resources
• Strategy (what you should 

build, why, etc)

• Copywriting

• Design

• Software or coding

• Analysis
How much time

should you invest?
Consider how valuable a particular interactive content experience 

is likely to be for your buyer and for your company…
Will your audience find it helpful or
useful?
unlikely
somewhat

likely
very likely
Will your audience find this entertaining
or educational?
unlikely
somewhat

likely
very likely
Will it be the type of experience your
audience will want to share?
unlikely
somewhat

likely
very likely
Will you have a clear call to action such
as lead conversion, purchase or contact
sales?
no call

to action
somewhat

likely
primary
emphasis on
call to action
Will it be used across a variety of
campaigns and/or types of traffic?
single
campaign/type
of traffic
across some
campaigns/
traffic
yes, many
campaigns/
traffic
Is it time-based (usefulness will expire),
or can be useful over an extended
period of time?
1-3 months 3-12 months 12+ months
Use this matrix to determine if you should proceed, based on the
intersection of effort expended to create/launch and potential value:
high value mid value low value
high effort
(think: 5+ days of effort)
yes! consider avoid
mid effort
(think: 2-5 days)
yes! yes! avoid
low effort
(think: <1 day)
yes! yes! yes!
High Value, High Effort : go for it
High Value, Low Effort: go for it
High Effort, Low Value: proceed with caution
Balancing Effort & Value
Bottom line:

Hours, days or 

weeks? (it depends)
What should 

you measure?
Use behavioral tagging to gain insight

into your what content your visitors are
consuming
Increment a point each time your visitor

takes any action inside the interactive

content experience
1+
1+ 1+
1+
1+
Example: Interactive Table of Contents, 50 Ways to Engage
Surface engagement/content consumption to
your sales team
How are you doing with the measurement basics for your interactive
content?
You measure bounce rate for the interactive
content experience, by traffic source and/or
campaign.
no yes
You measure time spent for the interactive
content experience, by traffic source and/or
campaign.
no yes
You measure conversion rate for the interactive
content experience, by traffic source and/or
campaign.
no yes
You track and evaluate visitor behavior to
understand what’s working, and what’s not.
no yes
You use engagement scores for your interactive
content to understand content consumption.
no yes
You surface visitor behaviors, outcomes and
engagement scores to sales in a contextually
meaningful way.
no yes
Measuring Interactive Content
Website traffic ……………………………………………………………… 49%
Higher conversion rates…………………………………………..….…… 47%
Social media sharing……………………………………………..…..…… 43%
Time spent on website………………………………………..……..……. 41%
Sales lead quality (e.g., sales accepted leads) …………………….… 40%
Data capture…………………………………………………………………. 37%
Sales lead quantity………………………………………………….….….. 30%
Qualitative feedback from customers …………………………….……. 25%
Inbound links ……………………………………………………..………… 24%
SEO ranking…………………………………………………………………. 23%
Sales ……………………………………………………………….……..….. 23%
Subscriber growth ……………………………………………..………….. 23%
Brand lift …………………………………………………………………….. 21%
Purchase intent …………………………………………………………….. 16%
Brand differentiation ……………………………………………..…………15%
Customer renewal rates………………………………….…………………15%
Cost savings …………………………………………………….…………… 6%
Other methods ………………………………………………….…………….1%
Do not measure ………………………………………..…………..………… 7%
The Process
Interactive Content Process
STEP 1
Brainstorm

STEP 2

ConceptBrief

STEP 3
Interactive

Wireframe

STEP 4
Design & Build

STEP 5
QA
STEP 6
Launch
STEP 8
Review & 

Measurement
STEP 7
Promote
Should your content

even be interactive?
Bottom line: YES
Comparing interactive to passive content, interactive 

content is somewhat or very effective at...
generating conversions
36%
INTERACTIVE CONTENT STATIC CONTENT
%
70%
VS
Comparing interactive to passive content, interactive 

content is somewhat or very effective at...
educating the buyer
70%
INTERACTIVE CONTENT STATIC CONTENT
93%
VS
Comparing interactive to passive content, interactive 

content is somewhat or very effective at...
differentiating from competitors
55%
INTERACTIVE CONTENT STATIC CONTENT
88%
VS
Comparing interactive to passive content, interactive 

content is somewhat or very effective at...
being shared
17%
INTERACTIVE CONTENT STATIC CONTENT
38%
VS
A Popular Approach
More than half of marketers surveyed

are now using interactive content

53%
More On the Horizon
Anticipate increase in use of interactive

content in 2016 versus 2015
75%
Our audience engagement
has increased since my
organization started using
interactive content tactics
Engagement
66 AGREE%
66%
Interactive content provides 

me with valuable ways to

repurpose my organization’s 

passive content.
Content
Repurposing
67 AGREE%
67%
Non gated interactive content

can provide a “sample” of

the brand, resulting in a higher
degree of lead nurturing
Lead

Nurturing
75 AGREE%
75%
Combining traditional content
marketing tactics with interactive
content enhances retention of my
organization’s message
Education
79 AGREE%
79%
Interactive content can have
reusable value, resulting in repeat
visitors and multiple exposures
Web Traffic
79 AGREE%
79%
Interactive content grabs the
attention of the reader more
effectively than static content
Attention/
Differentiation
81 AGREE%
81%
50XEngagement
An engaging quiz
drives 50 times more
participation
4XConversions
Purchasing power drove
4 times the number 

of e-commerce
conversions.
7.5-10 

Increase in 

Leads through
education
%
Interactive White Paper
36Increase in 

Conversions
21Increase in 

Site Visits
%
%
I prefer more interactive/visual

content that I can access on demand.“ ”~ Demand Gen Report’s 2015 Content Preferences Survey
91%
Interactive content is what buyers want…
Reasons Interactive Content Used 

in Content Marketing
Educating the audience ……………………….………… 75%
Engagement ……………………………………………….. 59%
Lead generation/top of funnel …………….…………… 58%
Create brand awareness …………..……………………. 57%
Conversion………………………………………….……… 49%
Social media/community engagement ……….………. 41%
Lead nurturing/mid-funnel ……………………….…….. 33%
Customer retention/loyalty………………..…….………. 31%
Storytelling ………………………………………..……….. 31%
Sales/sales enablement ………….…………….….…….. 28%
Other reasons ……………..………………………..…….… 4%
Note: Multiple Responses permitted.
Quite simply, it’a not a question

of whether companies should use

interactive content but rather

how soon they should start.
“
”~ Content Marketing Institute
ion Capabilities
Create any type of responsive,
data-driven interactive content
experience

Reduce time to market using our
pre-built quick start,templates, or
start from a blank slate

Go live right inside the platform,
using your customized, branded
URLs
Conduct real-time A/B testing to
improve results
View real-time analytics on
performance and measurement
Surface individual buyer insights to
sales
Integrate with your CRM, marketing
automation and more
info@ioninteractive.com
atalerico@ioninteractive.com
twitter: @annatalerico
Let’s connect

How to Make Your Content Interactive

  • 1.
    How to MakeYour Content Interactive
  • 2.
    What should youbuild?
 What resources do you need?
 How much time should you invest?
 What should you measure?
 Should your content even be interactive?
 What’s inside
  • 3.
  • 4.
    Types of InteractiveContent Used Assessments …………………………………….54% Calculators .......................................................52% Contests ...........................................................50% Quizzes .............................................................48% Interactive infographics …………………….….44% Interactive eBooks ………………………………38% Interactive white papers ……………………..…27% Configurators .…………….……………..……… 26% Games ………………………………………….… 24% Wizards ……………………………………………17% Interactive lookbooks ………………………..…15% Note: Multiple Responses permitted.
  • 5.
    Start with whatyou have that
 can be repurposed interactive WP or eBook interactive infographic lookbook quiz solution builder assessment configurator calculator Your whitepaper becomes… X X Your product brochure… X X Your pricing sheets… X Your infographic… X X Your research… X X X X Your product specs… X Your solution briefs… X X X
  • 6.
    Or consider theBuyers Journey early mid late ebook X X interactive white paper X X interactive infographic X lookbook X quiz X X game X X assessment X X configurator/solution builder X X calculator X X
  • 7.
    Or consider yoursources of traffic interactive whitepaper or eBook interactive infographic lookbook quiz contests/ games assessment /scorecard solution builder / configurator calculator trade show X X X X social X X X X paid search X X X X organic X X X X X X X display X X X X 3rd party email X X house email X X X X X X native advertising X
  • 8.
    Interactive Content Usage Note:Multiple Responses permitted. Landing pages ……………………………………………. 64% Social media platforms ………………………….………. 51% Microsites …………………………………..……………… 46% Blogs …………………………………………….……..…… 45% eNewsletters ………………………………..……………… 38% Corporate home page …………………………………….. 34% Paid content promotion services …………….………….18% Other places ……………………………………………….… 6%
  • 9.
  • 10.
    Considerations • Goals forthe interactive content
 • How you will measure success
 • What you already have that can be repurposed
 • Where in the buyers journey you are focused on
 • How you will drive traffic to your experience(s)
  • 11.
  • 12.
    There are only
 twoways
 interactive content
 gets made…
  • 13.
  • 14.
  • 15.
    Functional 
 Resources • Strategy(what you should 
 build, why, etc)
 • Copywriting
 • Design
 • Software or coding
 • Analysis
  • 16.
  • 17.
    Consider how valuablea particular interactive content experience 
 is likely to be for your buyer and for your company… Will your audience find it helpful or useful? unlikely somewhat
 likely very likely Will your audience find this entertaining or educational? unlikely somewhat
 likely very likely Will it be the type of experience your audience will want to share? unlikely somewhat
 likely very likely Will you have a clear call to action such as lead conversion, purchase or contact sales? no call
 to action somewhat
 likely primary emphasis on call to action Will it be used across a variety of campaigns and/or types of traffic? single campaign/type of traffic across some campaigns/ traffic yes, many campaigns/ traffic Is it time-based (usefulness will expire), or can be useful over an extended period of time? 1-3 months 3-12 months 12+ months
  • 18.
    Use this matrixto determine if you should proceed, based on the intersection of effort expended to create/launch and potential value: high value mid value low value high effort (think: 5+ days of effort) yes! consider avoid mid effort (think: 2-5 days) yes! yes! avoid low effort (think: <1 day) yes! yes! yes!
  • 19.
    High Value, HighEffort : go for it
  • 20.
    High Value, LowEffort: go for it
  • 21.
    High Effort, LowValue: proceed with caution
  • 22.
  • 23.
    Bottom line:
 Hours, daysor 
 weeks? (it depends)
  • 24.
  • 25.
    Use behavioral taggingto gain insight
 into your what content your visitors are consuming
  • 26.
    Increment a pointeach time your visitor
 takes any action inside the interactive
 content experience 1+ 1+ 1+ 1+ 1+ Example: Interactive Table of Contents, 50 Ways to Engage
  • 27.
  • 28.
    How are youdoing with the measurement basics for your interactive content? You measure bounce rate for the interactive content experience, by traffic source and/or campaign. no yes You measure time spent for the interactive content experience, by traffic source and/or campaign. no yes You measure conversion rate for the interactive content experience, by traffic source and/or campaign. no yes You track and evaluate visitor behavior to understand what’s working, and what’s not. no yes You use engagement scores for your interactive content to understand content consumption. no yes You surface visitor behaviors, outcomes and engagement scores to sales in a contextually meaningful way. no yes
  • 29.
    Measuring Interactive Content Websitetraffic ……………………………………………………………… 49% Higher conversion rates…………………………………………..….…… 47% Social media sharing……………………………………………..…..…… 43% Time spent on website………………………………………..……..……. 41% Sales lead quality (e.g., sales accepted leads) …………………….… 40% Data capture…………………………………………………………………. 37% Sales lead quantity………………………………………………….….….. 30% Qualitative feedback from customers …………………………….……. 25% Inbound links ……………………………………………………..………… 24% SEO ranking…………………………………………………………………. 23% Sales ……………………………………………………………….……..….. 23% Subscriber growth ……………………………………………..………….. 23% Brand lift …………………………………………………………………….. 21% Purchase intent …………………………………………………………….. 16% Brand differentiation ……………………………………………..…………15% Customer renewal rates………………………………….…………………15% Cost savings …………………………………………………….…………… 6% Other methods ………………………………………………….…………….1% Do not measure ………………………………………..…………..………… 7%
  • 30.
  • 31.
    Interactive Content Process STEP1 Brainstorm
 STEP 2
 ConceptBrief
 STEP 3 Interactive
 Wireframe
 STEP 4 Design & Build
 STEP 5 QA STEP 6 Launch STEP 8 Review & 
 Measurement STEP 7 Promote
  • 32.
  • 33.
  • 34.
    Comparing interactive topassive content, interactive 
 content is somewhat or very effective at... generating conversions 36% INTERACTIVE CONTENT STATIC CONTENT % 70% VS
  • 35.
    Comparing interactive topassive content, interactive 
 content is somewhat or very effective at... educating the buyer 70% INTERACTIVE CONTENT STATIC CONTENT 93% VS
  • 36.
    Comparing interactive topassive content, interactive 
 content is somewhat or very effective at... differentiating from competitors 55% INTERACTIVE CONTENT STATIC CONTENT 88% VS
  • 37.
    Comparing interactive topassive content, interactive 
 content is somewhat or very effective at... being shared 17% INTERACTIVE CONTENT STATIC CONTENT 38% VS
  • 38.
    A Popular Approach Morethan half of marketers surveyed
 are now using interactive content
 53%
  • 39.
    More On theHorizon Anticipate increase in use of interactive
 content in 2016 versus 2015 75%
  • 40.
    Our audience engagement hasincreased since my organization started using interactive content tactics Engagement 66 AGREE% 66%
  • 41.
    Interactive content provides
 me with valuable ways to
 repurpose my organization’s 
 passive content. Content Repurposing 67 AGREE% 67%
  • 42.
    Non gated interactivecontent
 can provide a “sample” of
 the brand, resulting in a higher degree of lead nurturing Lead
 Nurturing 75 AGREE% 75%
  • 43.
    Combining traditional content marketingtactics with interactive content enhances retention of my organization’s message Education 79 AGREE% 79%
  • 44.
    Interactive content canhave reusable value, resulting in repeat visitors and multiple exposures Web Traffic 79 AGREE% 79%
  • 45.
    Interactive content grabsthe attention of the reader more effectively than static content Attention/ Differentiation 81 AGREE% 81%
  • 46.
    50XEngagement An engaging quiz drives50 times more participation
  • 47.
    4XConversions Purchasing power drove 4times the number 
 of e-commerce conversions.
  • 48.
    7.5-10 
 Increase in
 Leads through education % Interactive White Paper
  • 49.
  • 50.
    I prefer moreinteractive/visual
 content that I can access on demand.“ ”~ Demand Gen Report’s 2015 Content Preferences Survey 91% Interactive content is what buyers want…
  • 51.
    Reasons Interactive ContentUsed 
 in Content Marketing Educating the audience ……………………….………… 75% Engagement ……………………………………………….. 59% Lead generation/top of funnel …………….…………… 58% Create brand awareness …………..……………………. 57% Conversion………………………………………….……… 49% Social media/community engagement ……….………. 41% Lead nurturing/mid-funnel ……………………….…….. 33% Customer retention/loyalty………………..…….………. 31% Storytelling ………………………………………..……….. 31% Sales/sales enablement ………….…………….….…….. 28% Other reasons ……………..………………………..…….… 4% Note: Multiple Responses permitted.
  • 52.
    Quite simply, it’anot a question
 of whether companies should use
 interactive content but rather
 how soon they should start. “ ”~ Content Marketing Institute
  • 53.
    ion Capabilities Create anytype of responsive, data-driven interactive content experience
 Reduce time to market using our pre-built quick start,templates, or start from a blank slate
 Go live right inside the platform, using your customized, branded URLs Conduct real-time A/B testing to improve results View real-time analytics on performance and measurement Surface individual buyer insights to sales Integrate with your CRM, marketing automation and more
  • 54.