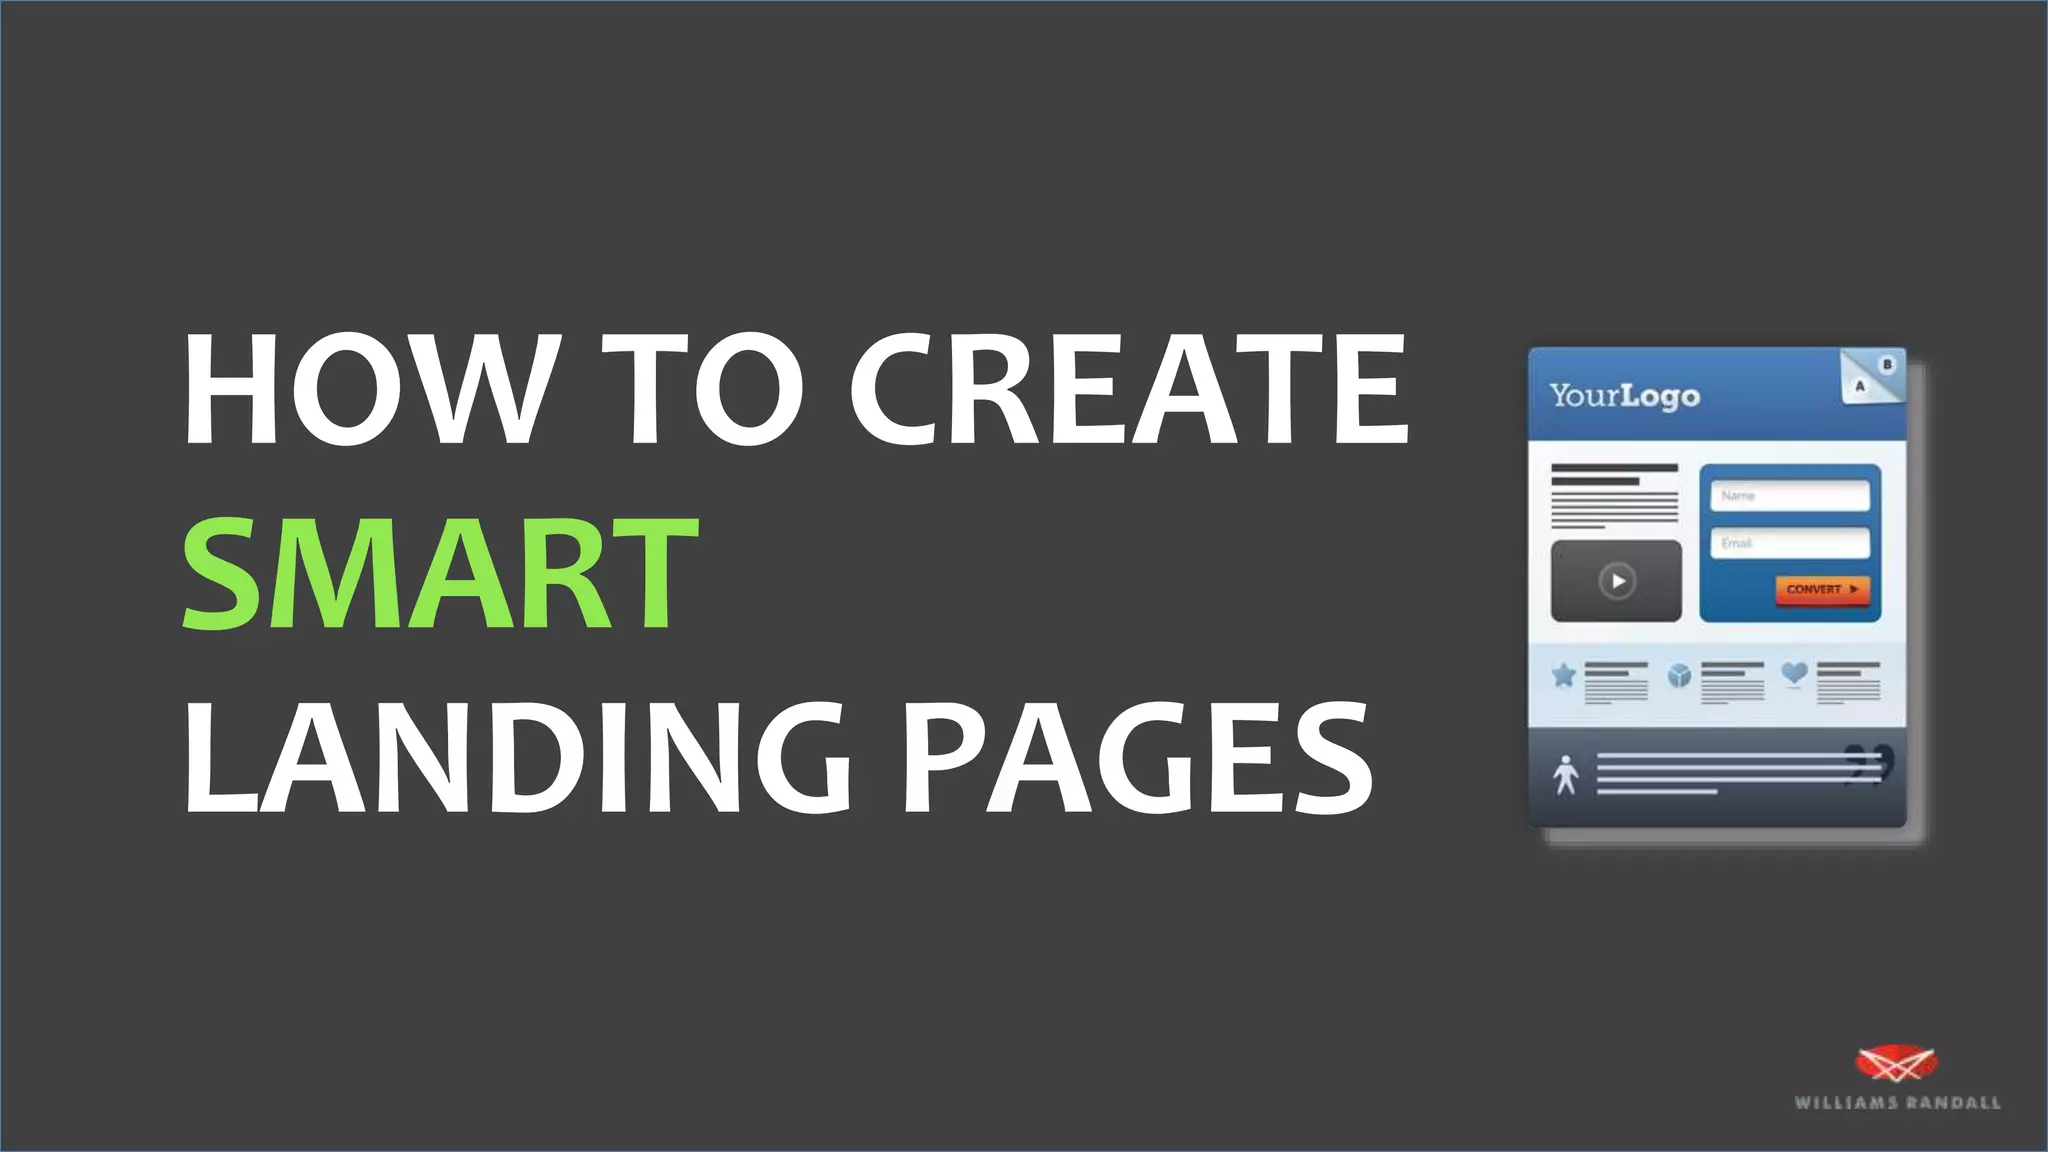
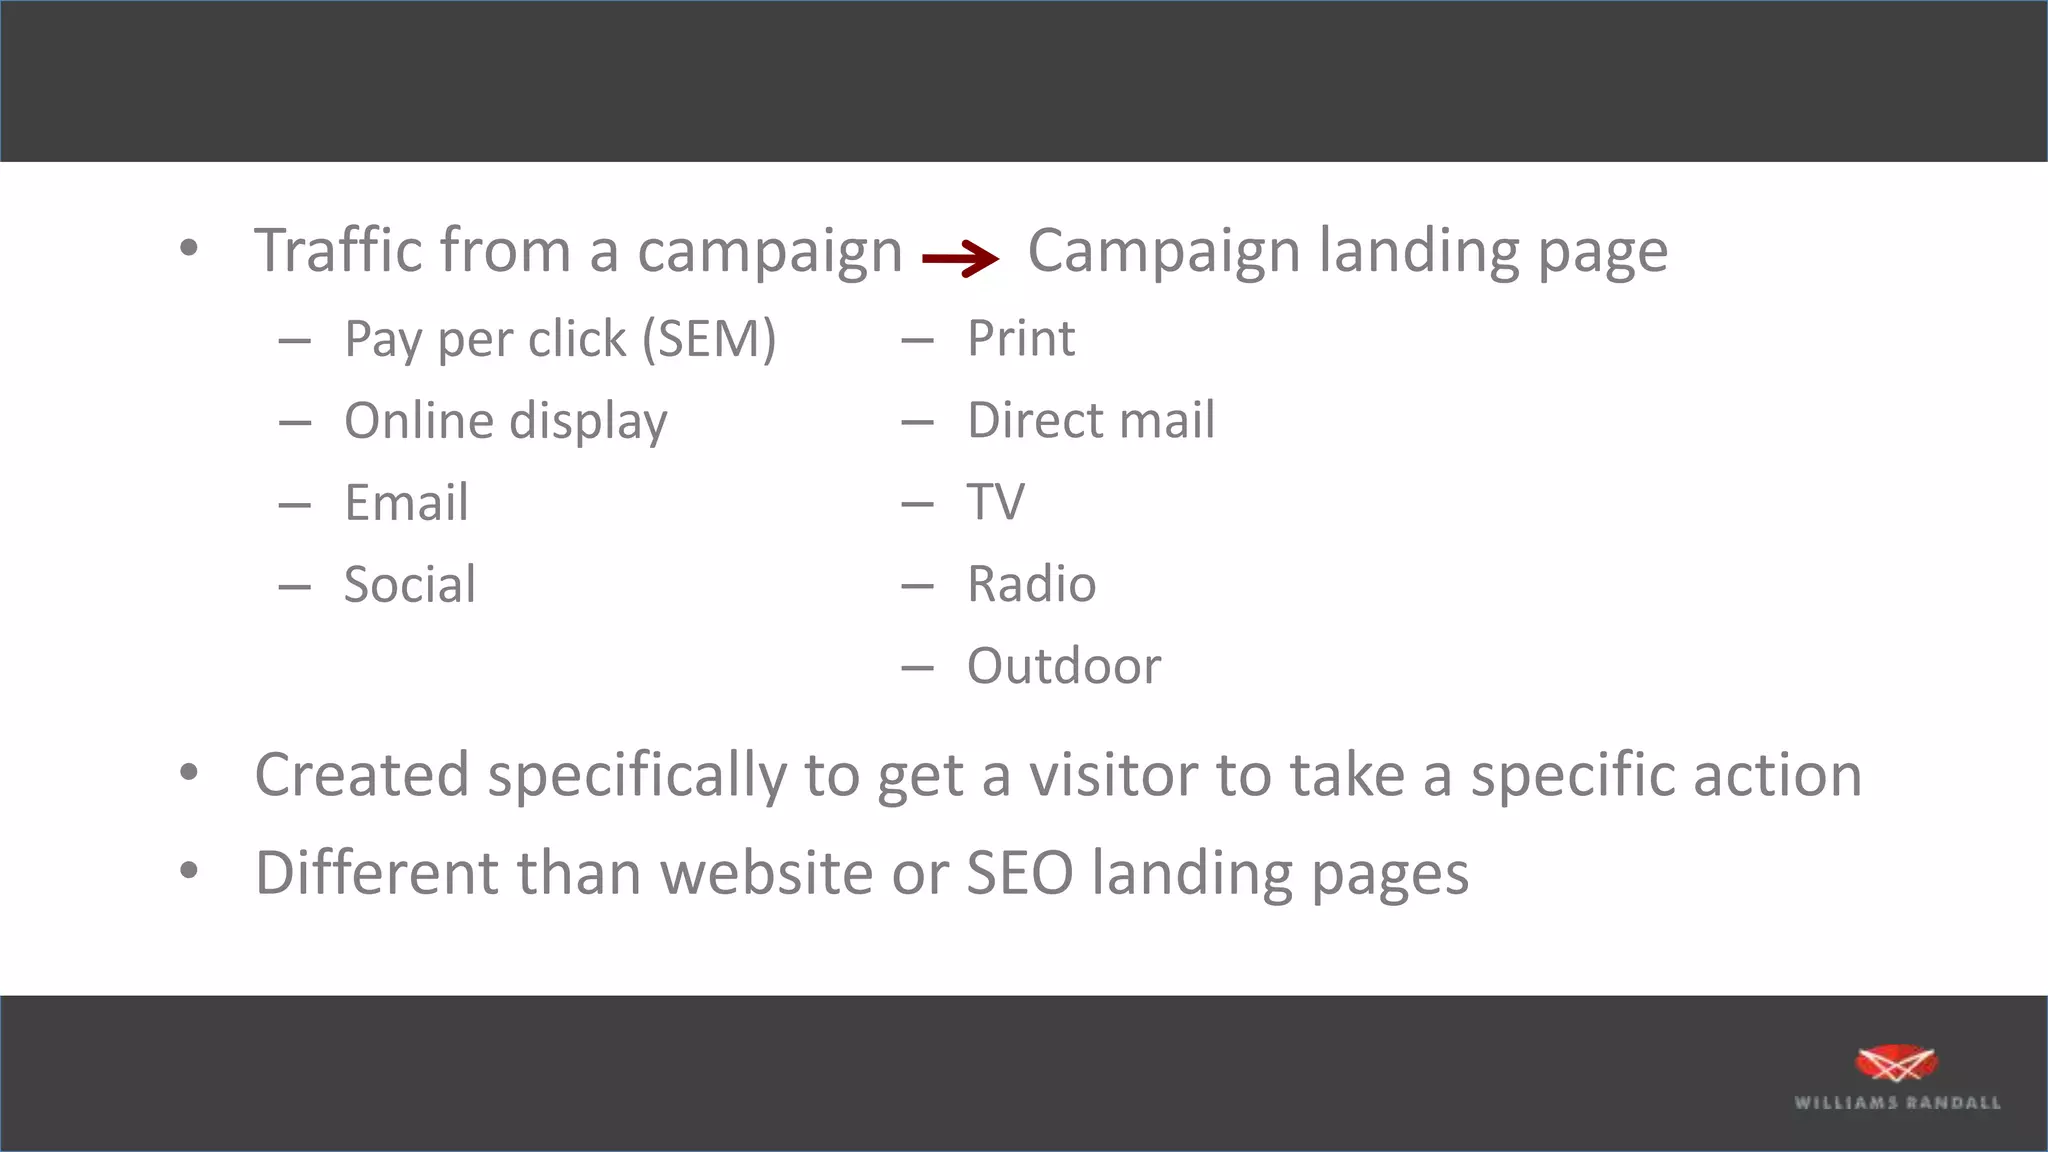
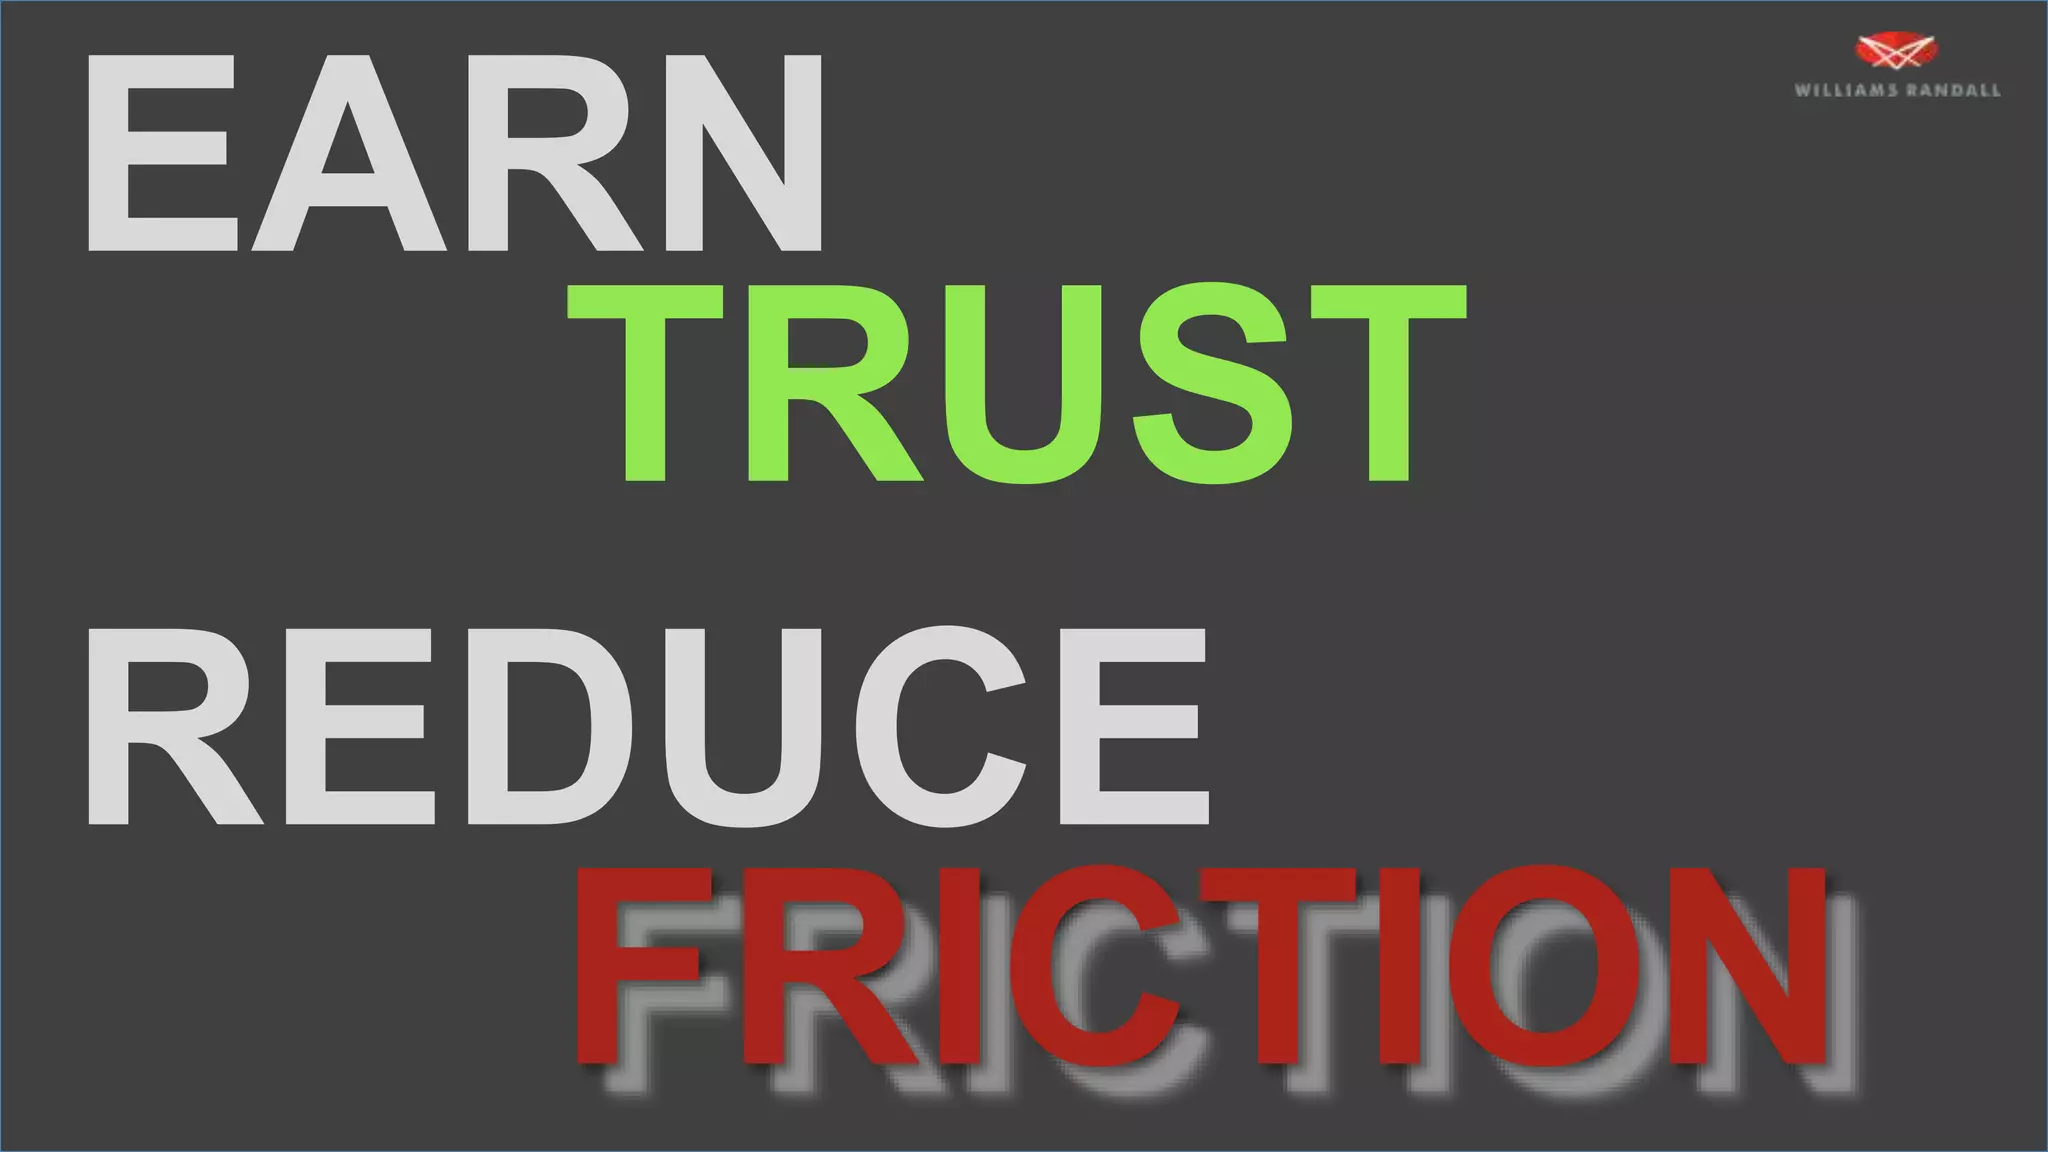
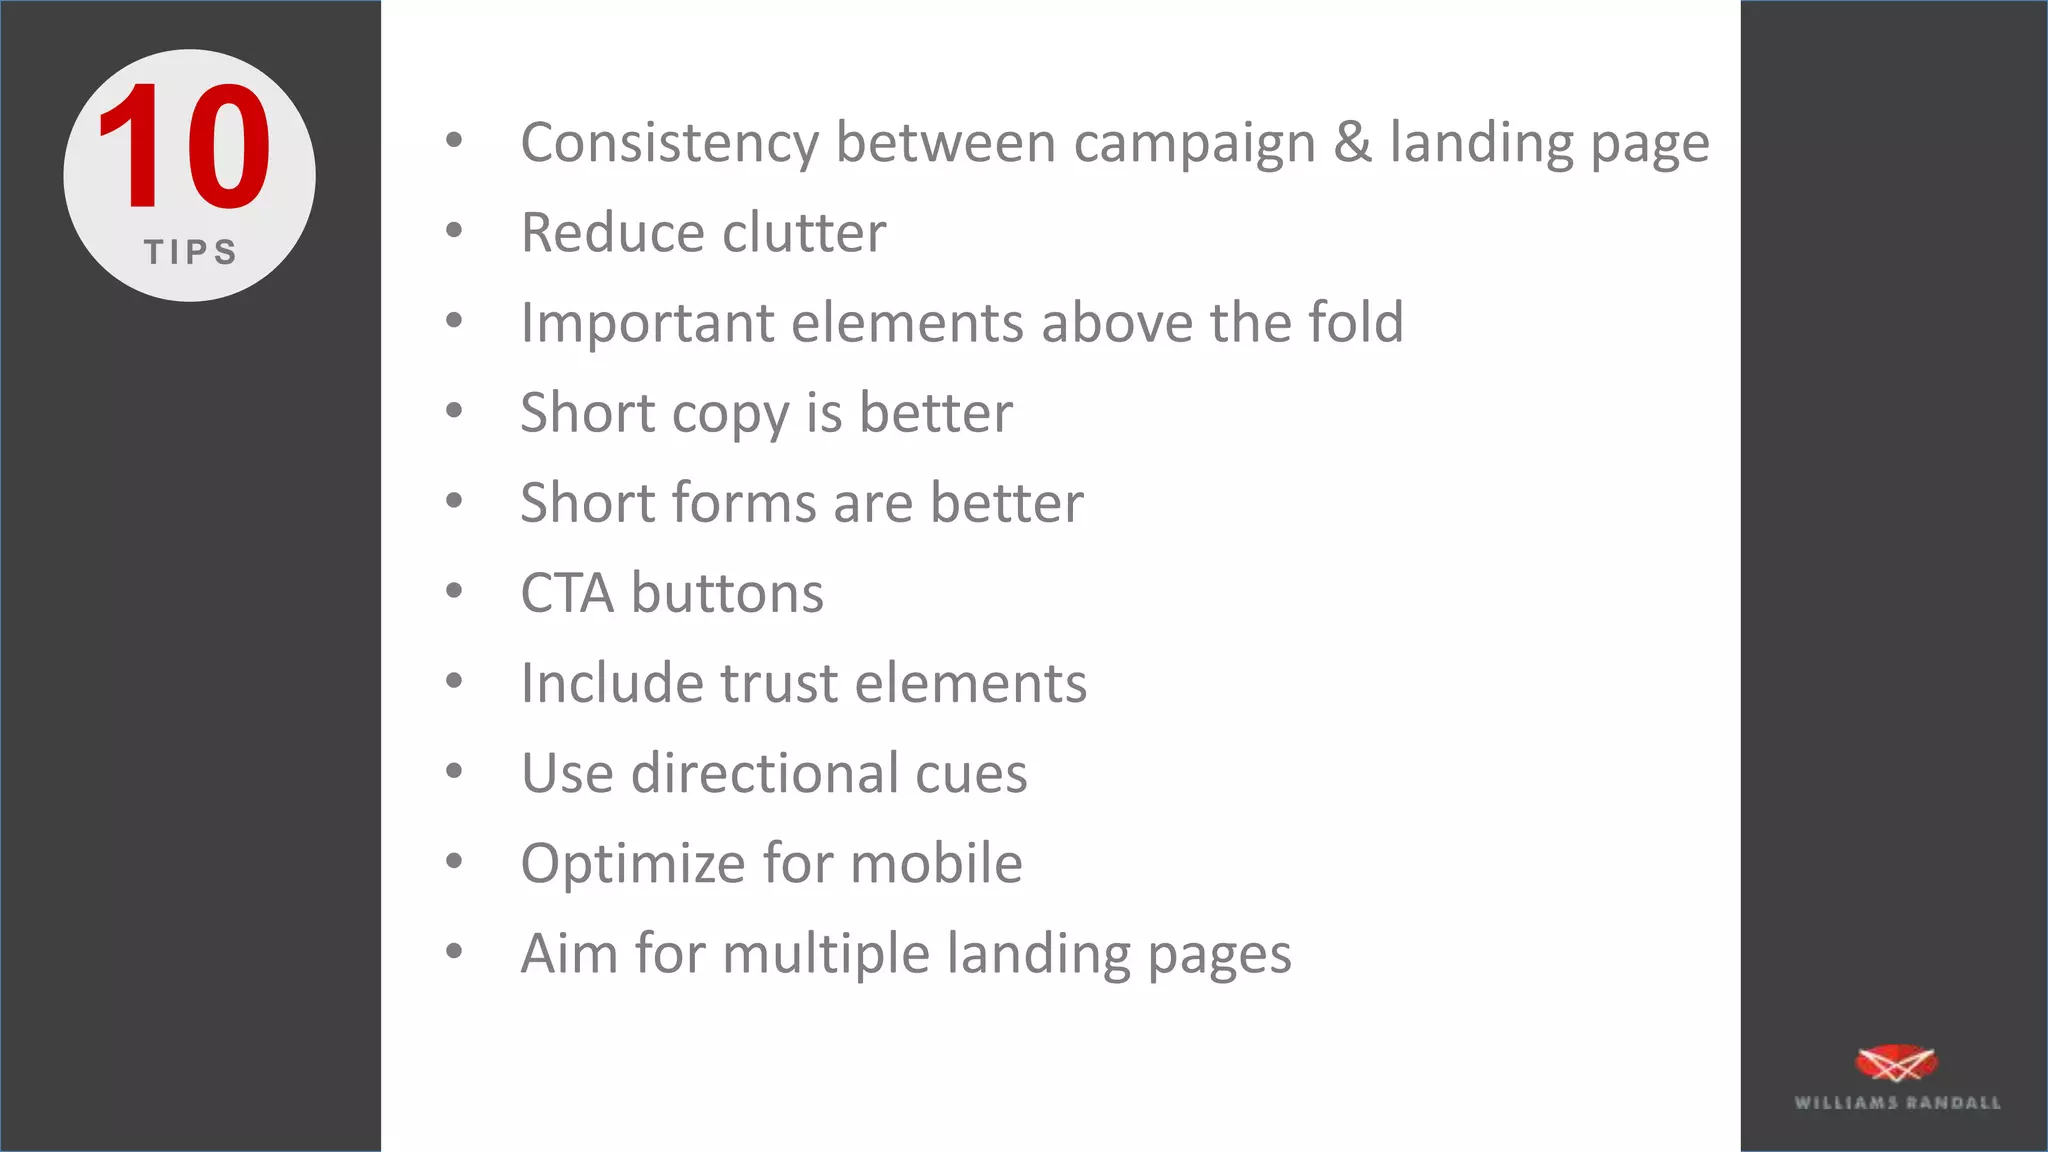
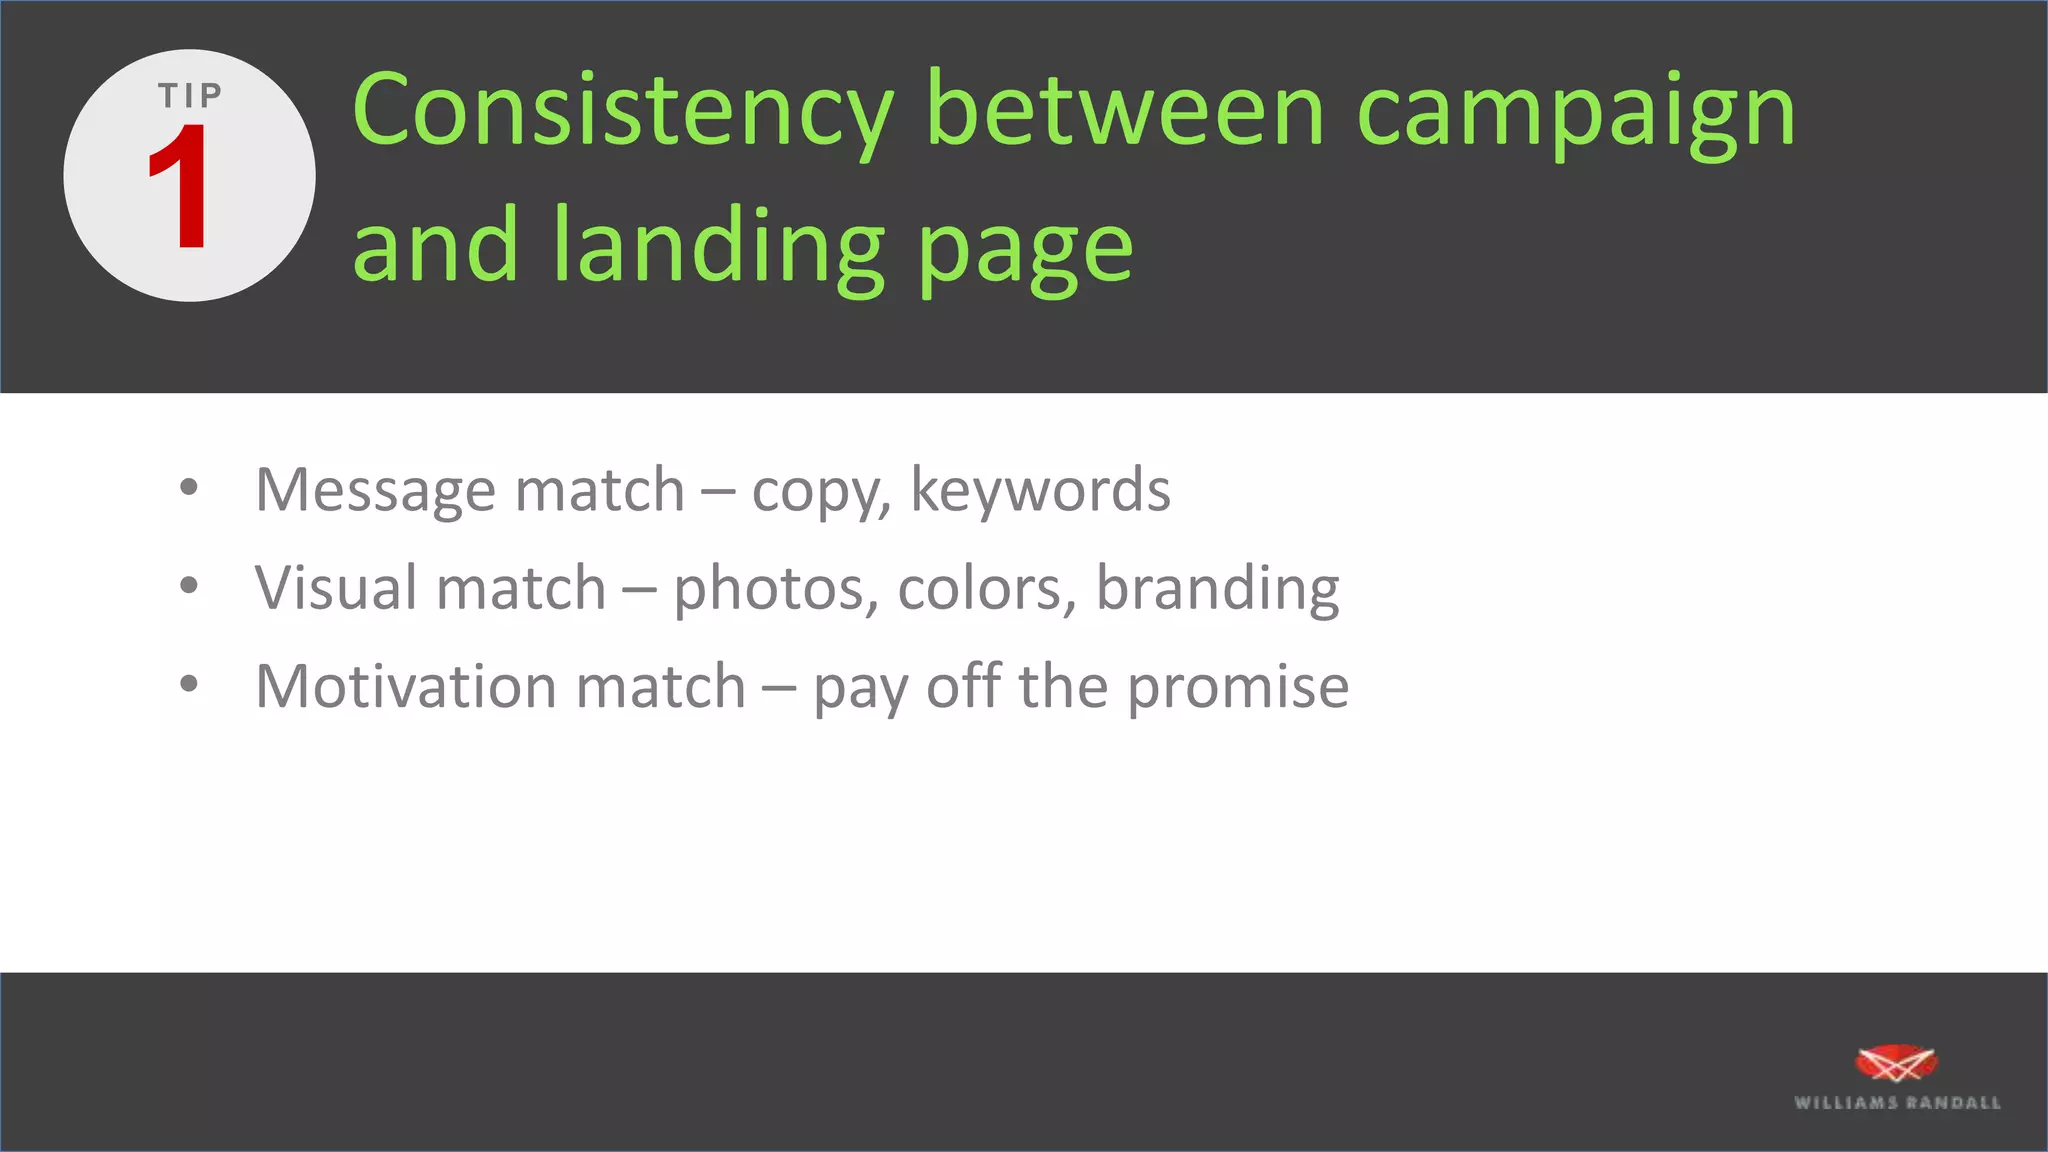
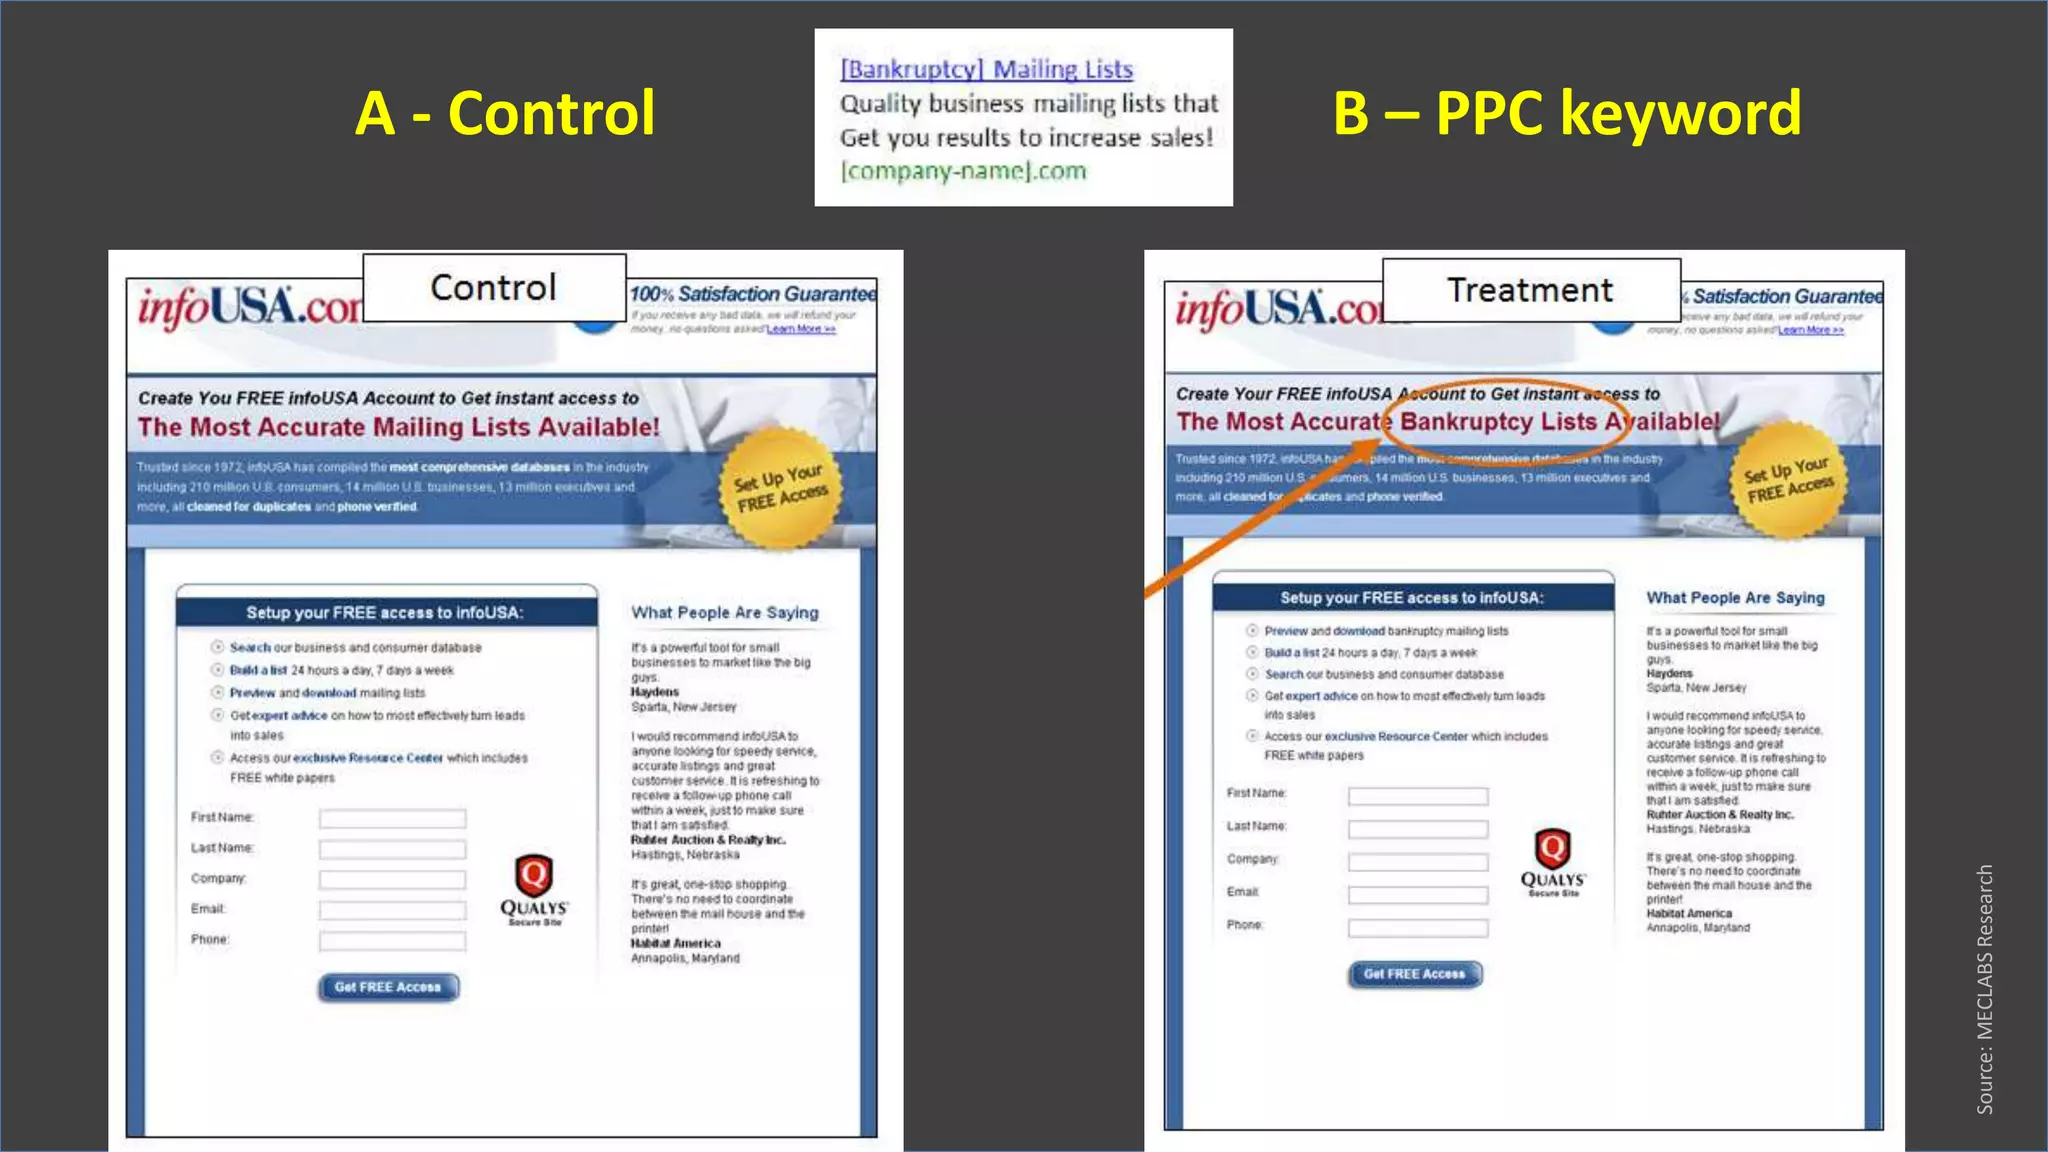
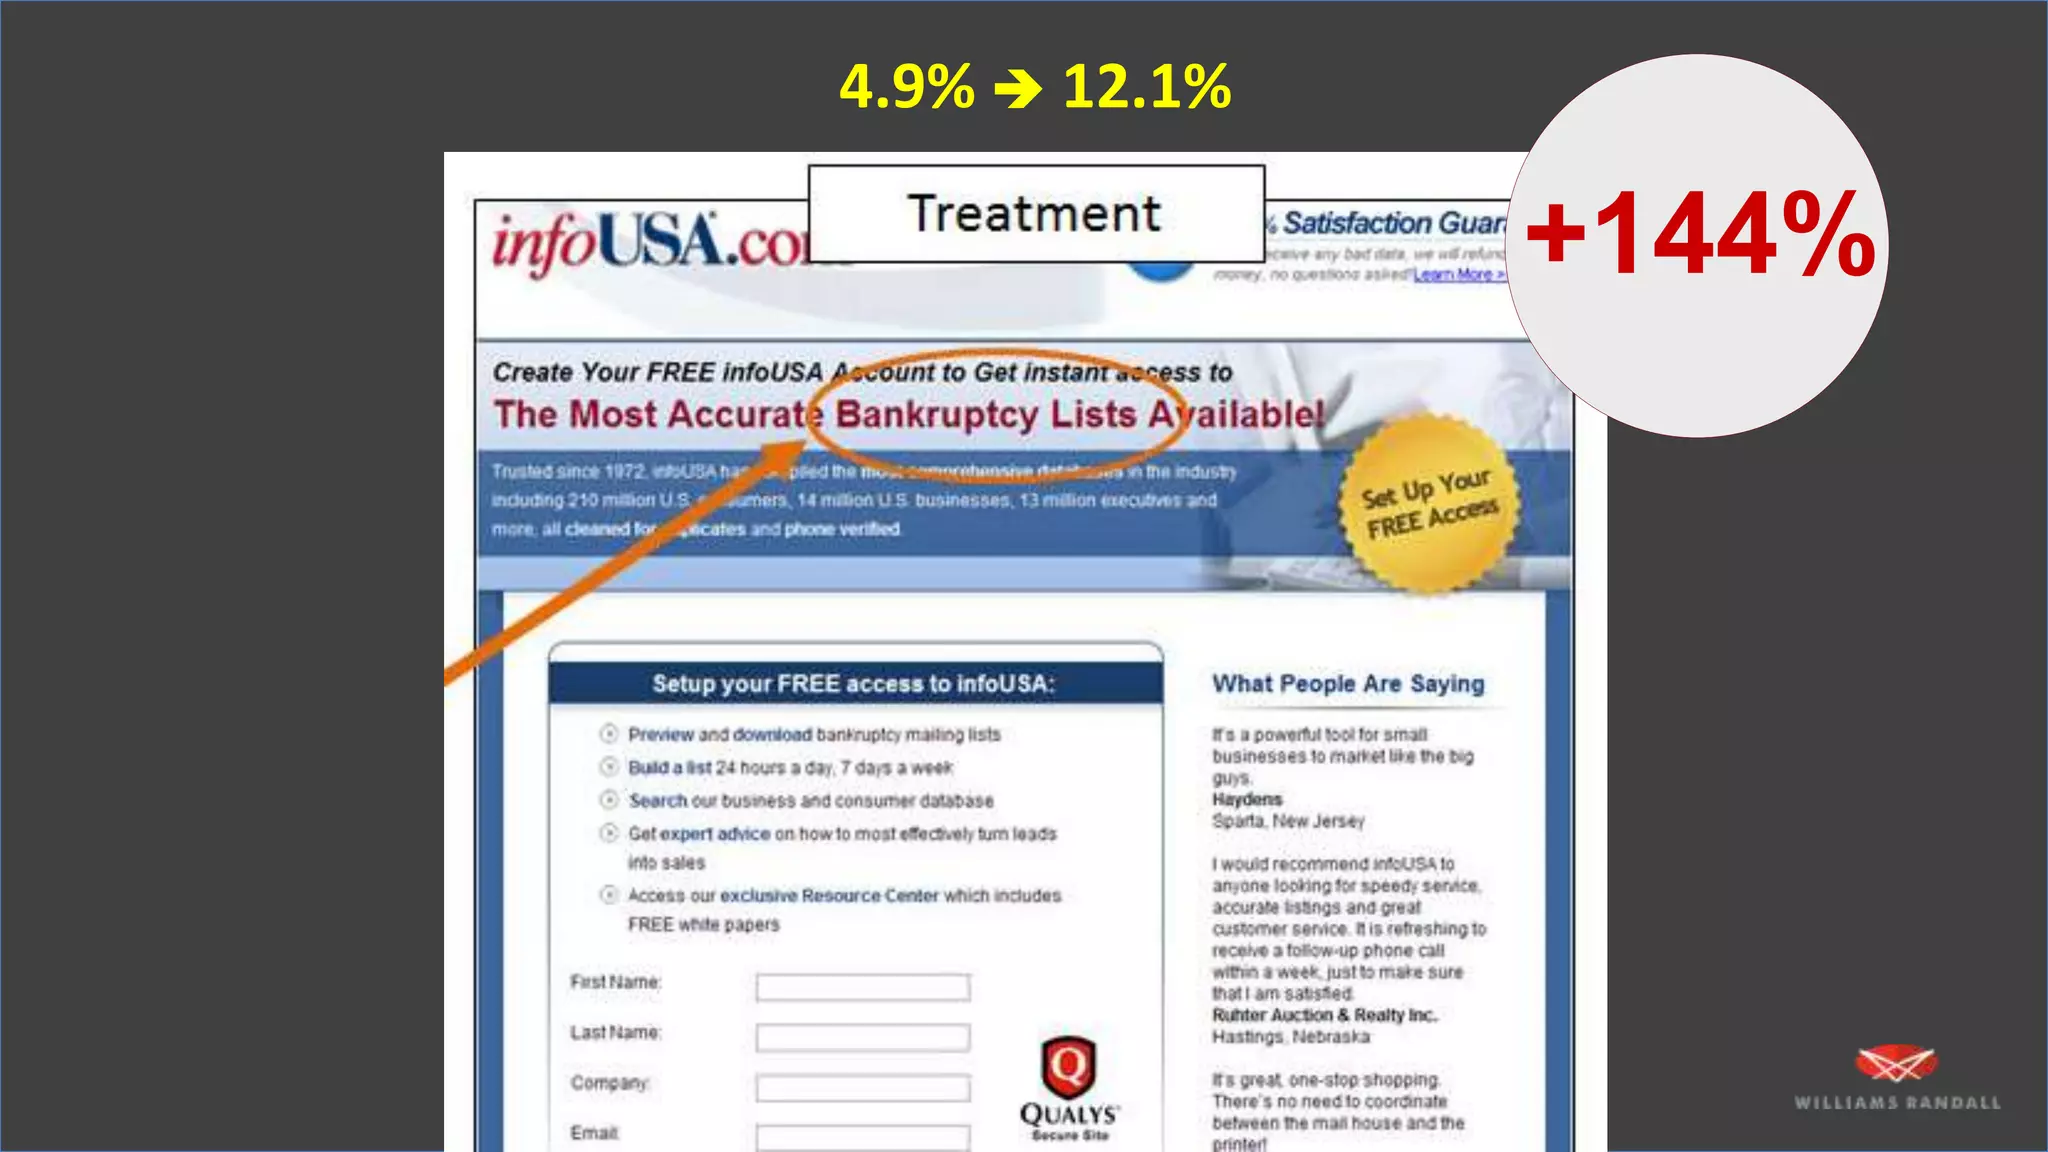
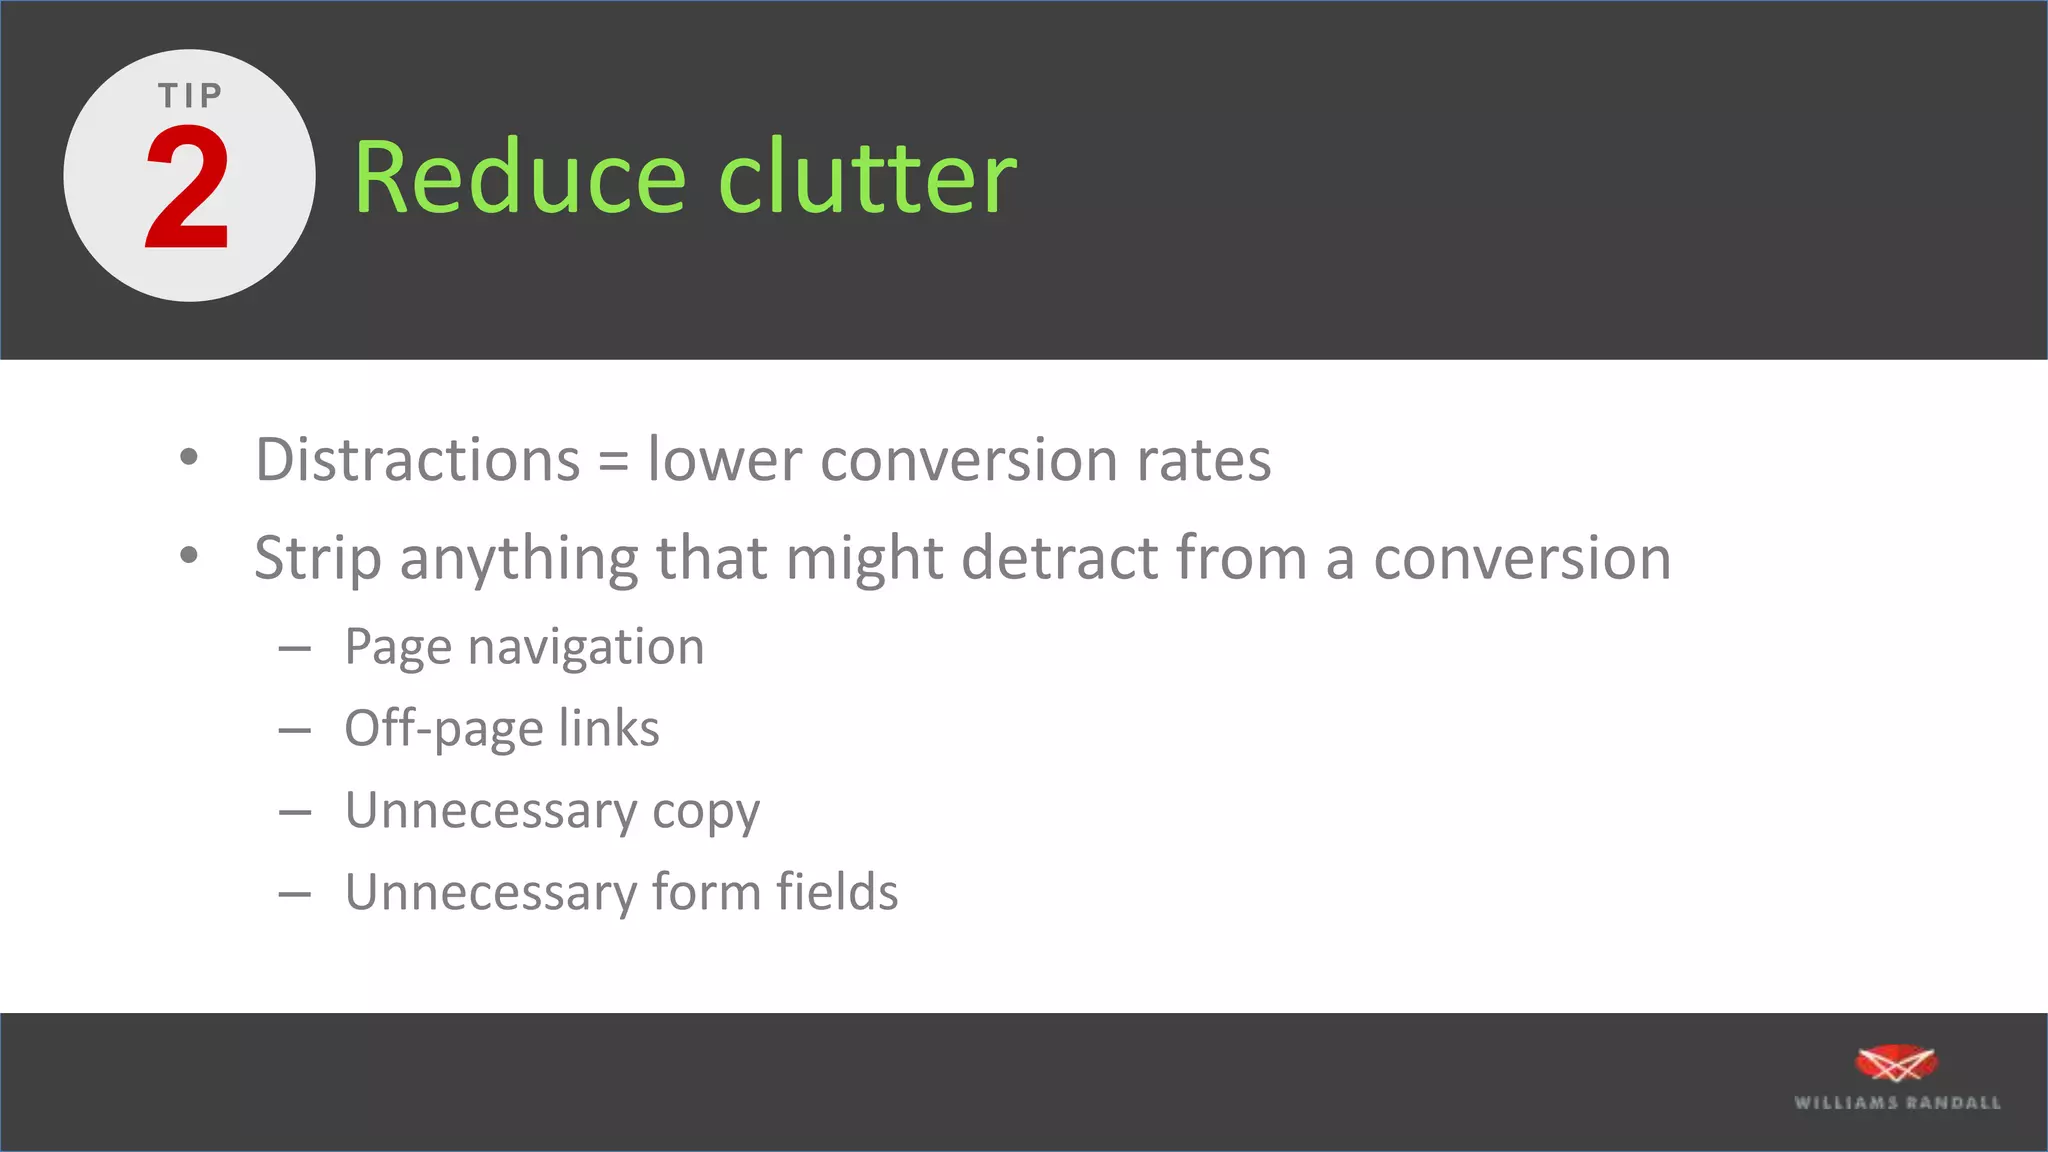
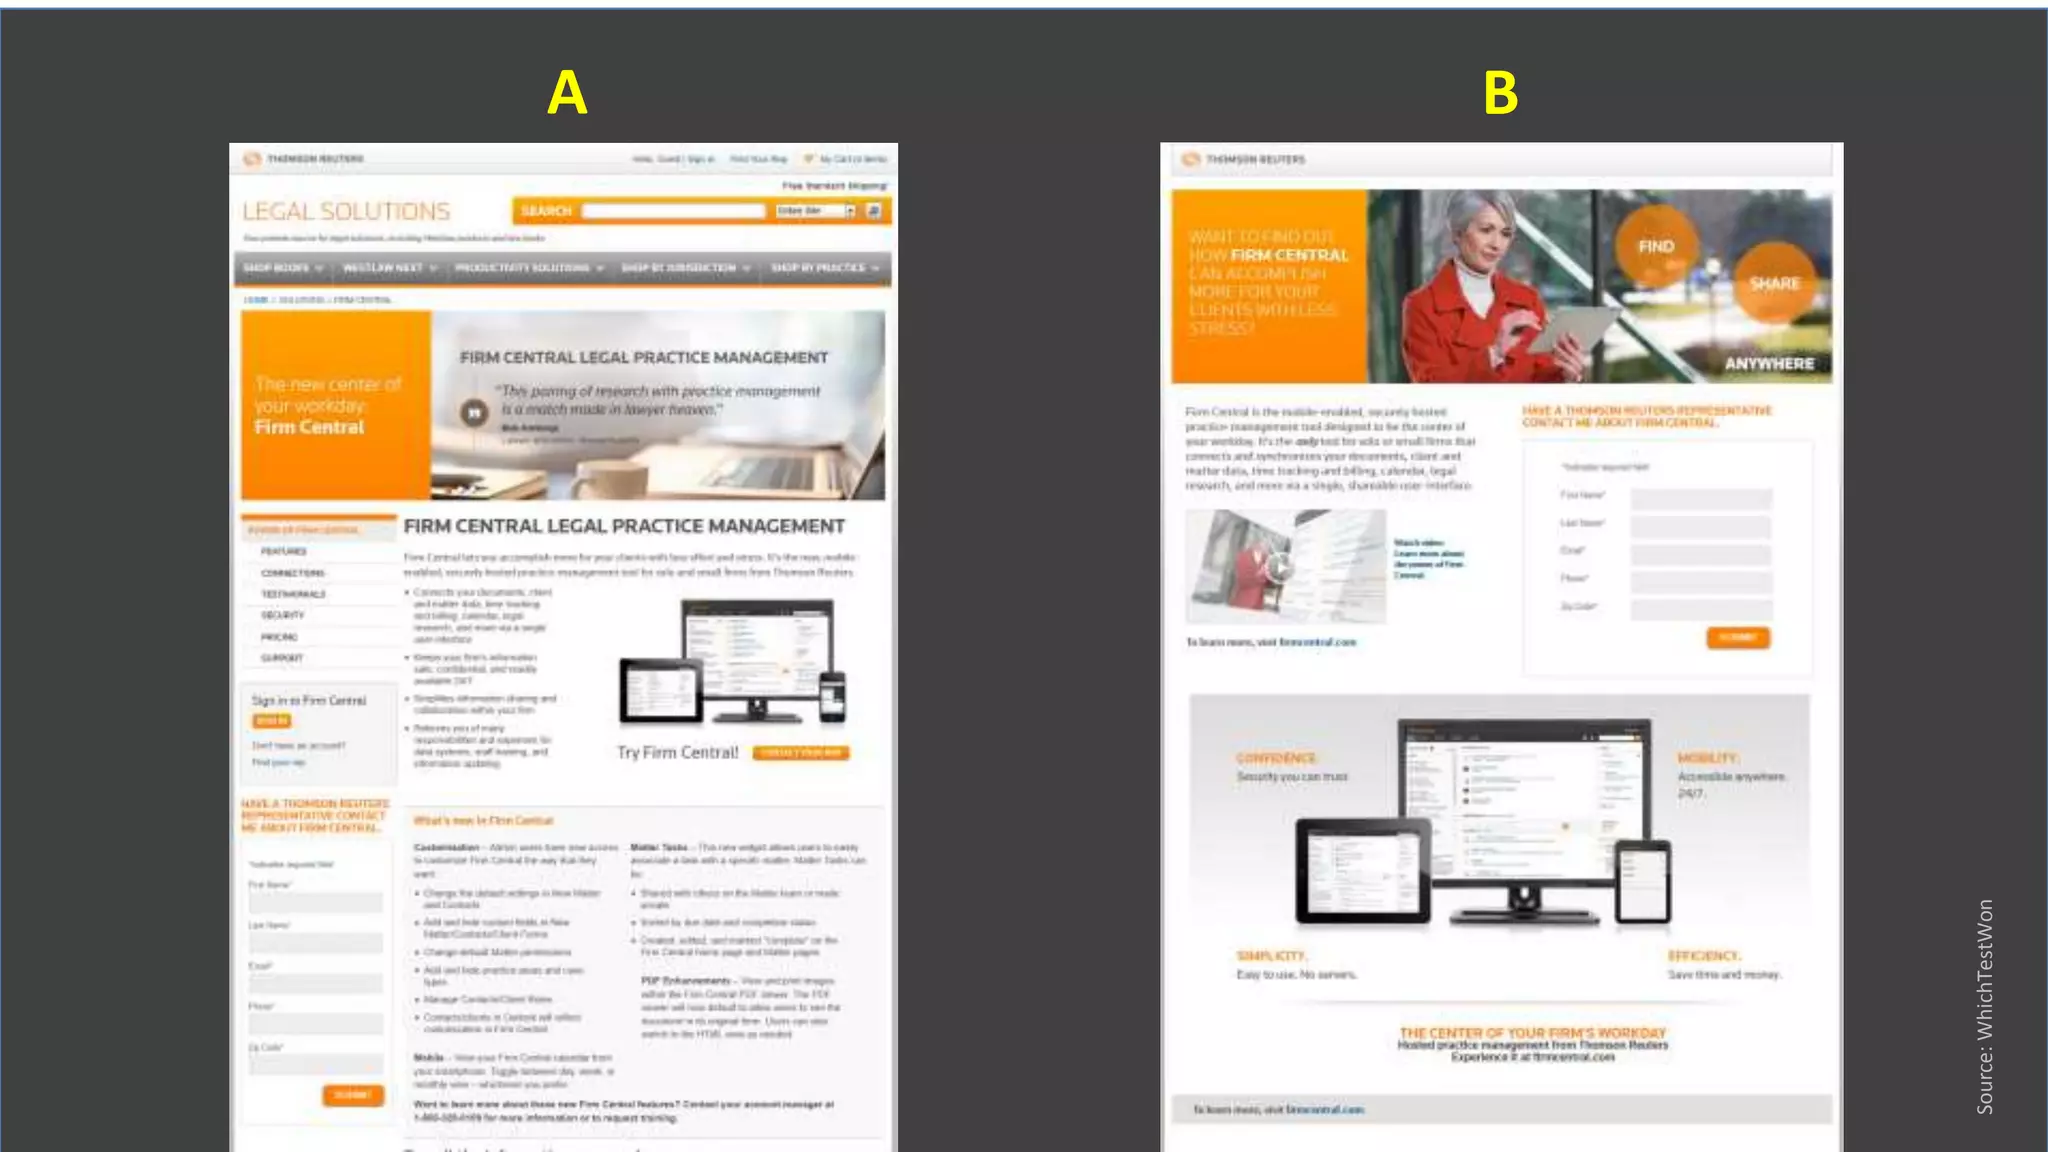
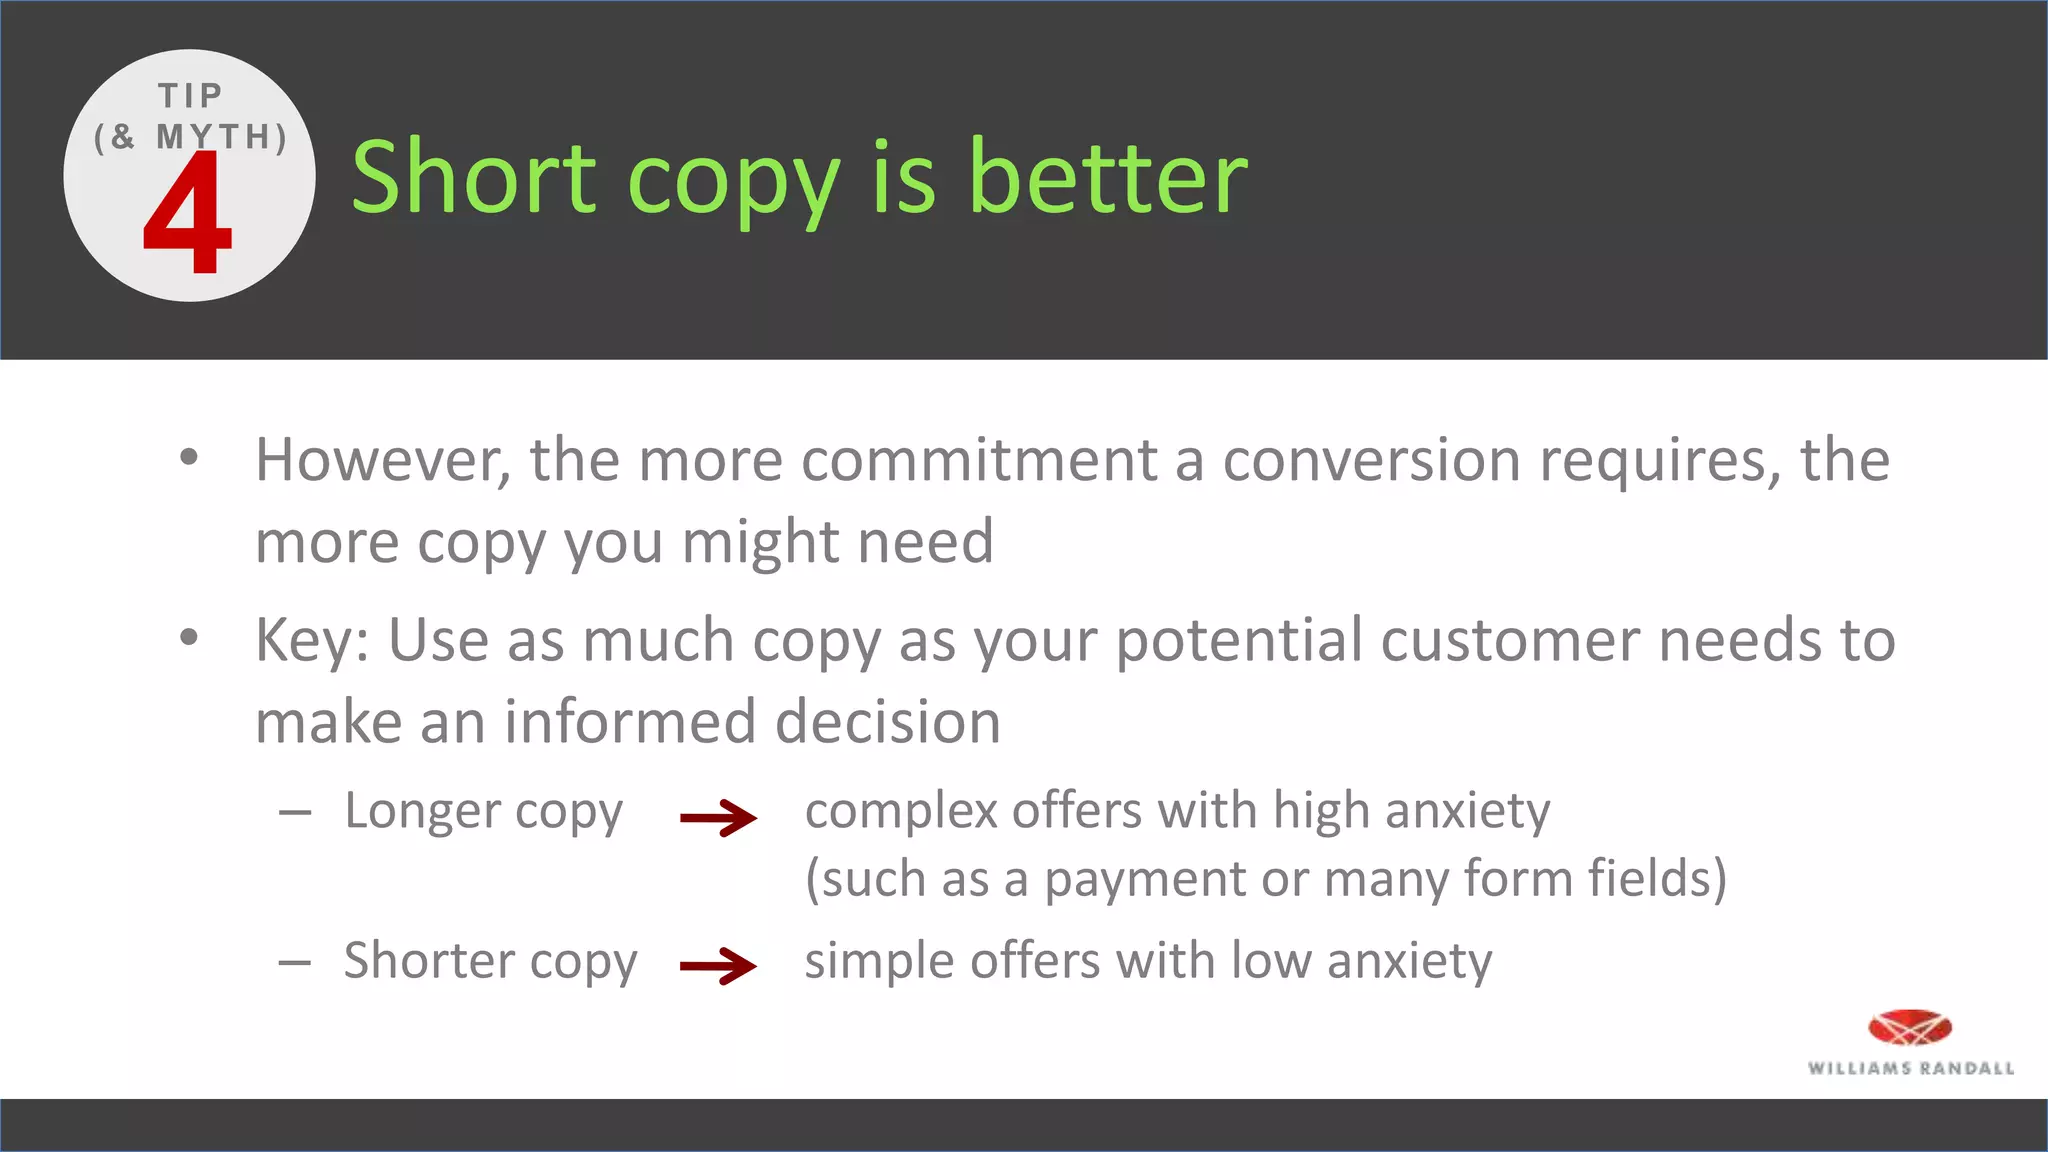
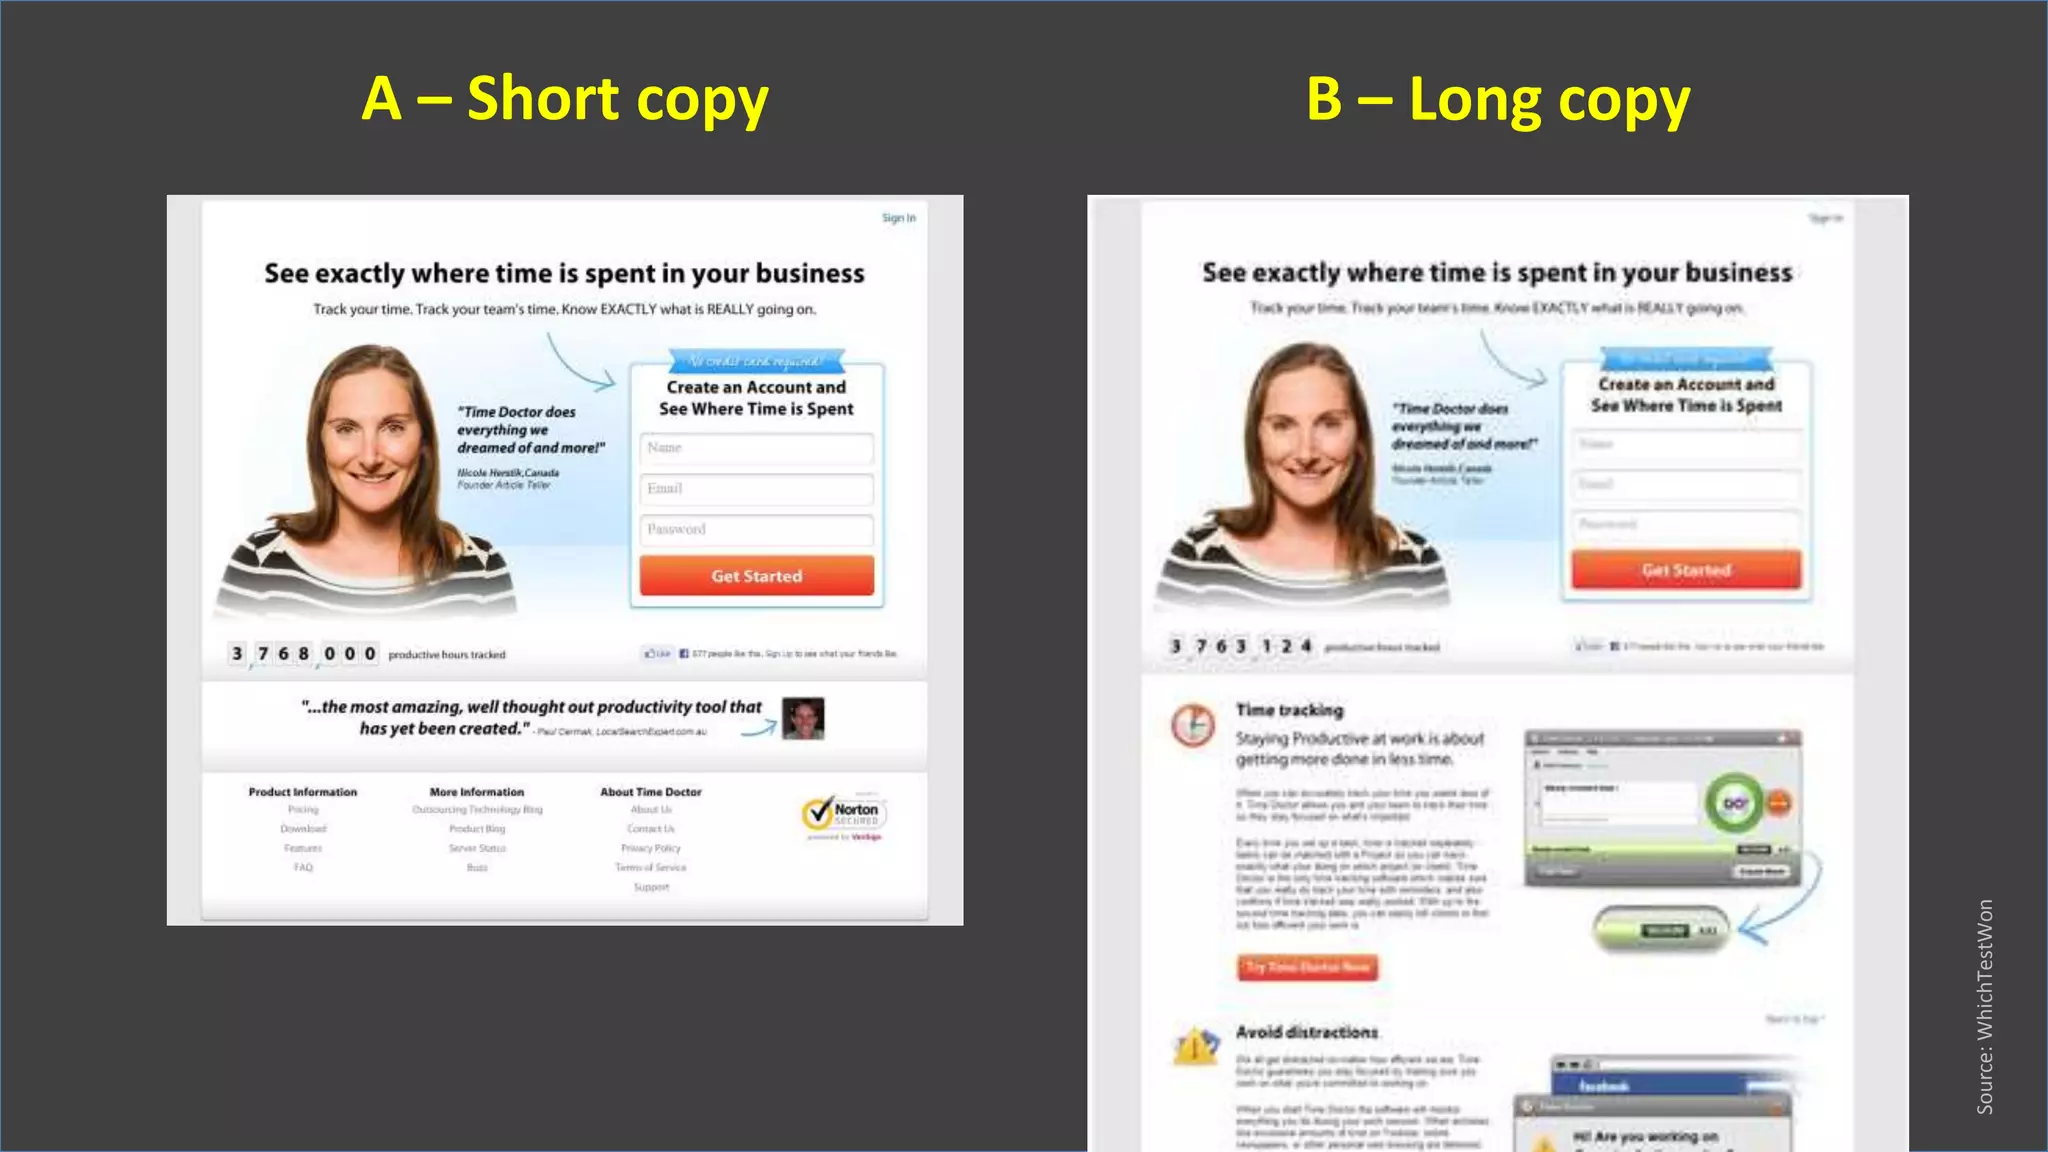
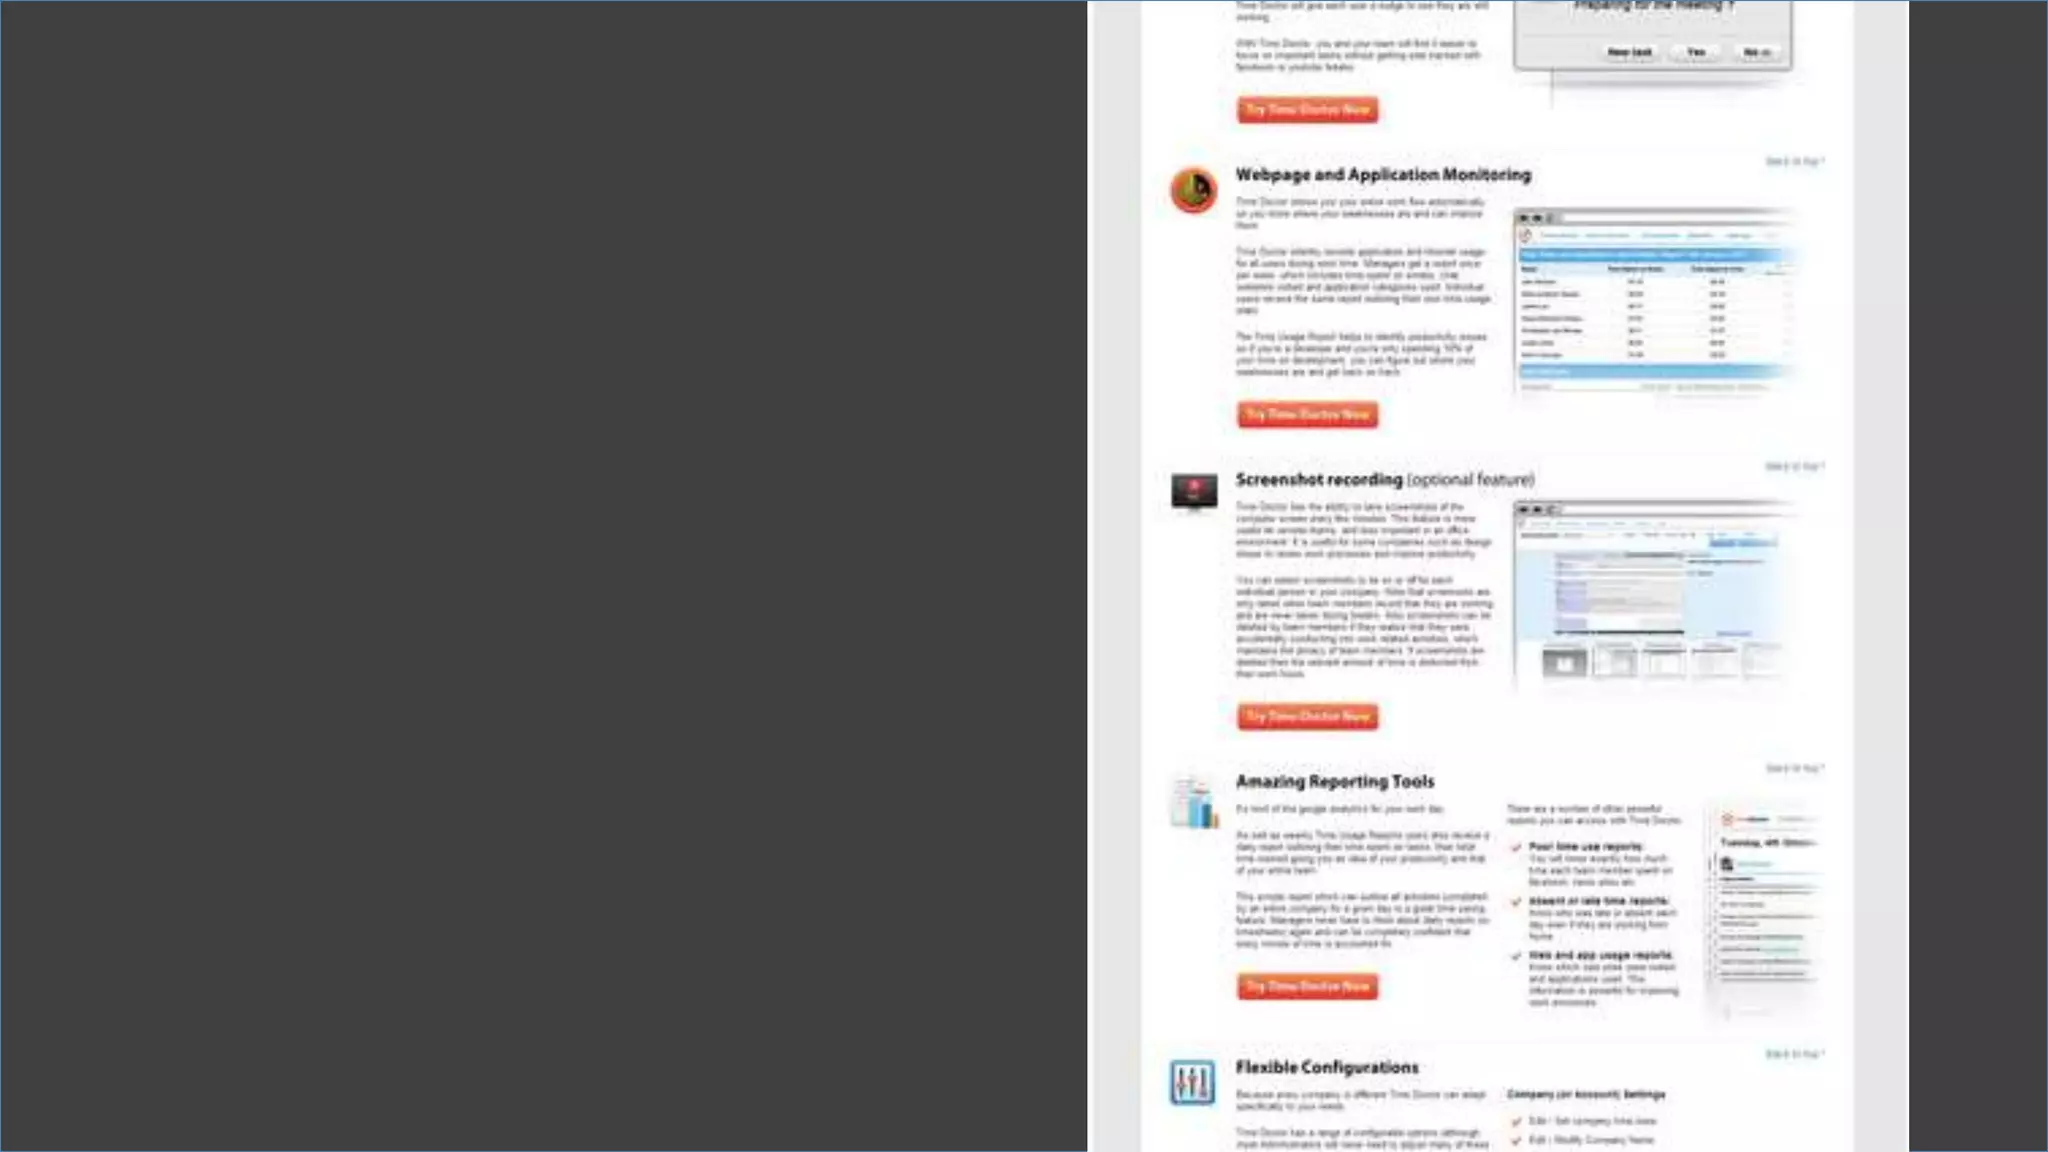
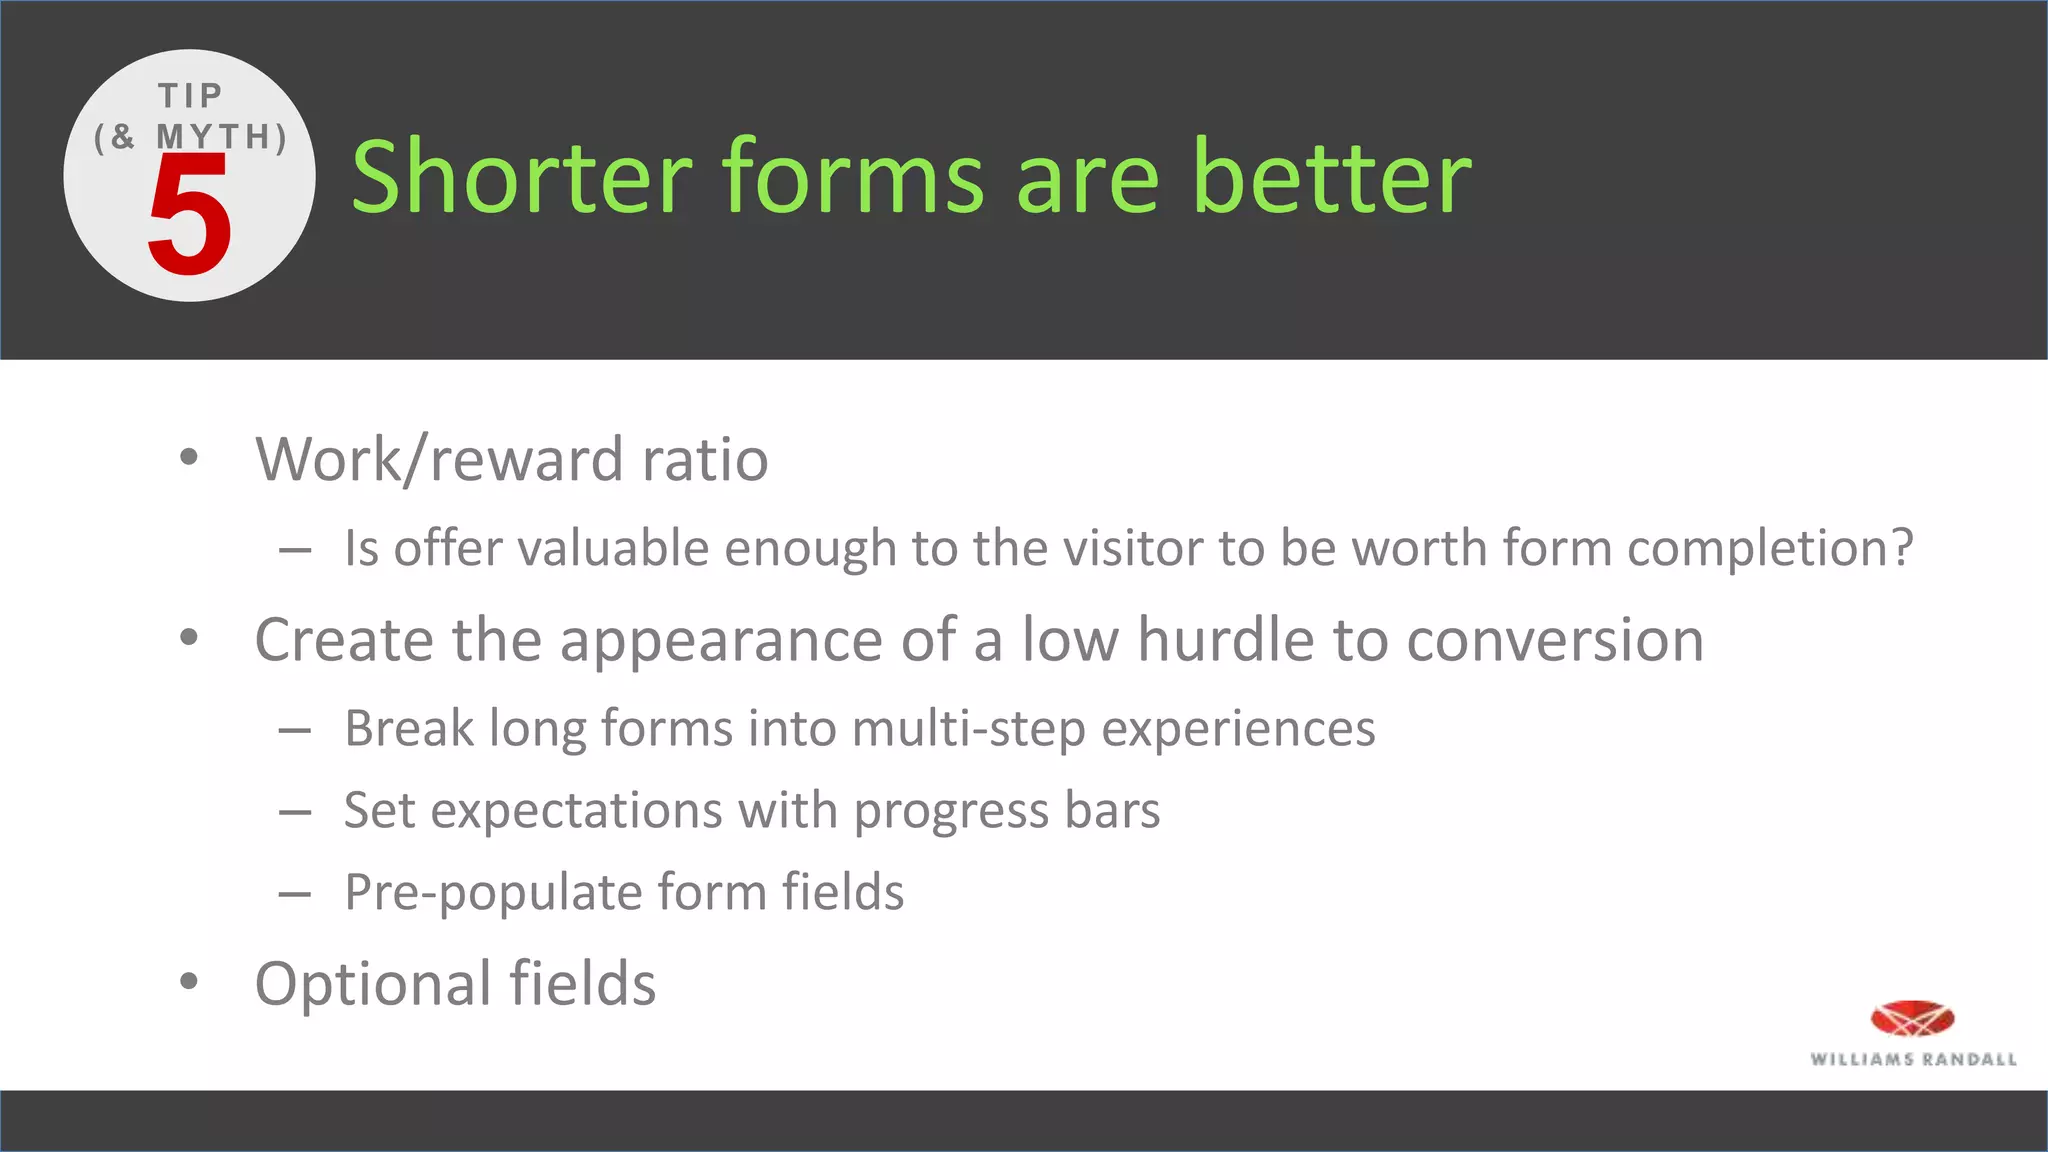
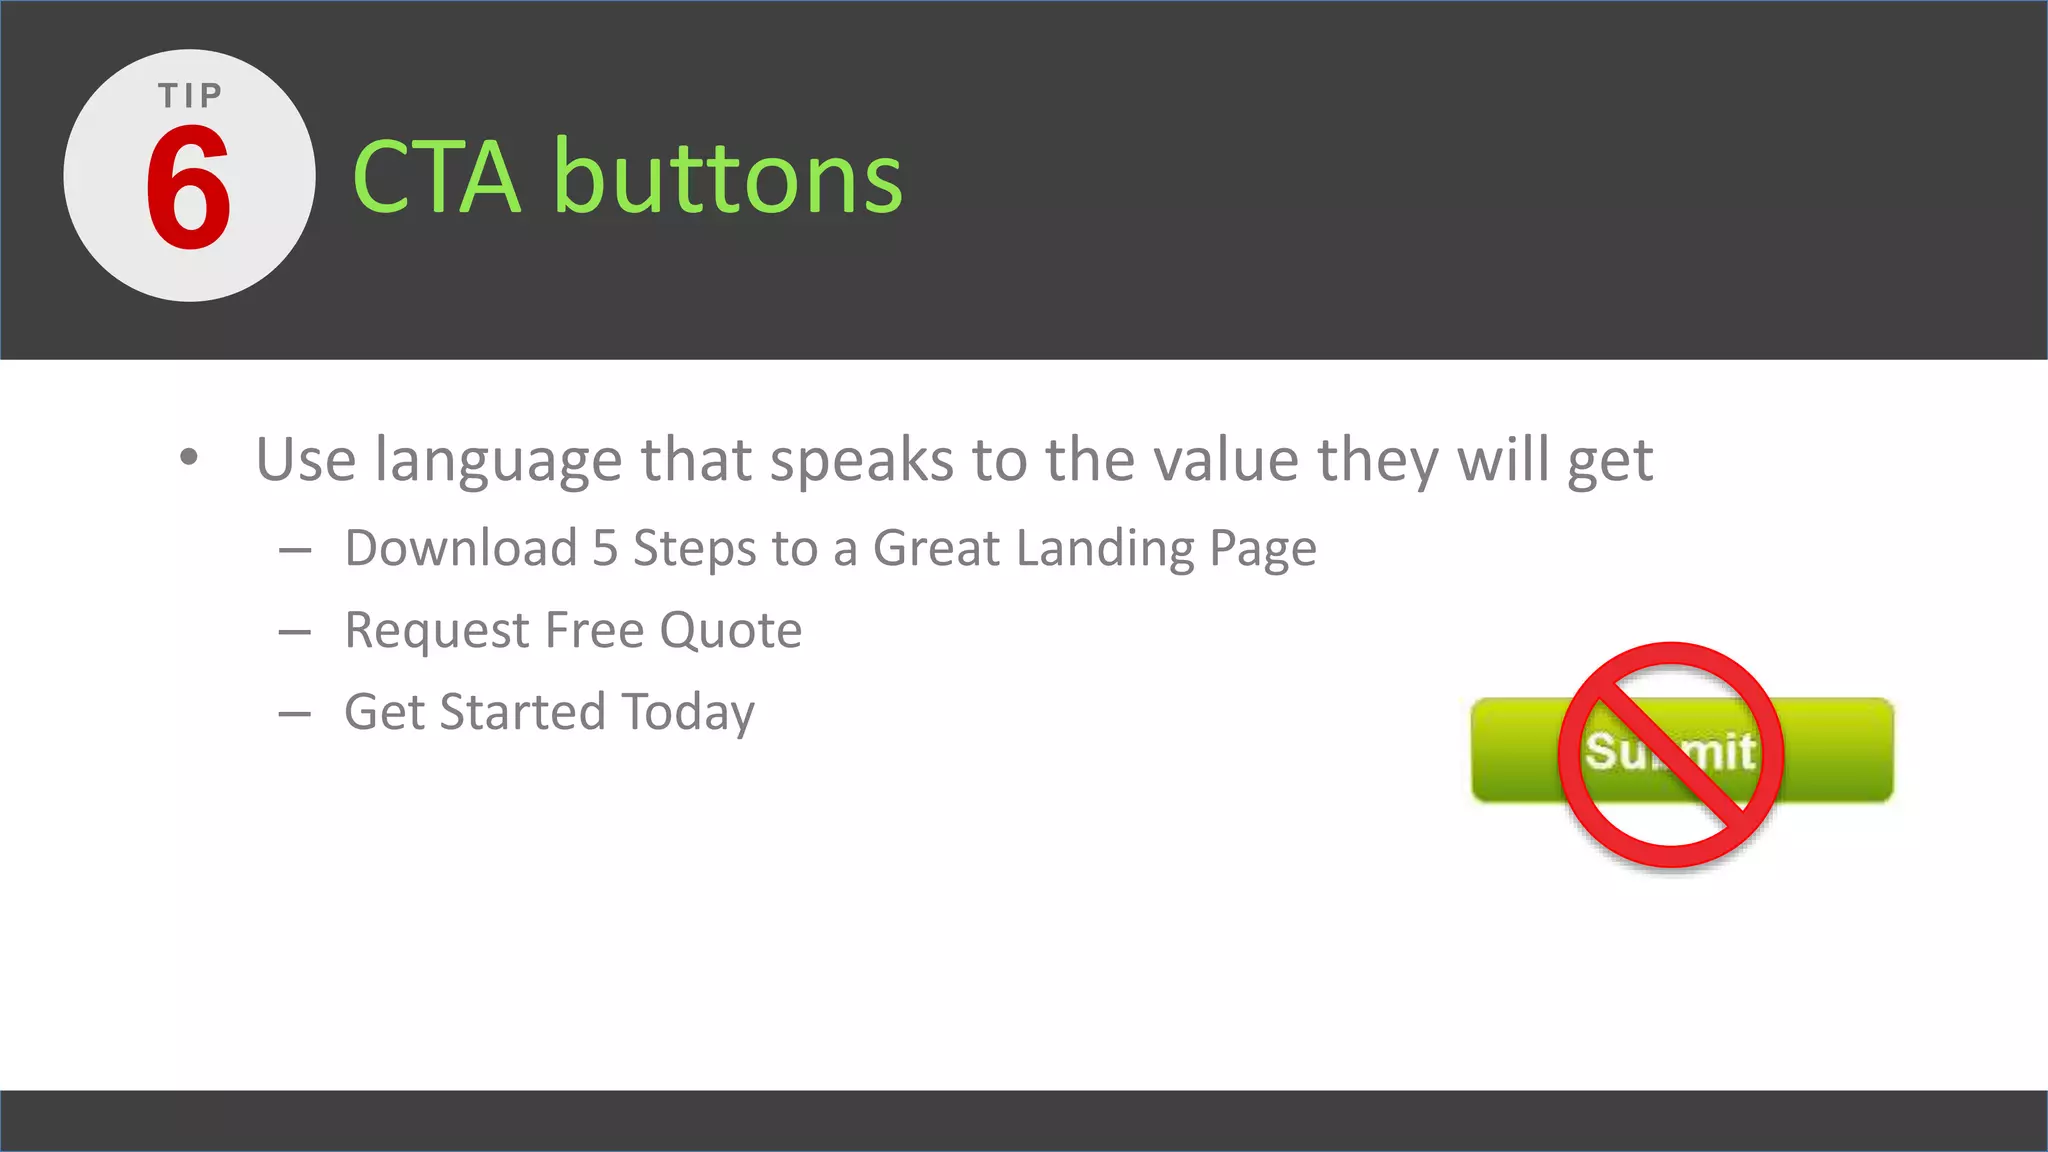
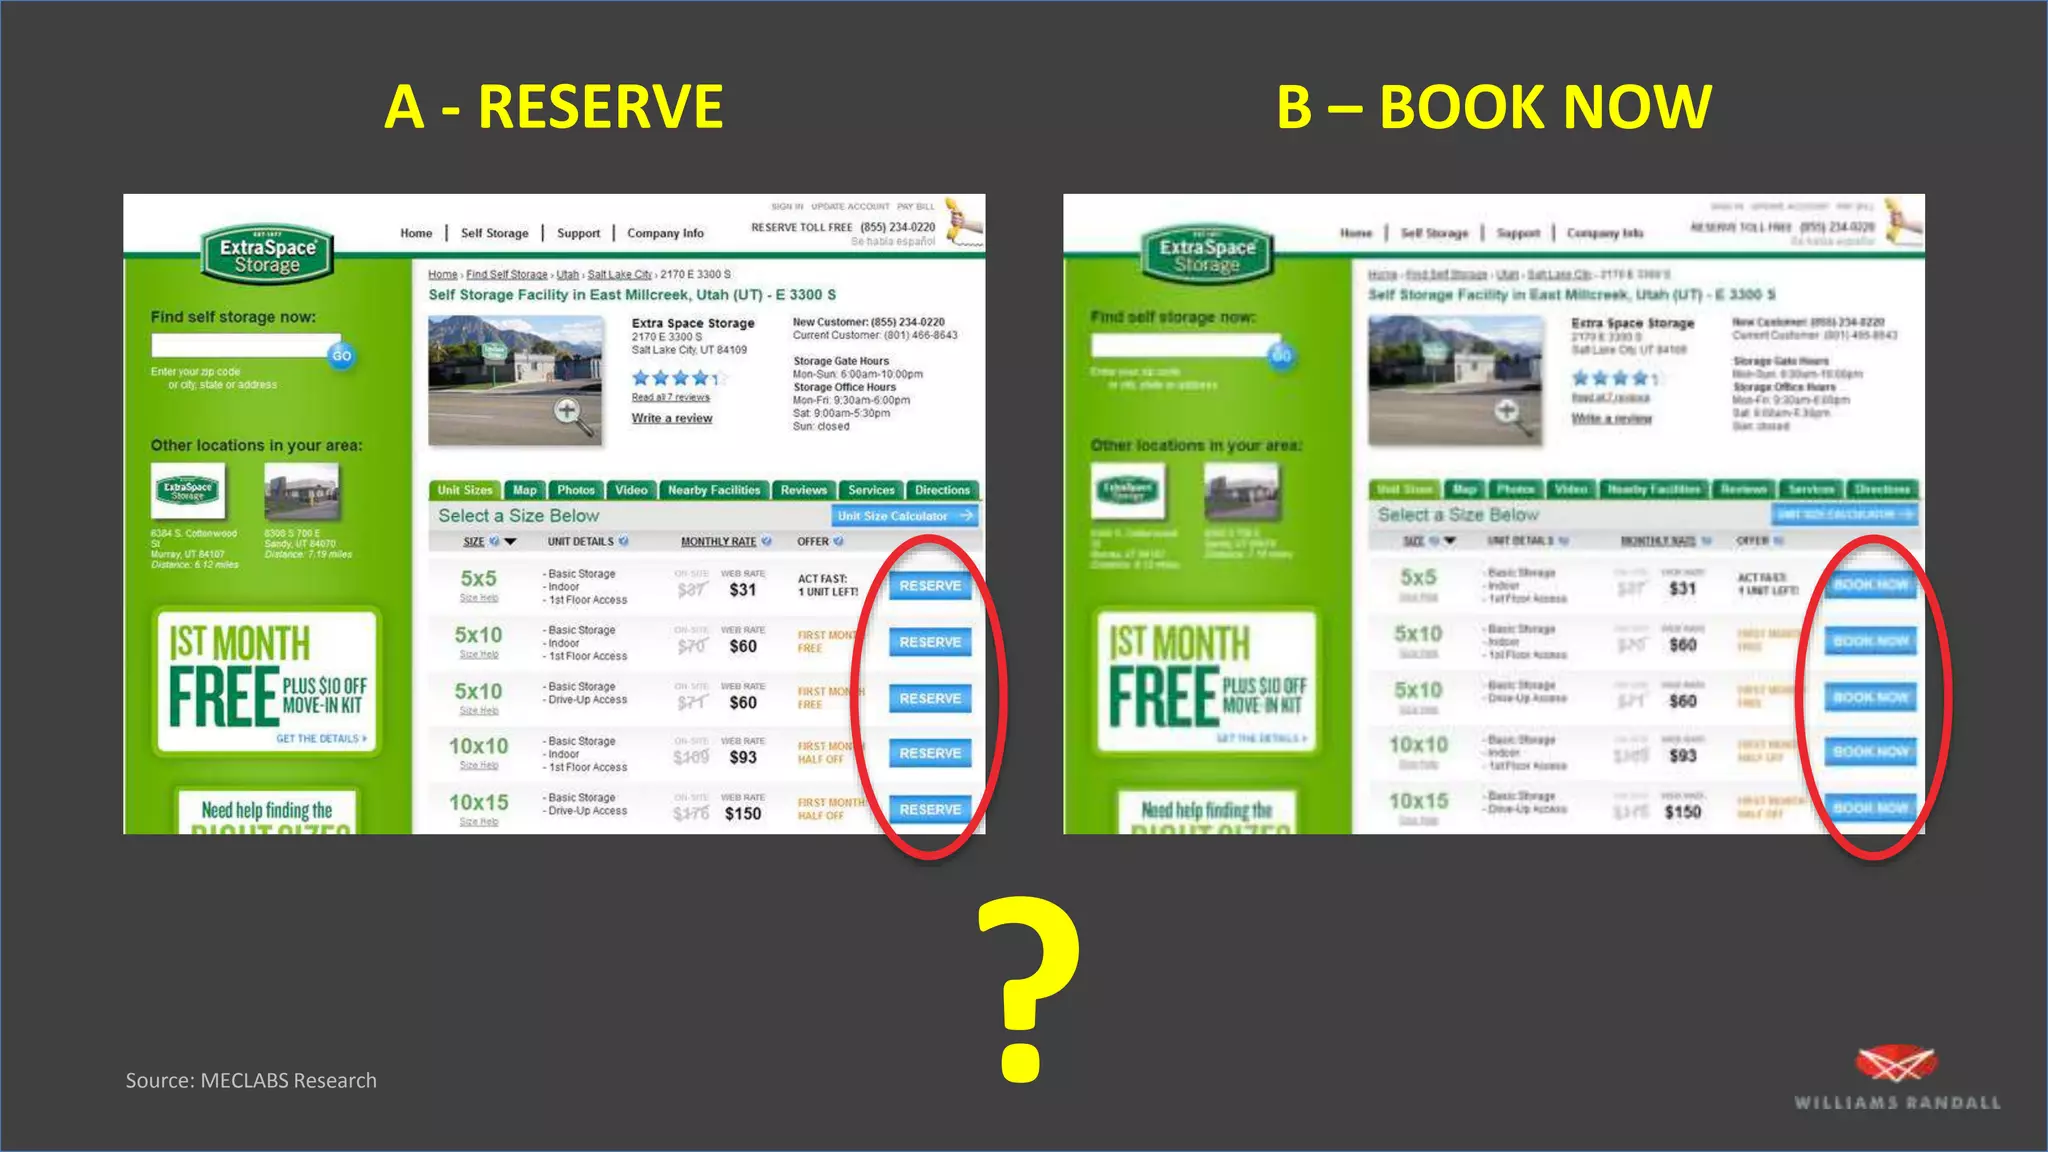
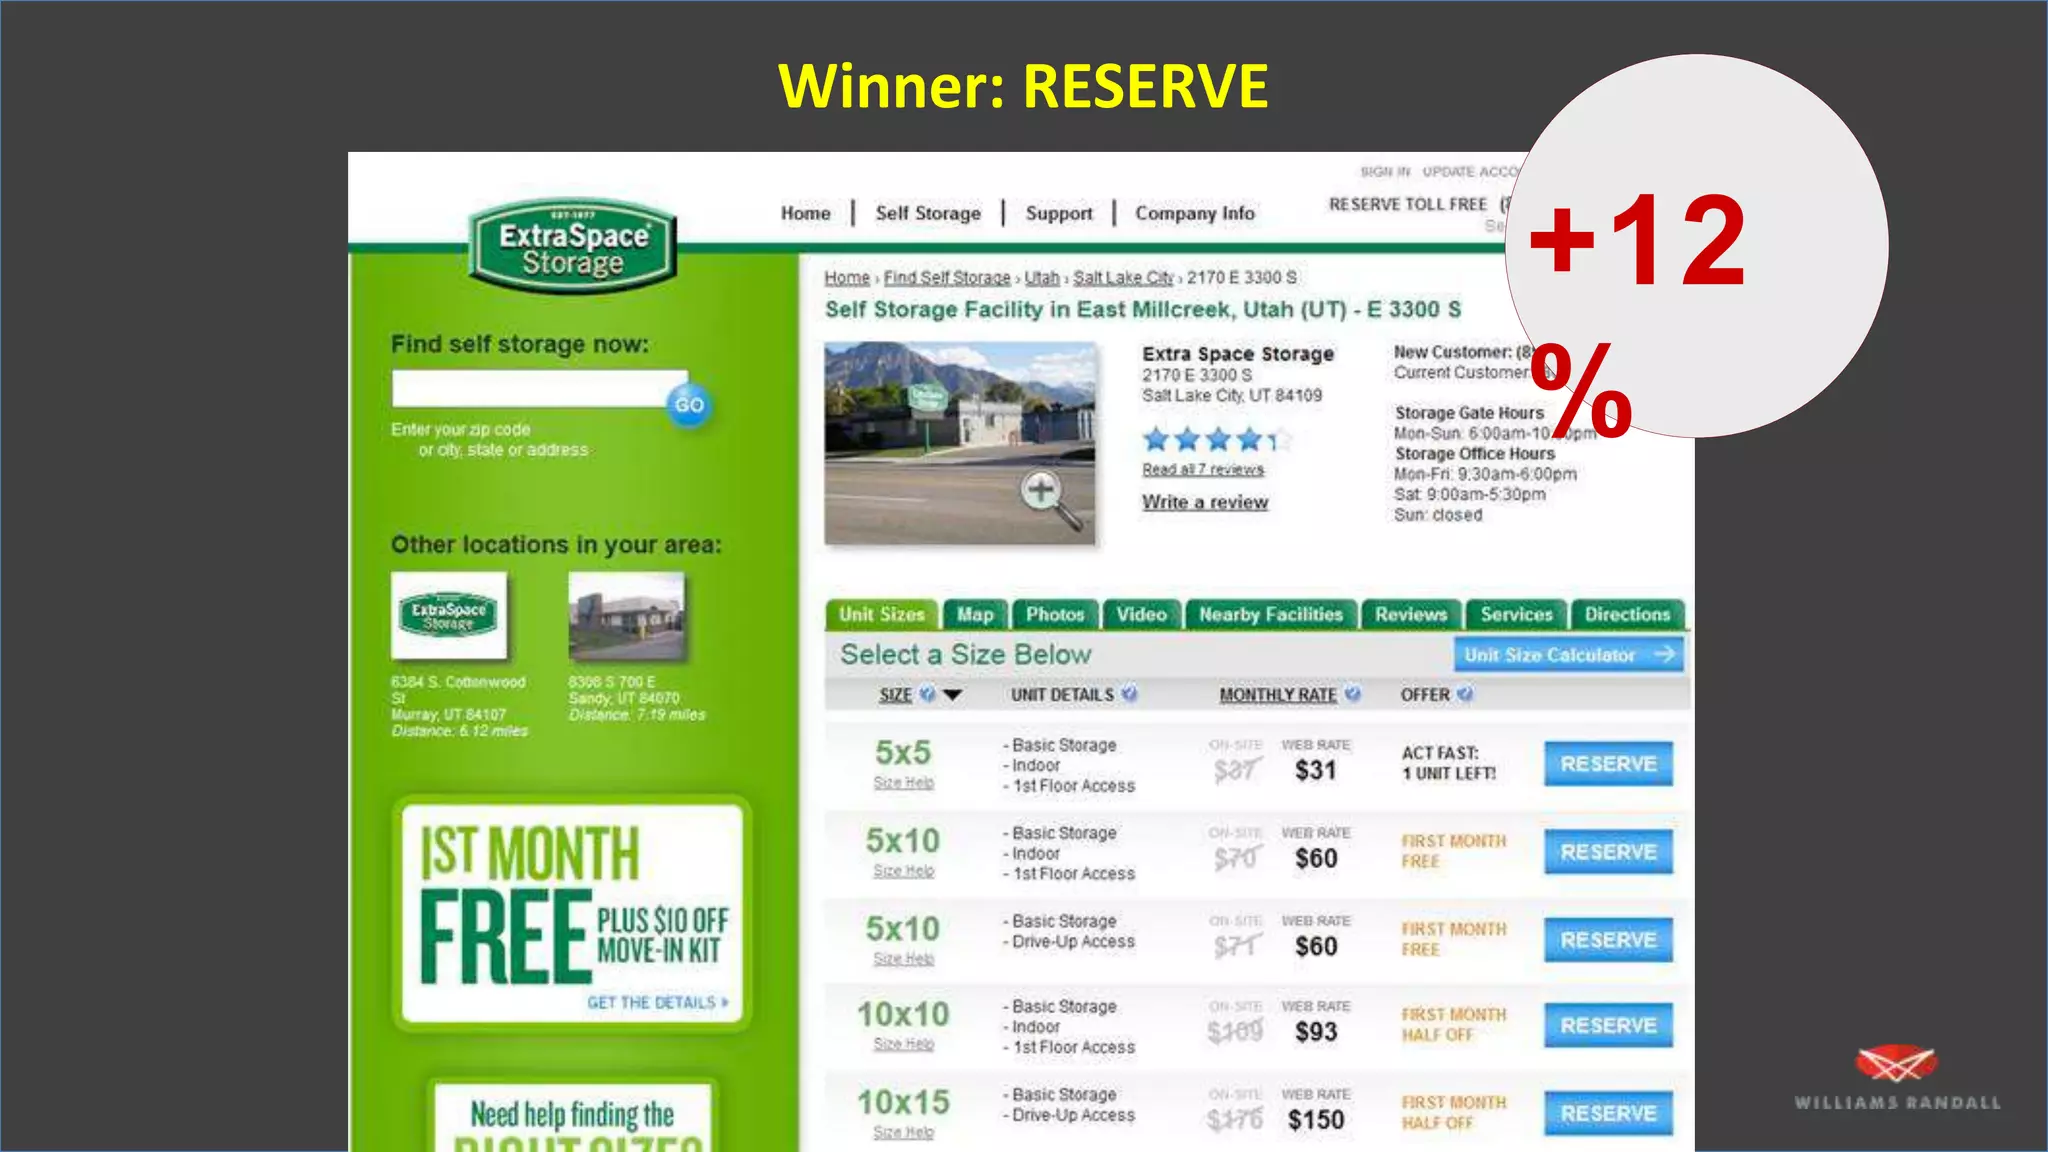
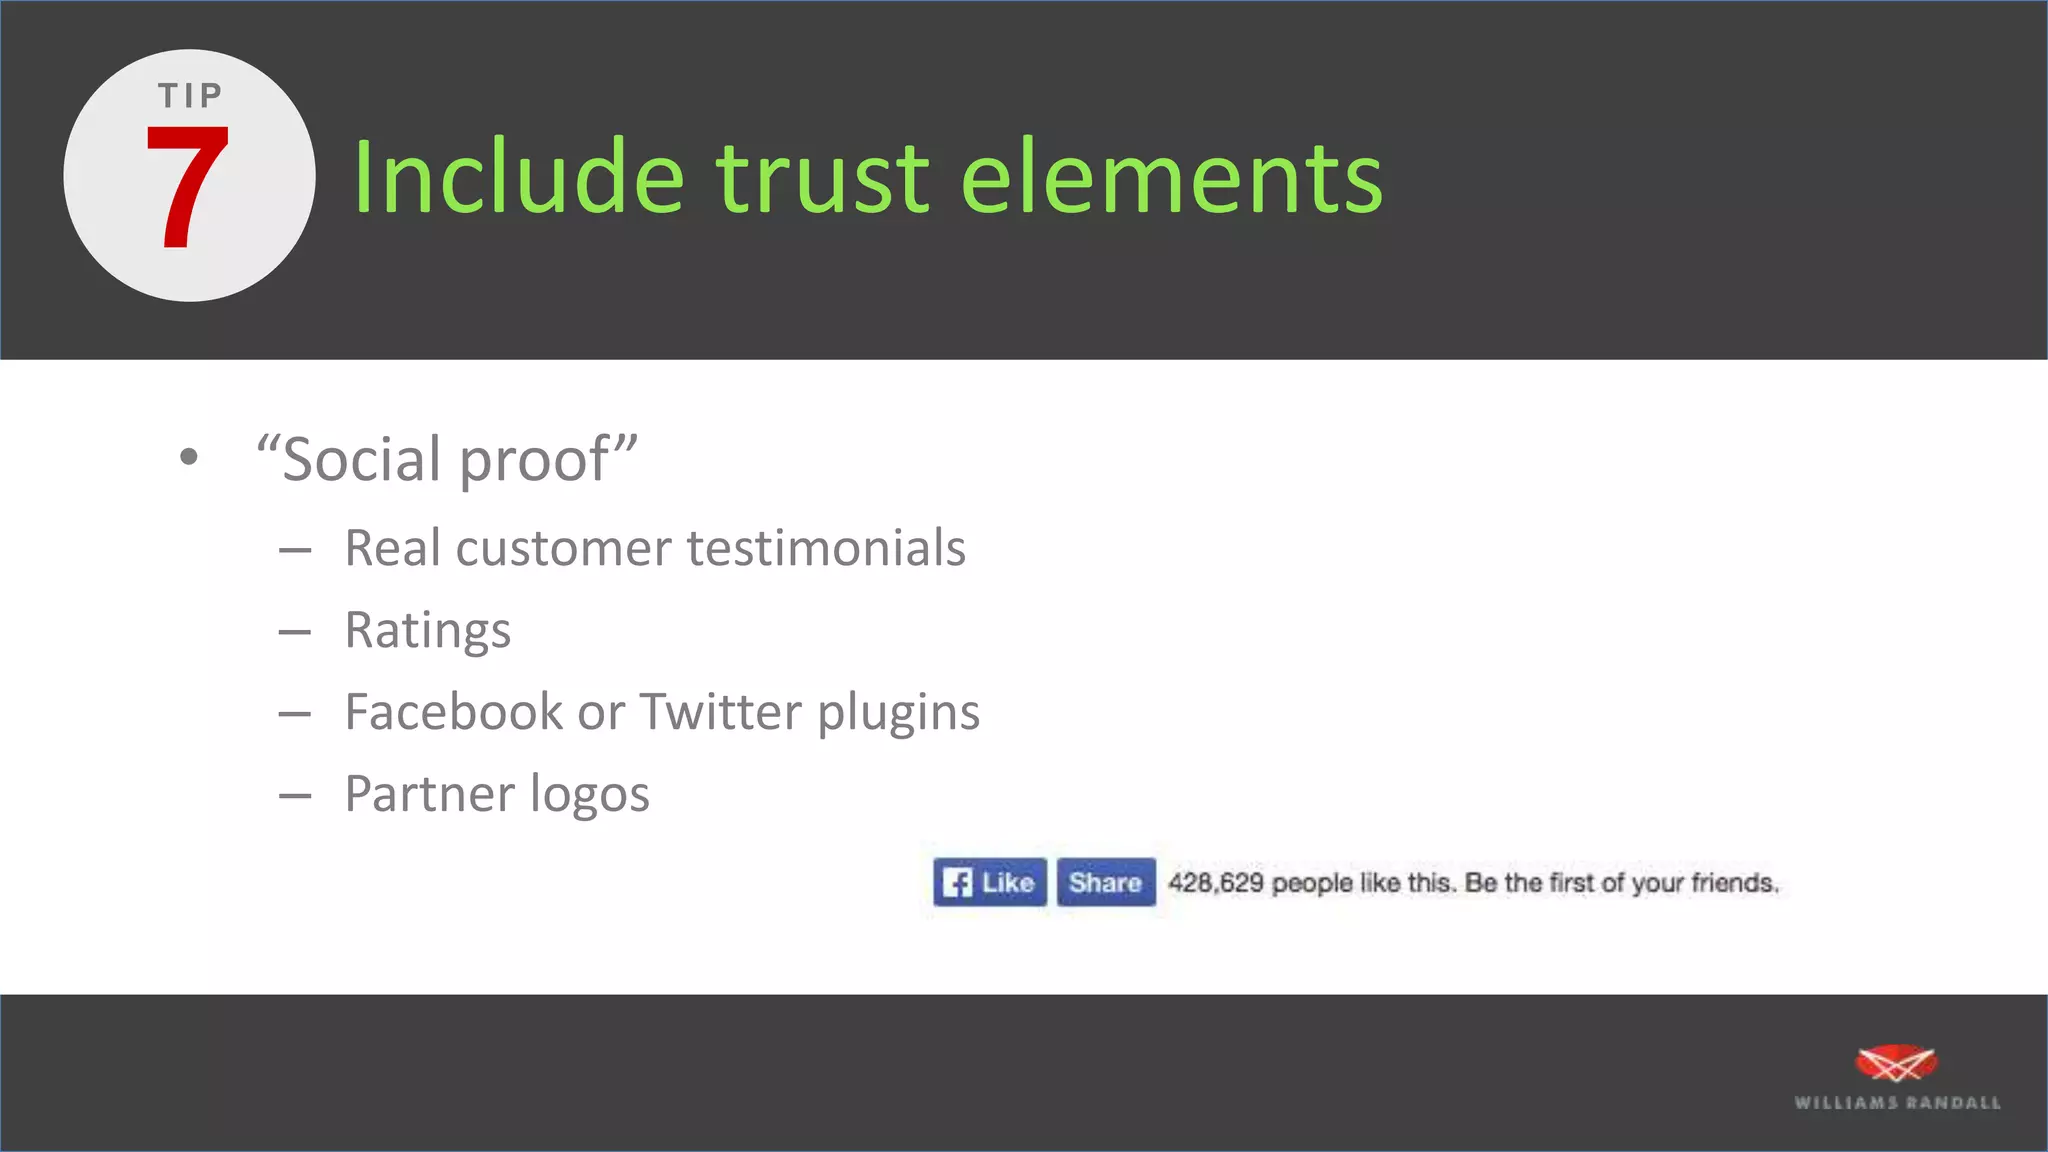
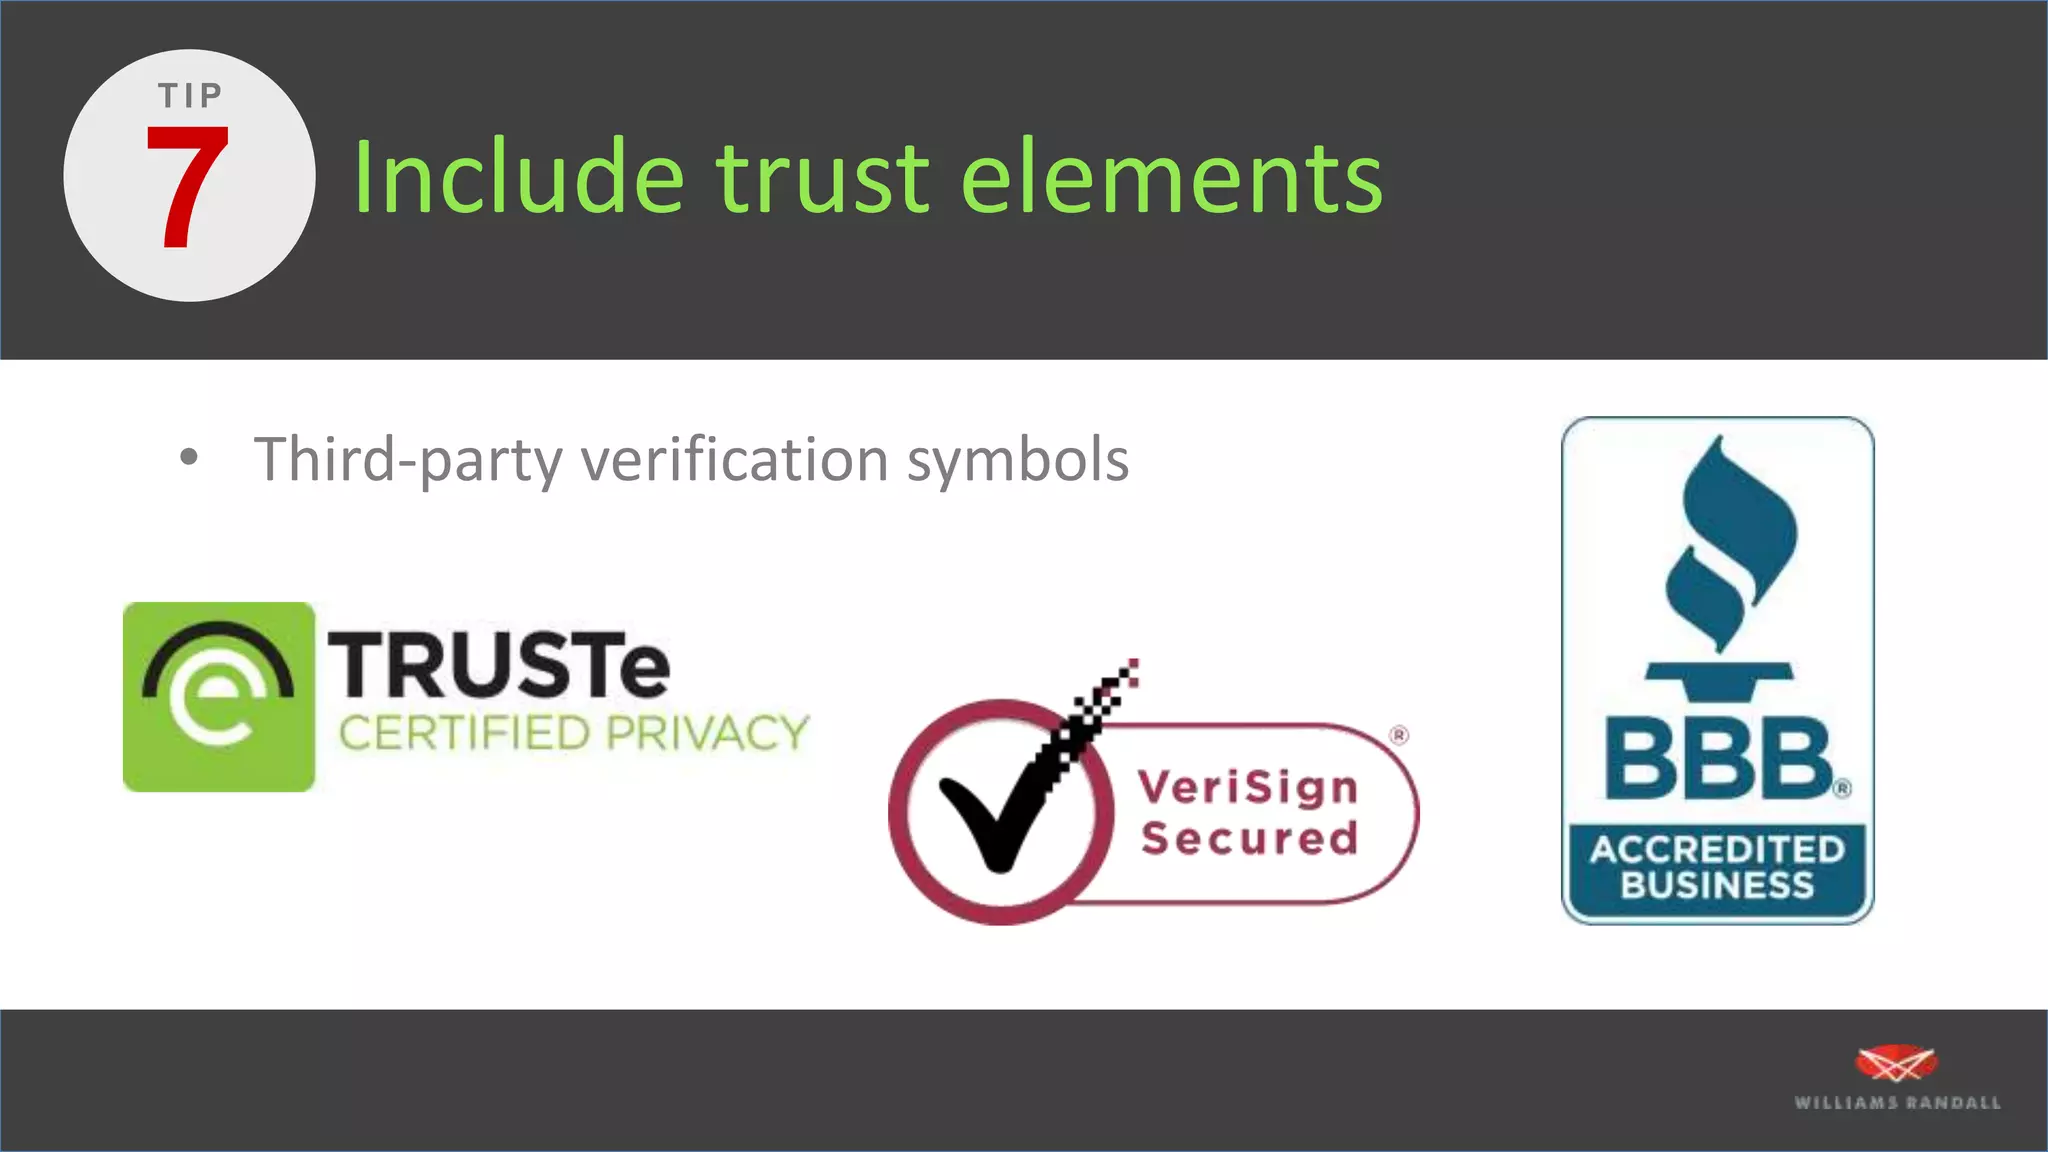
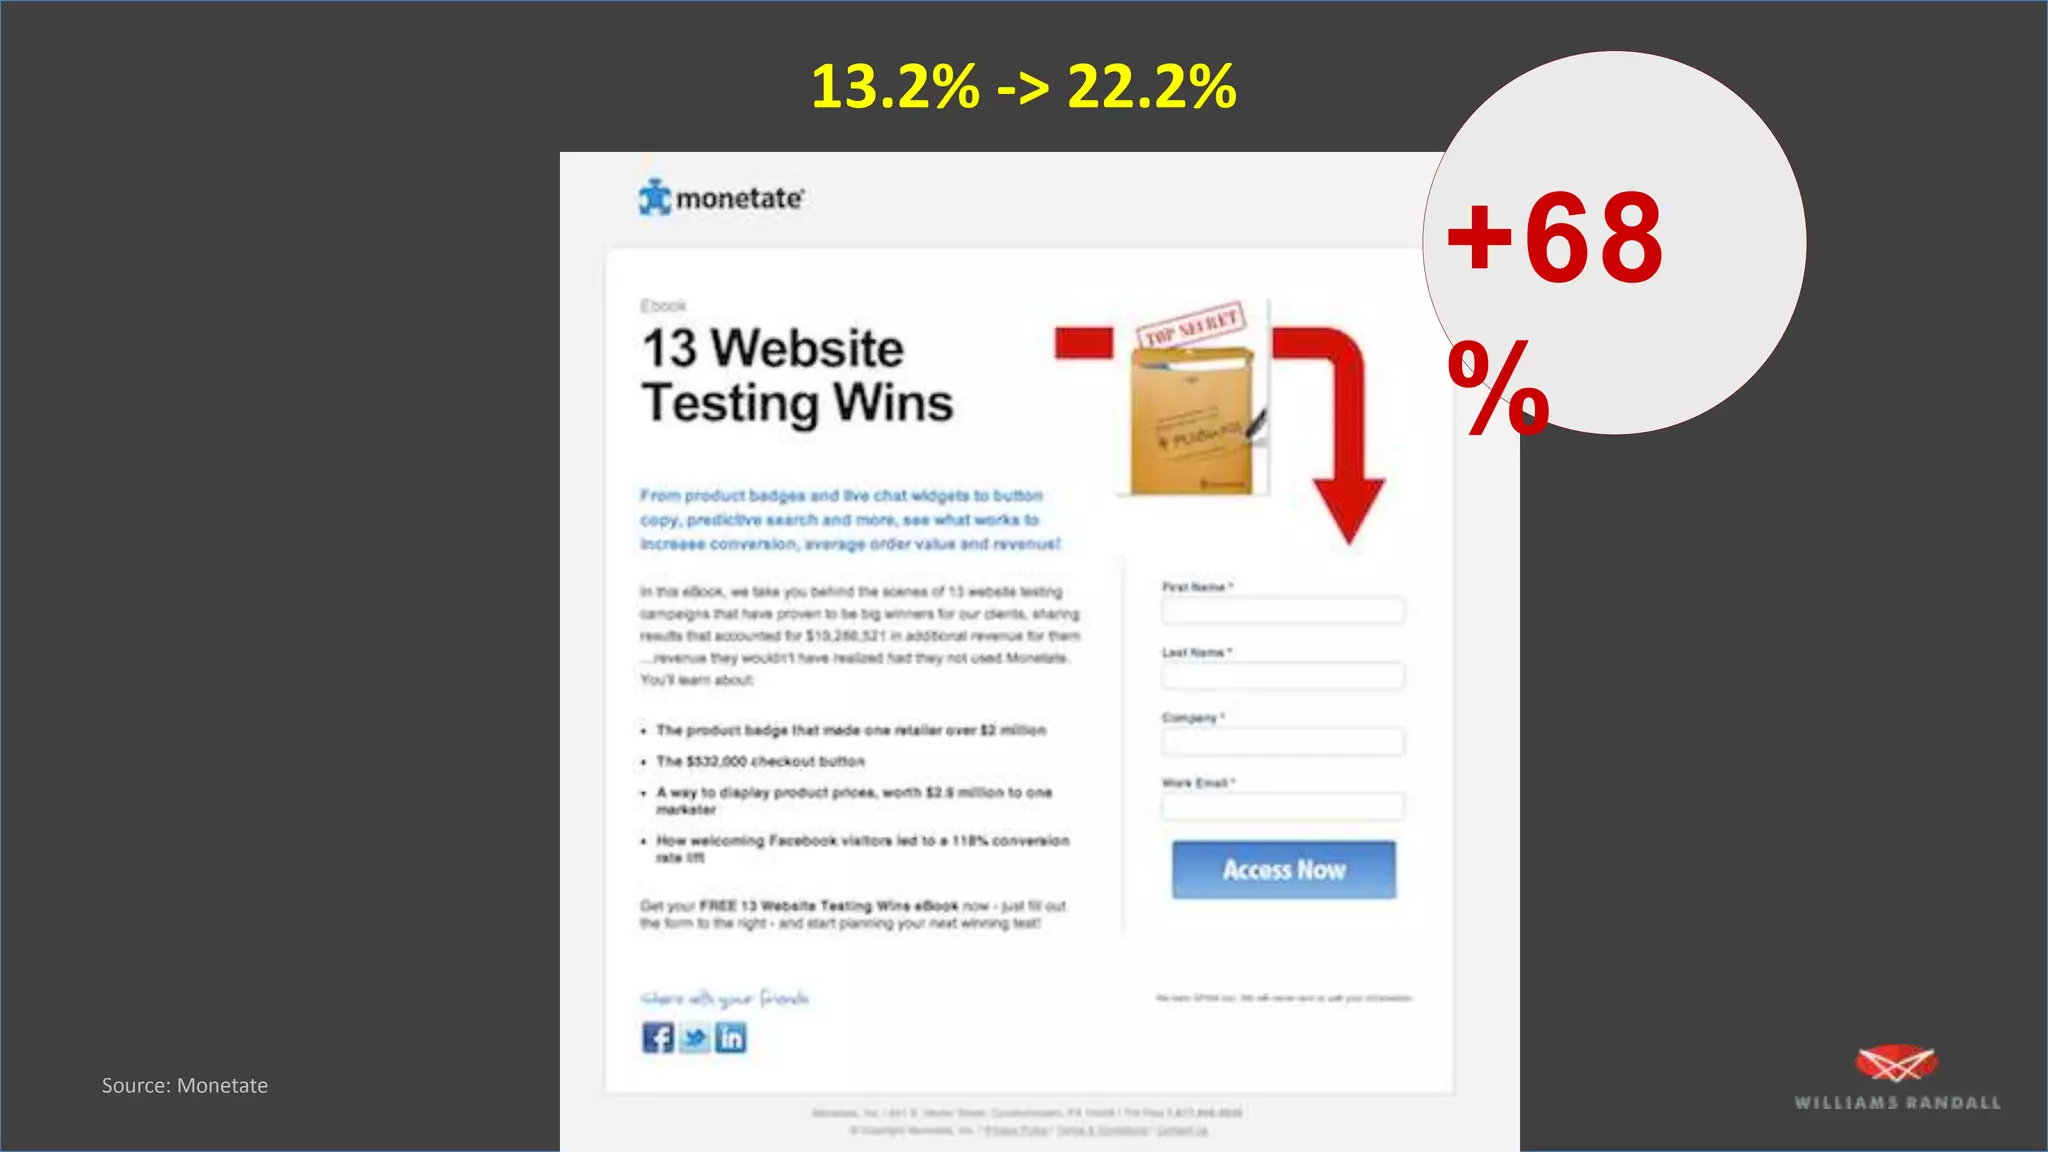
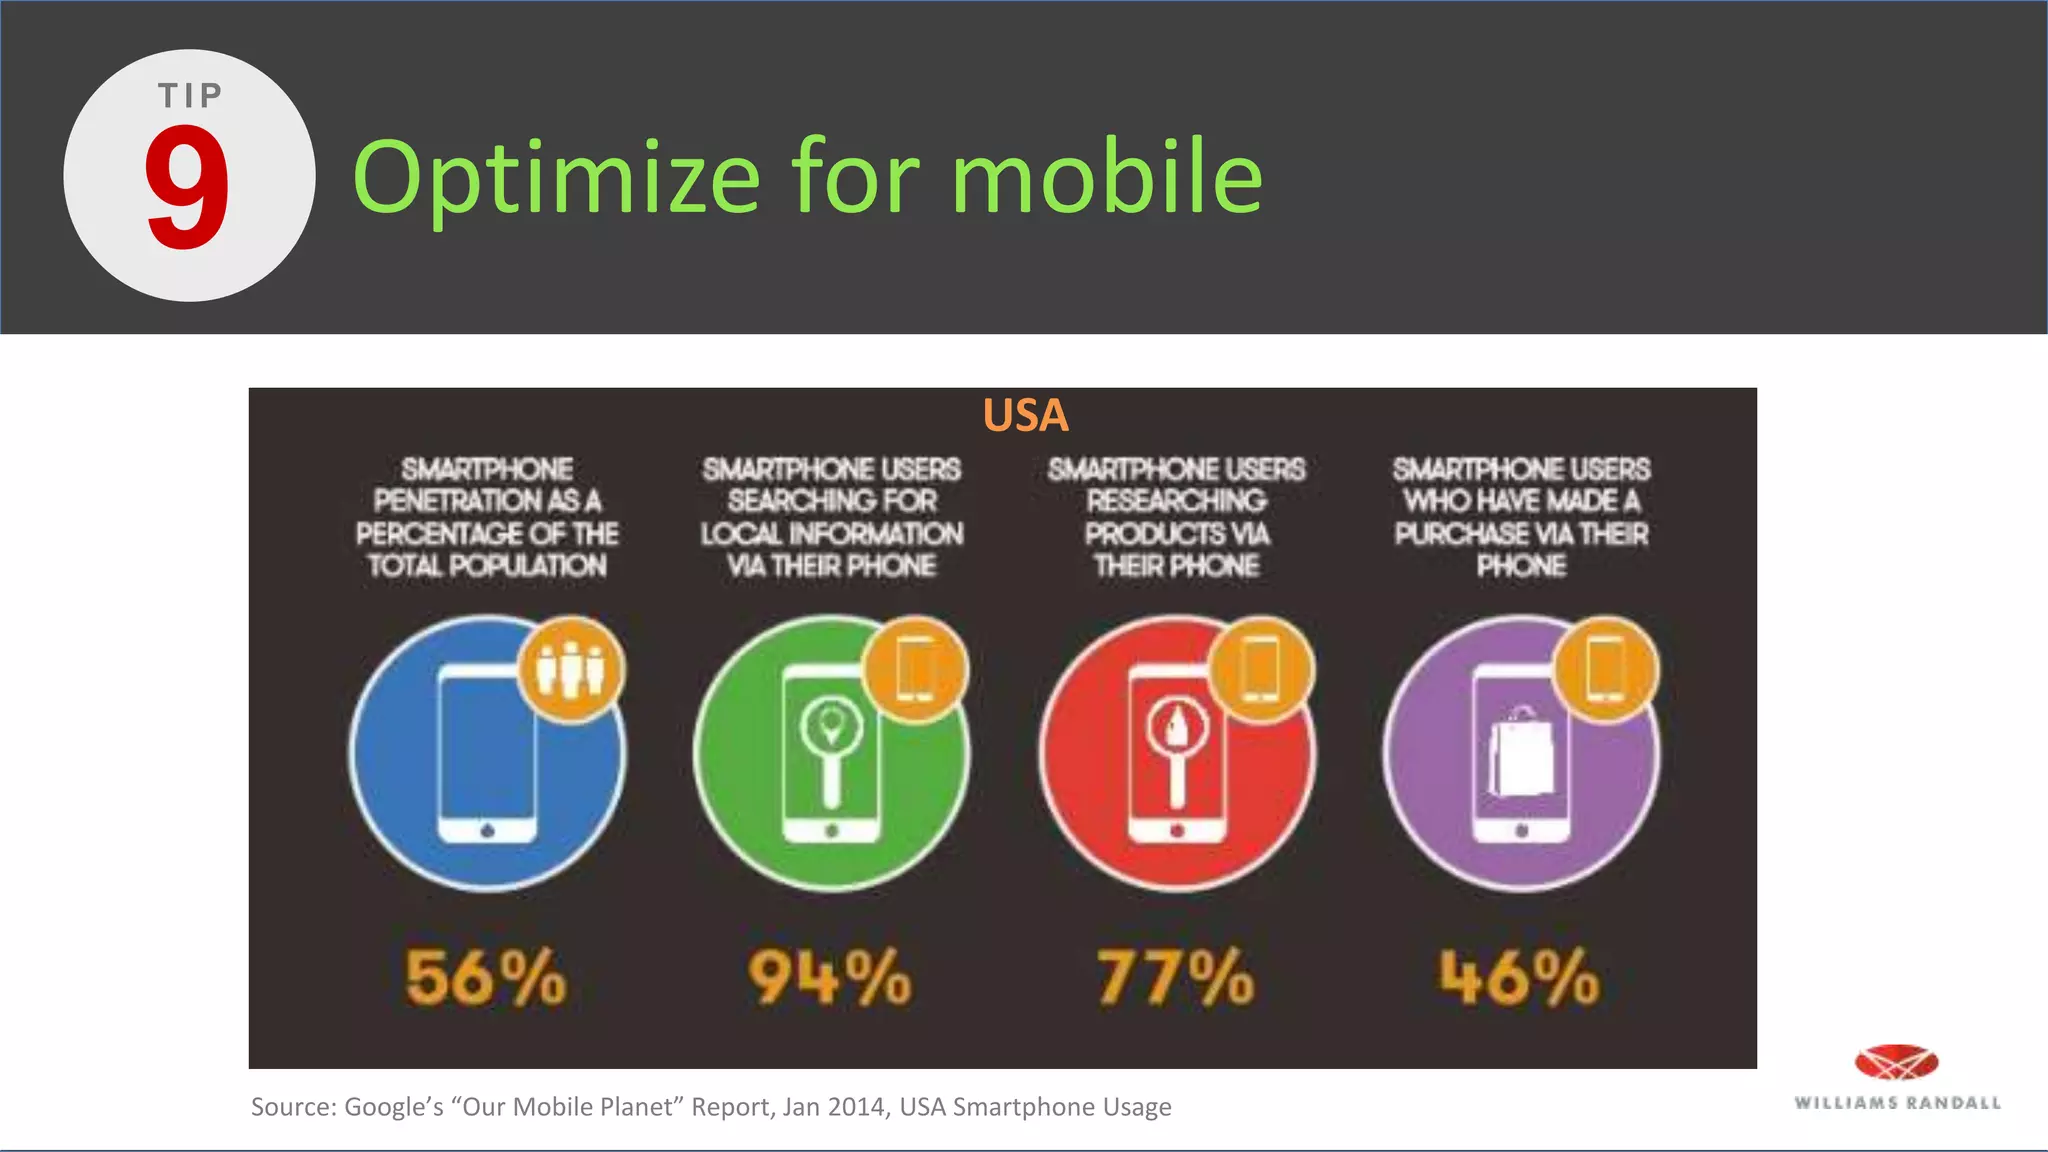
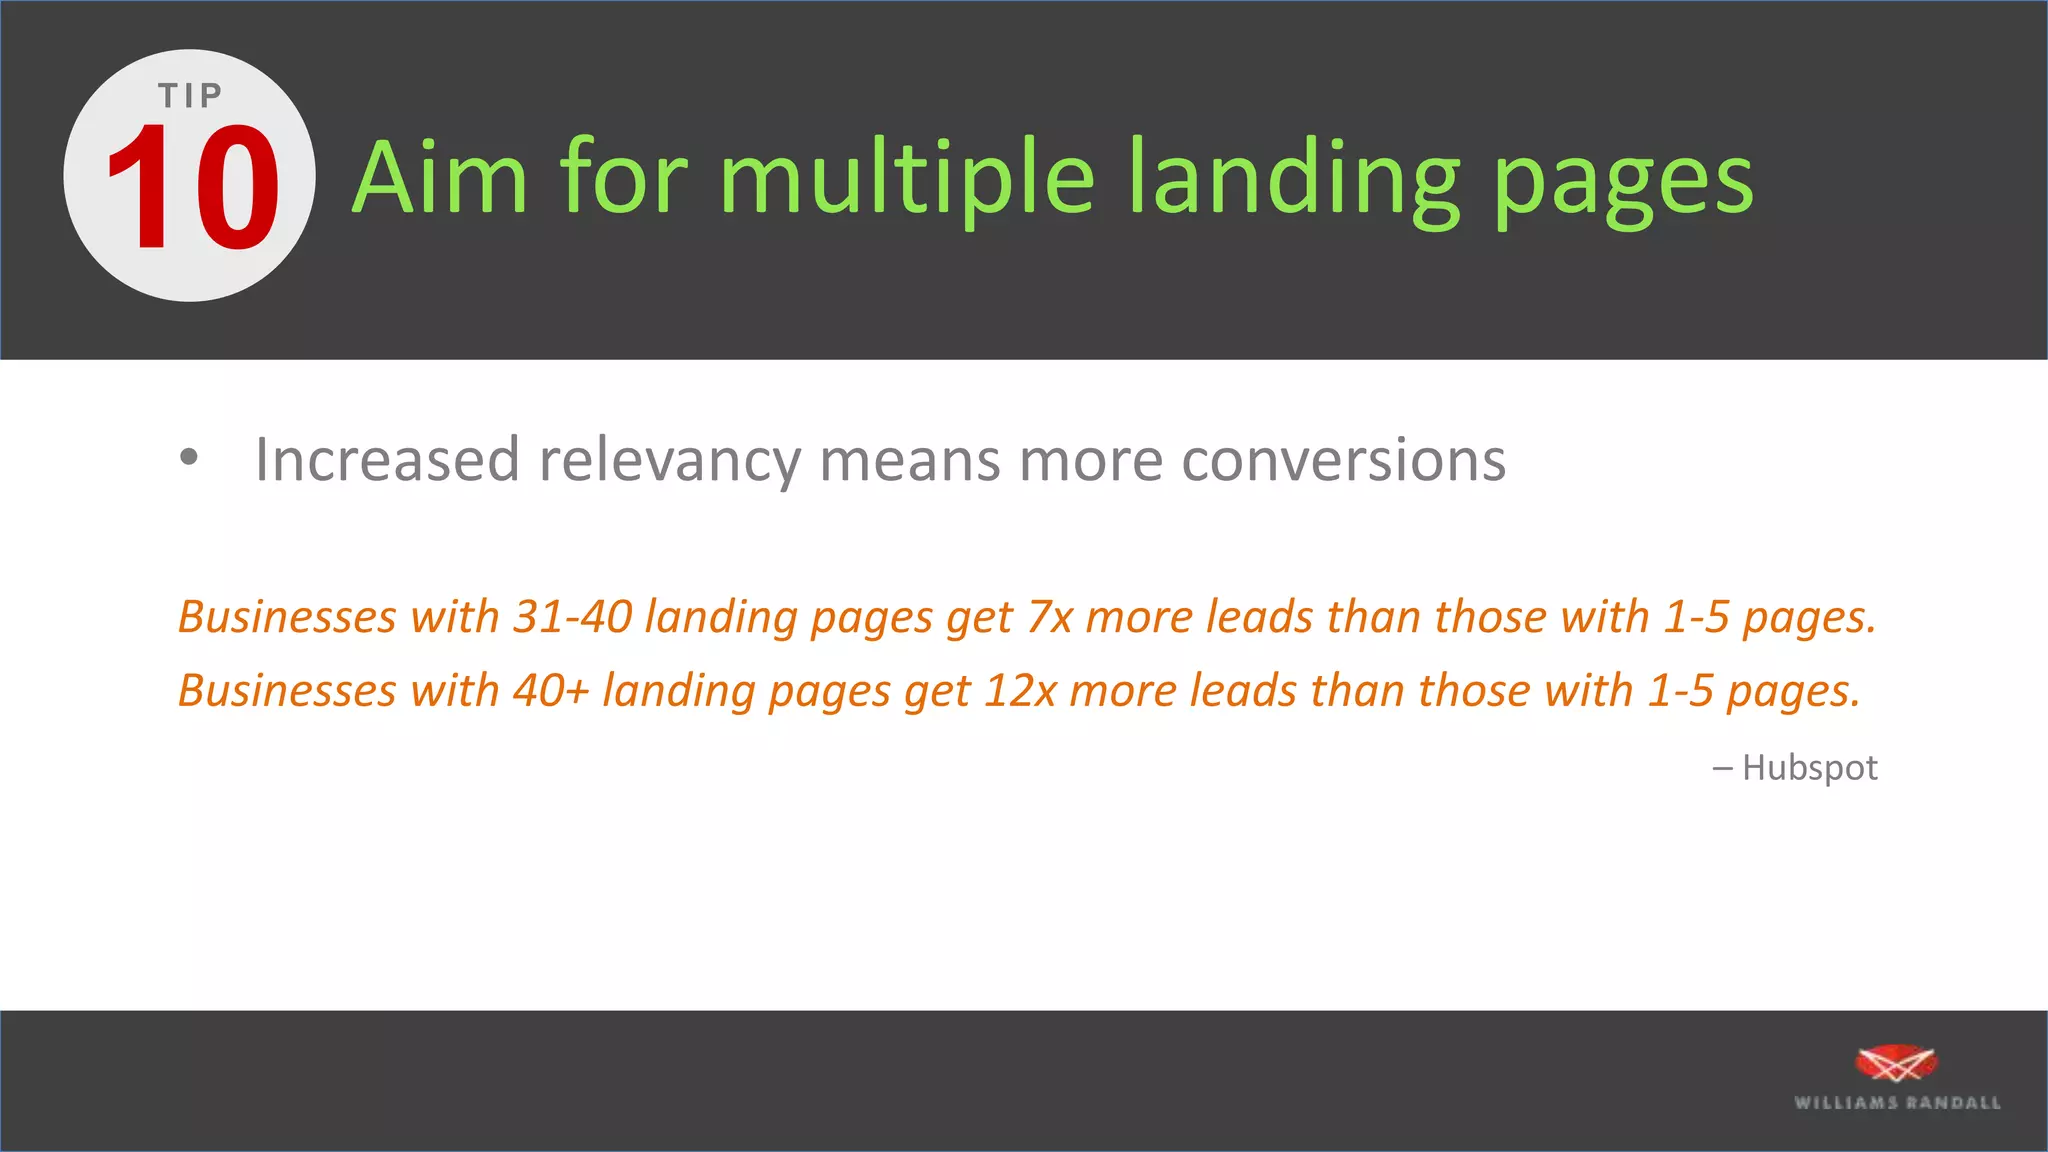
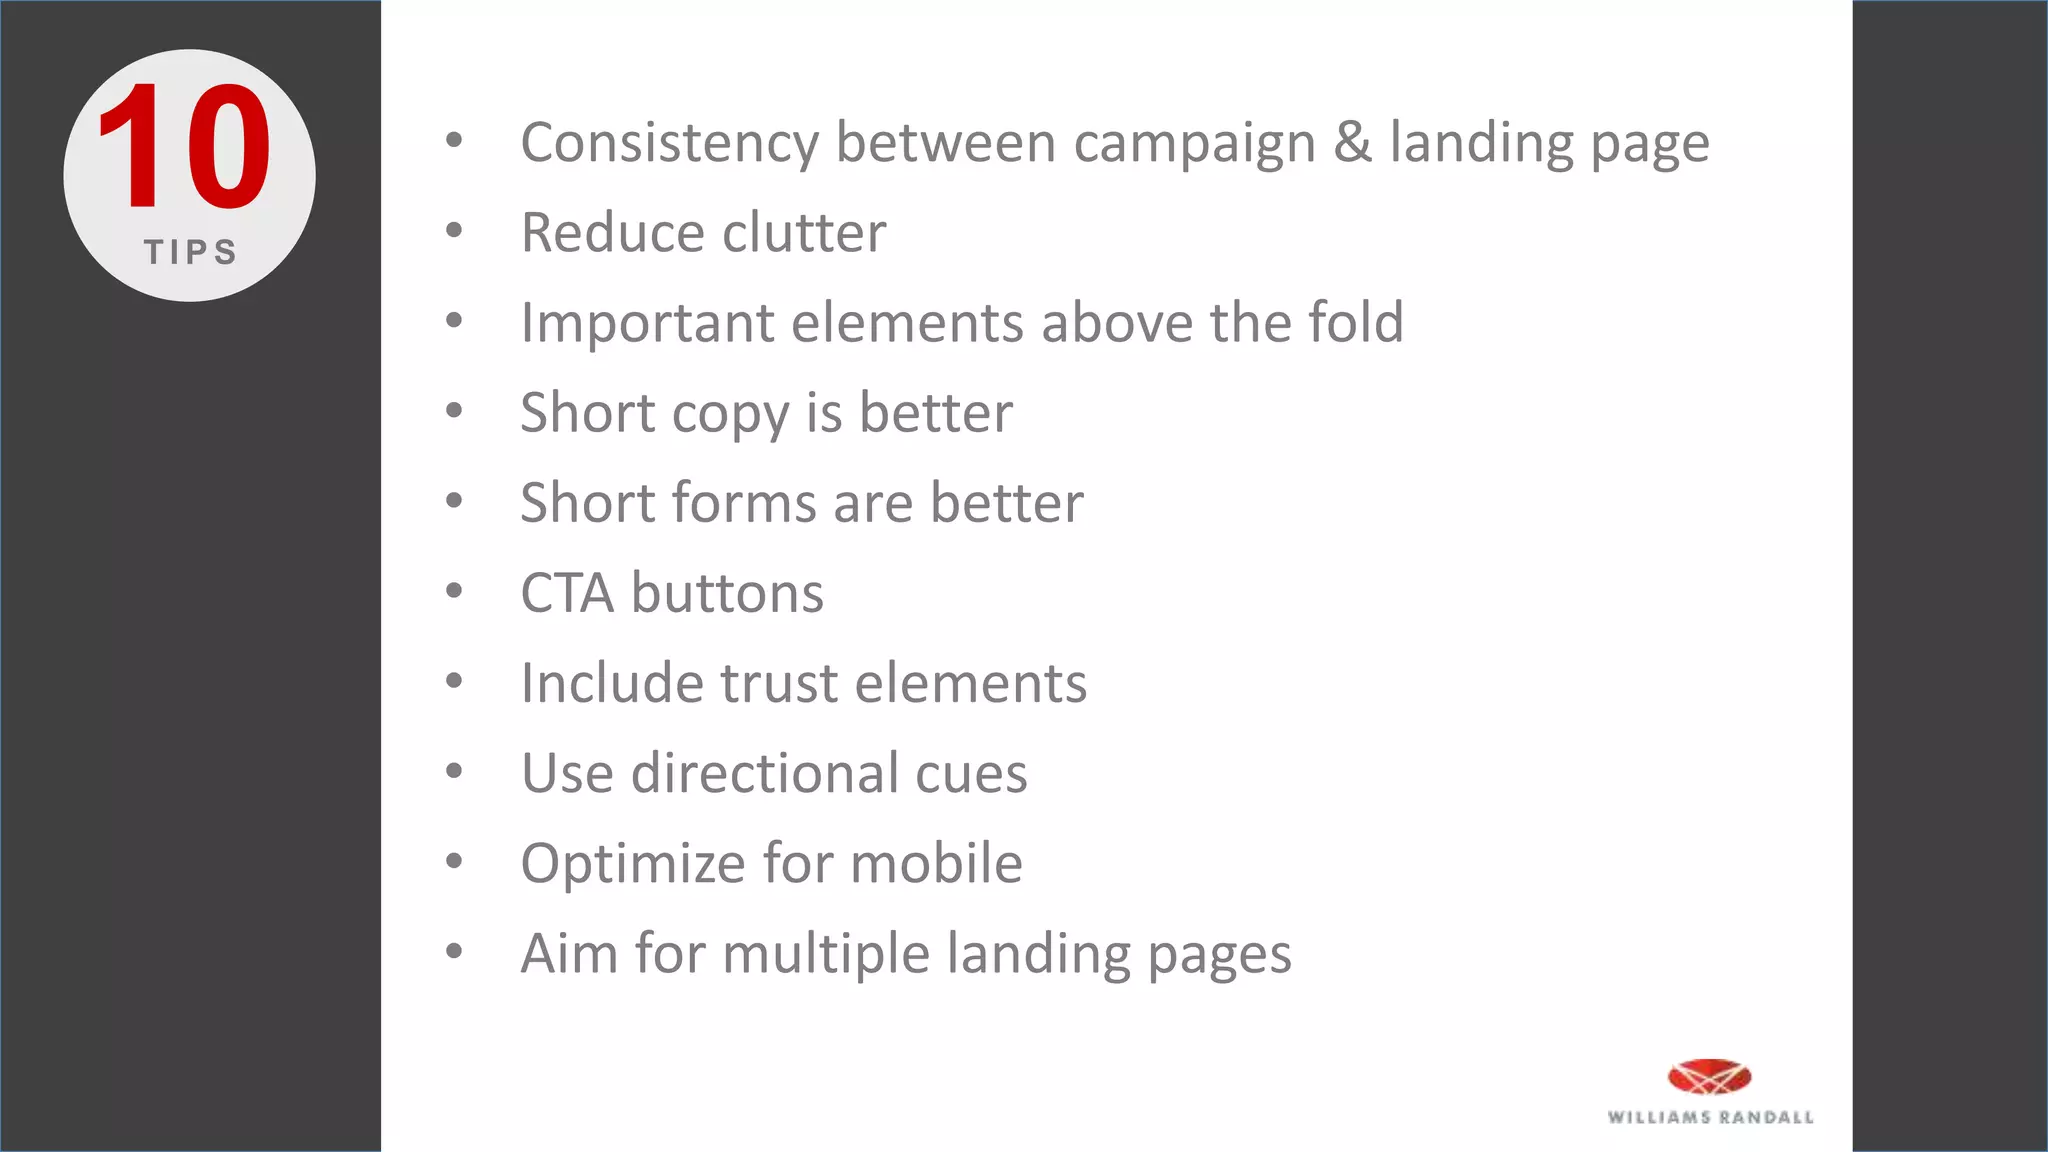
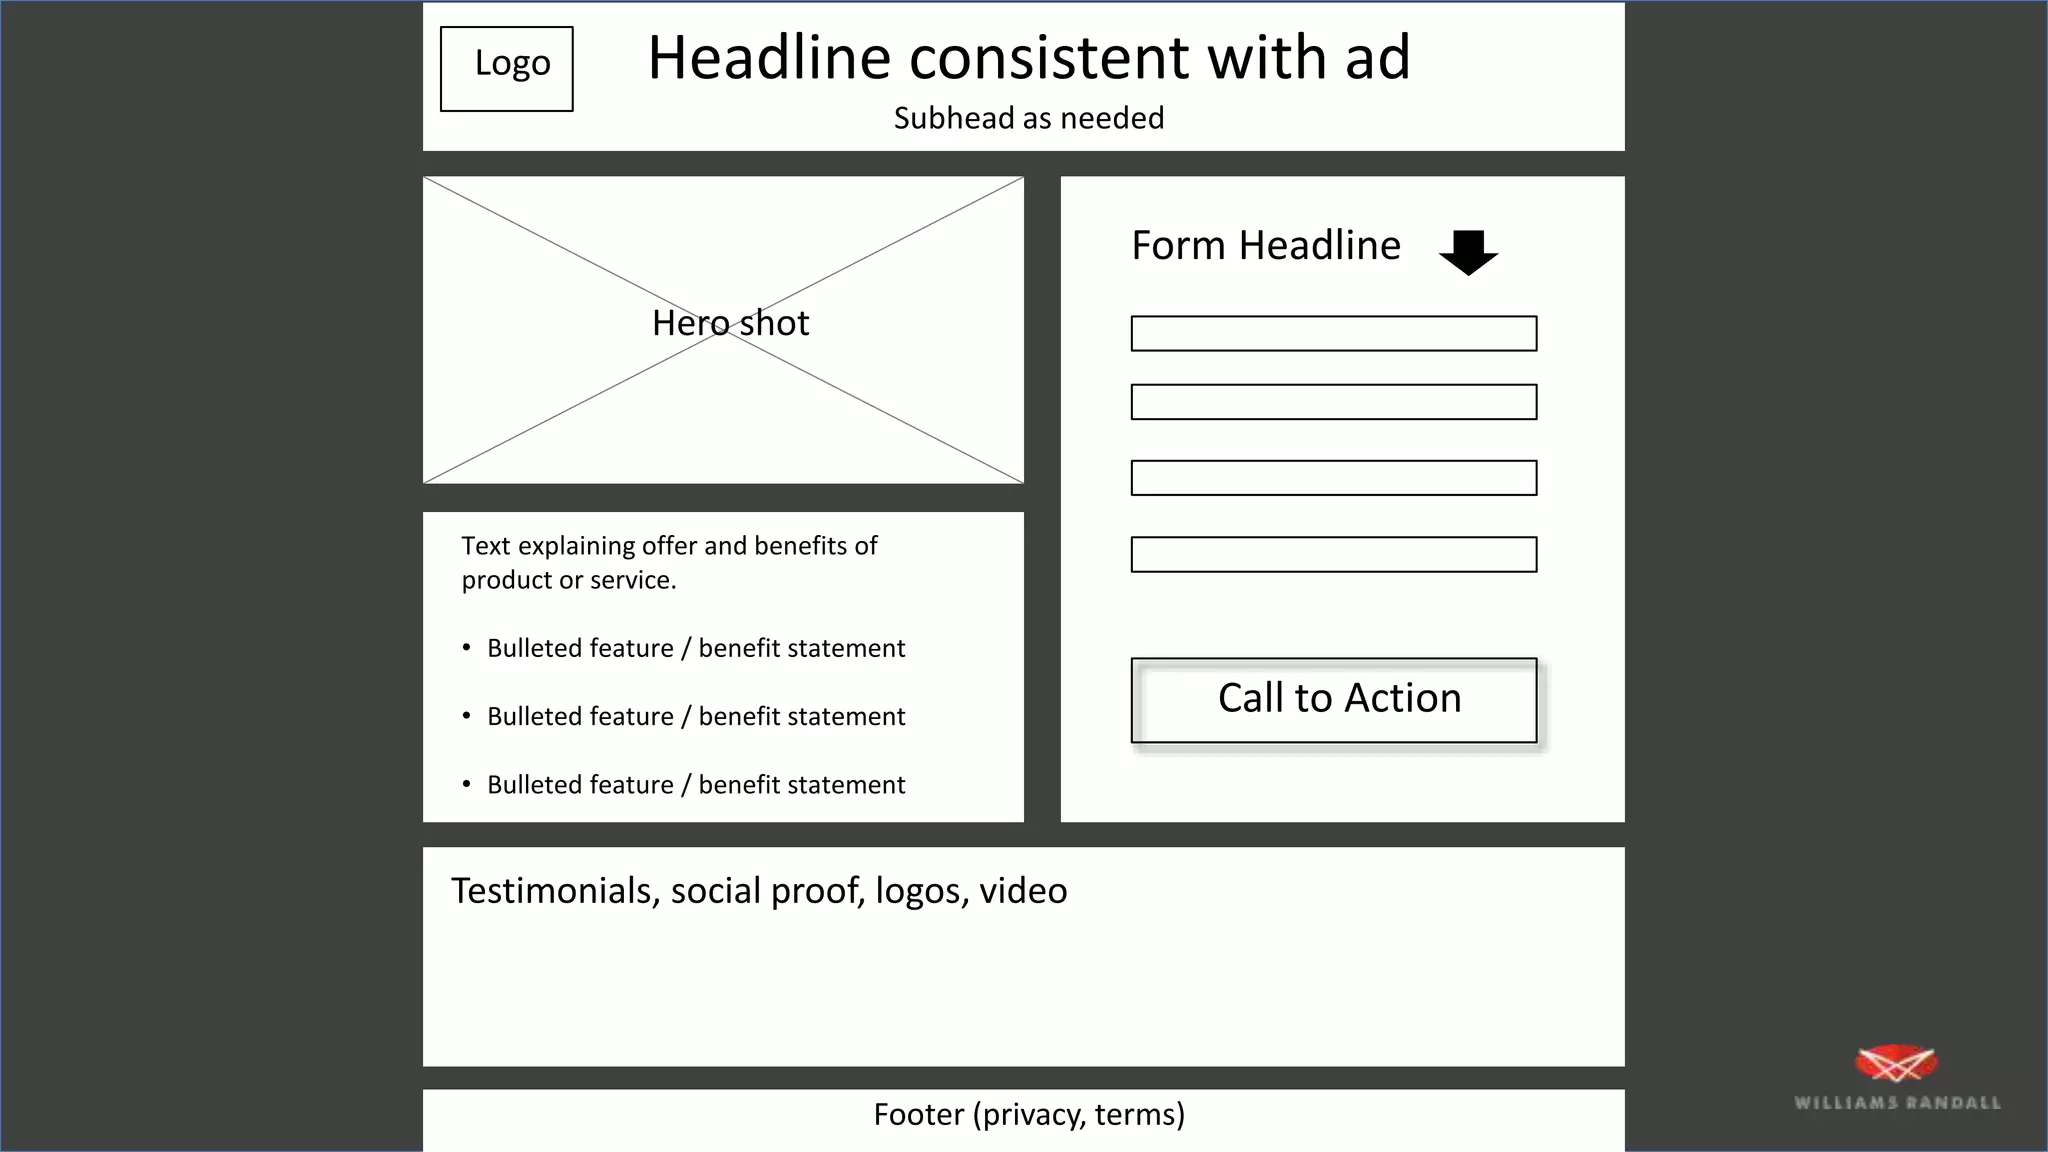
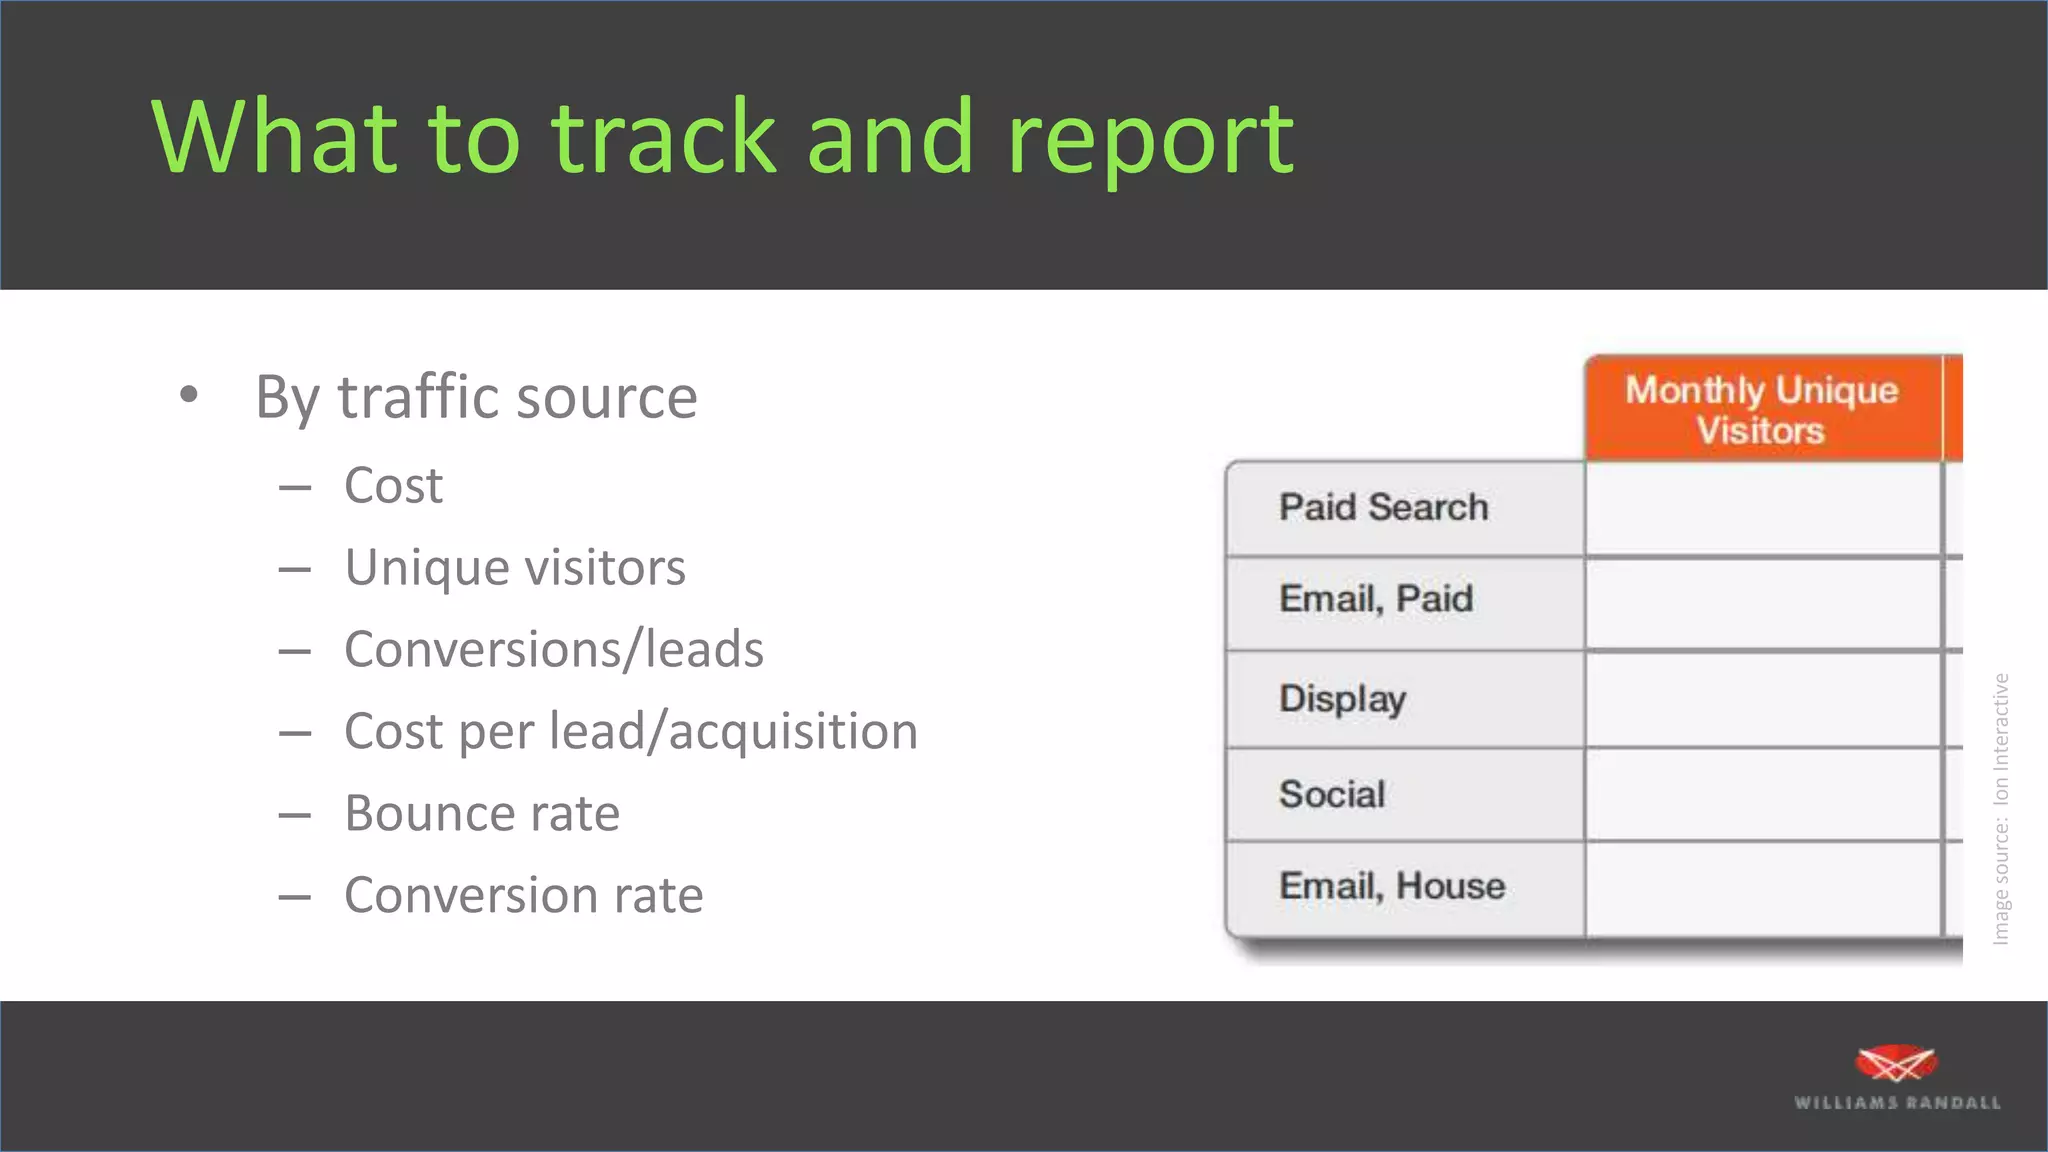
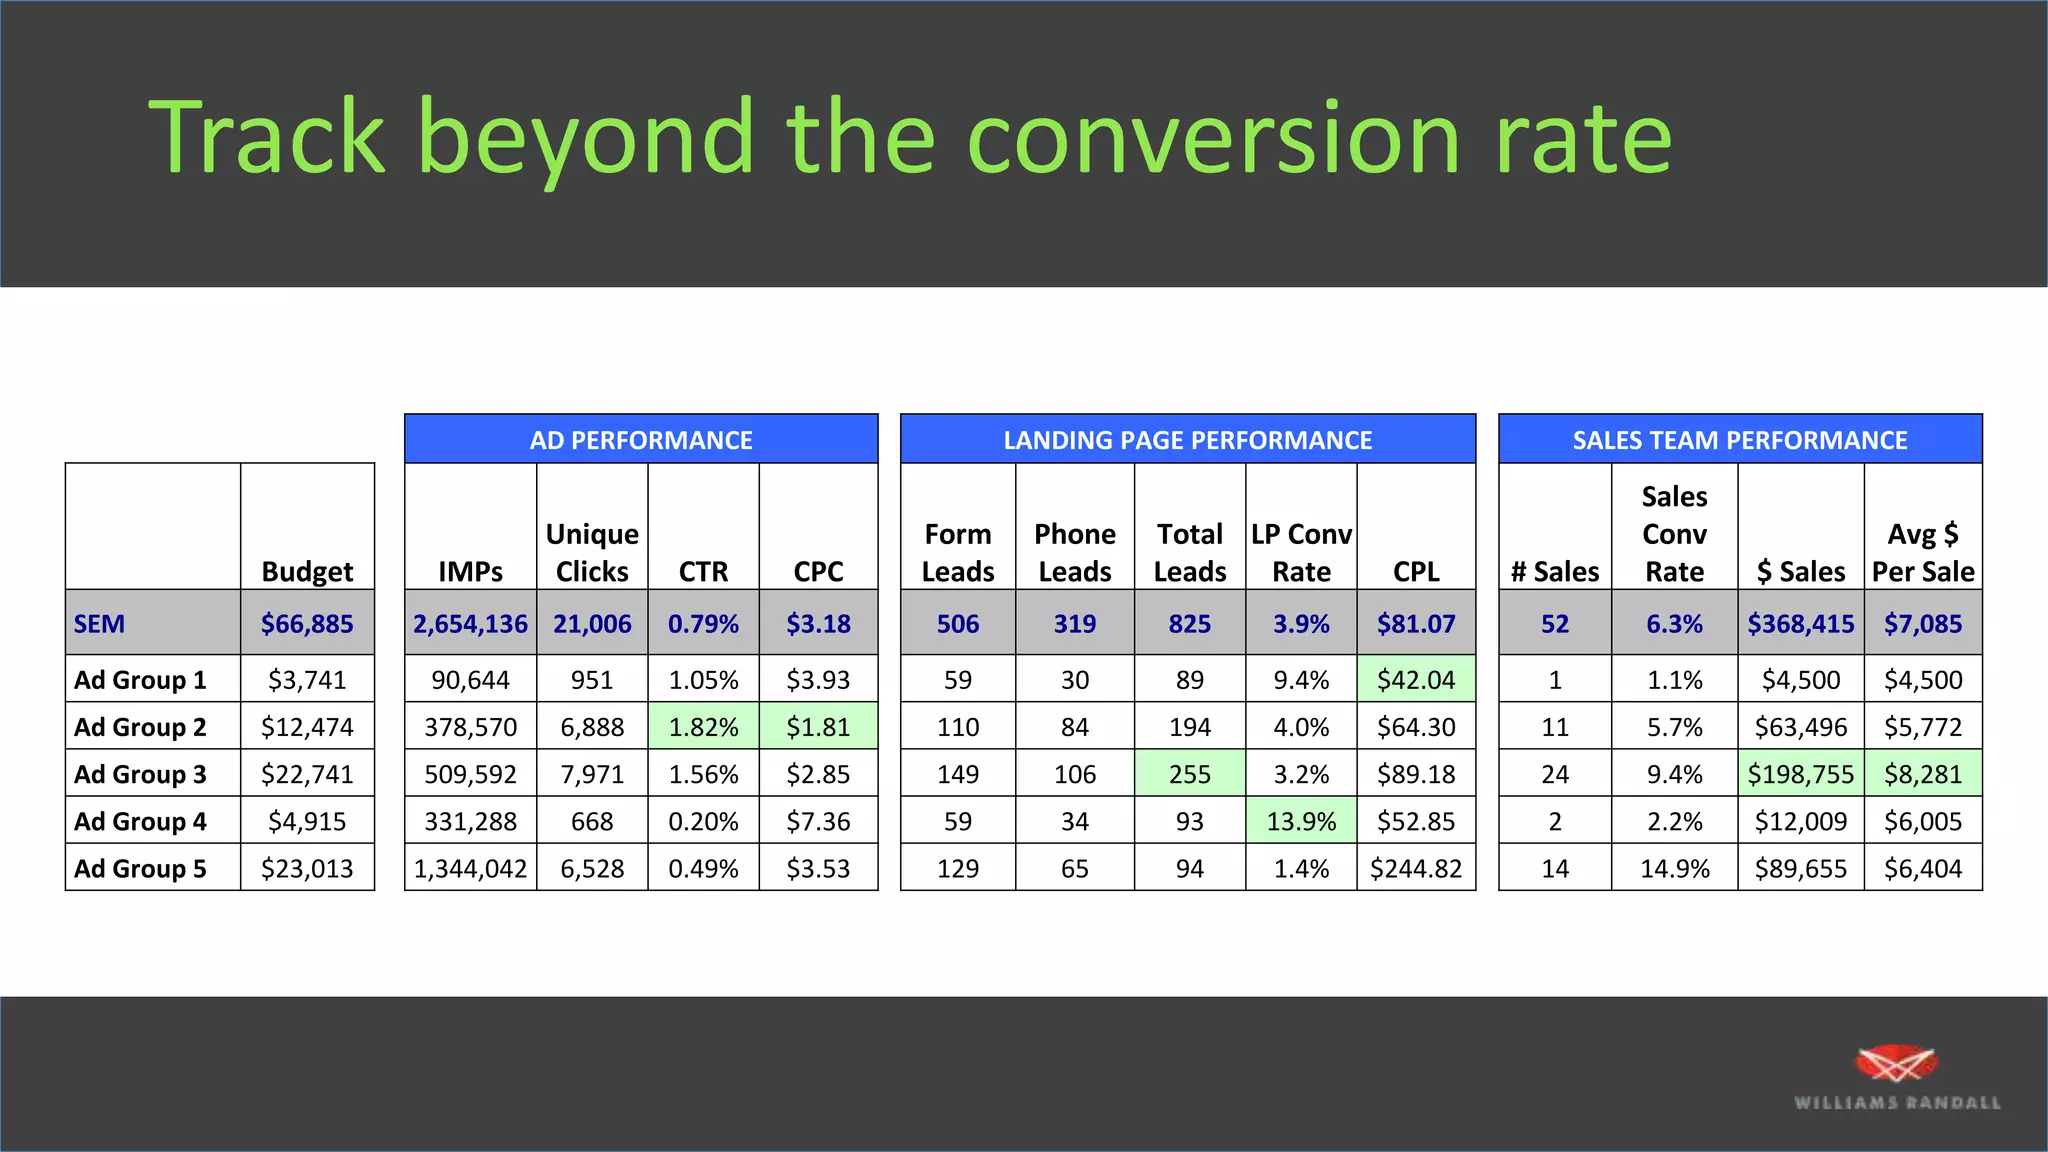
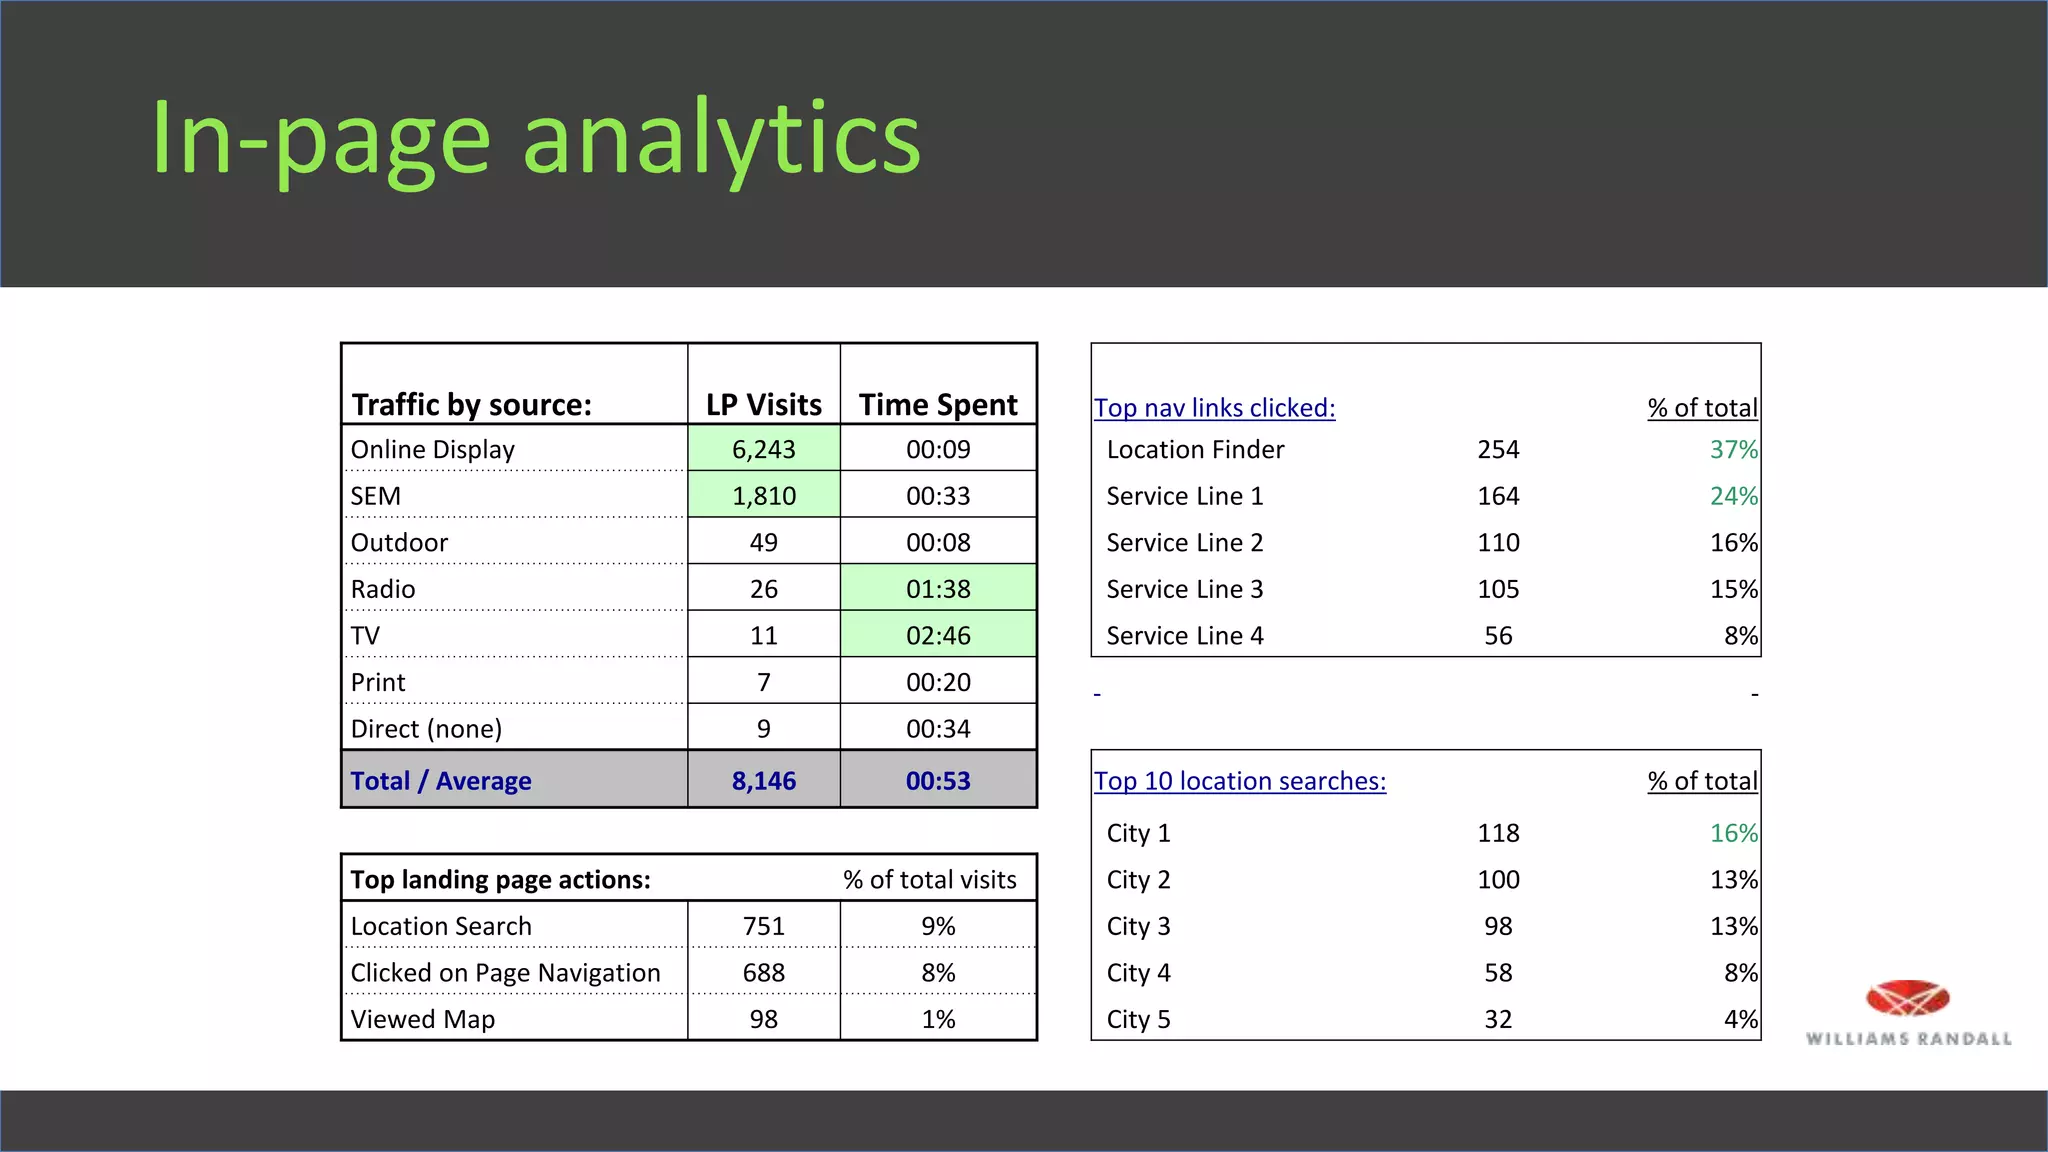
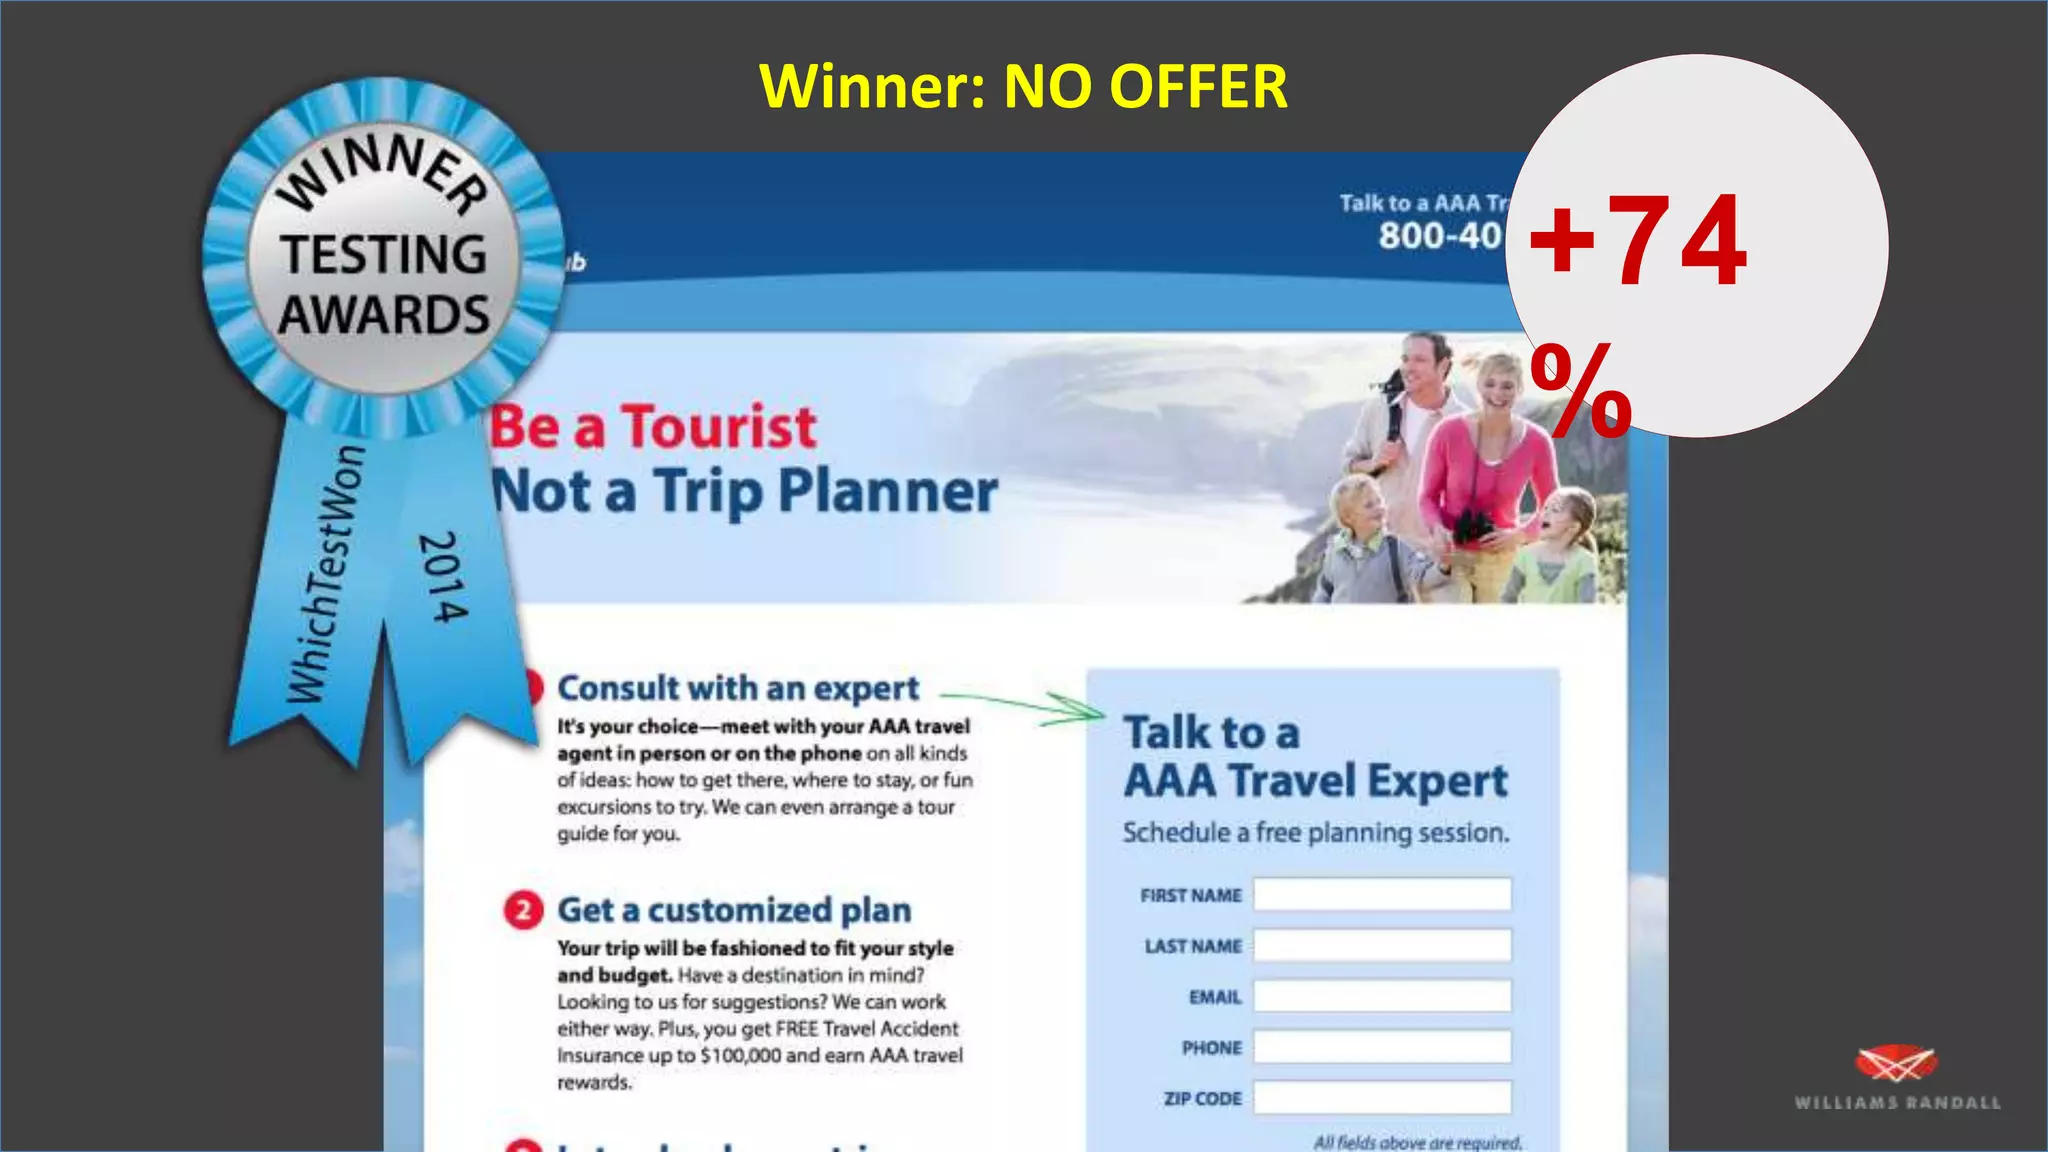
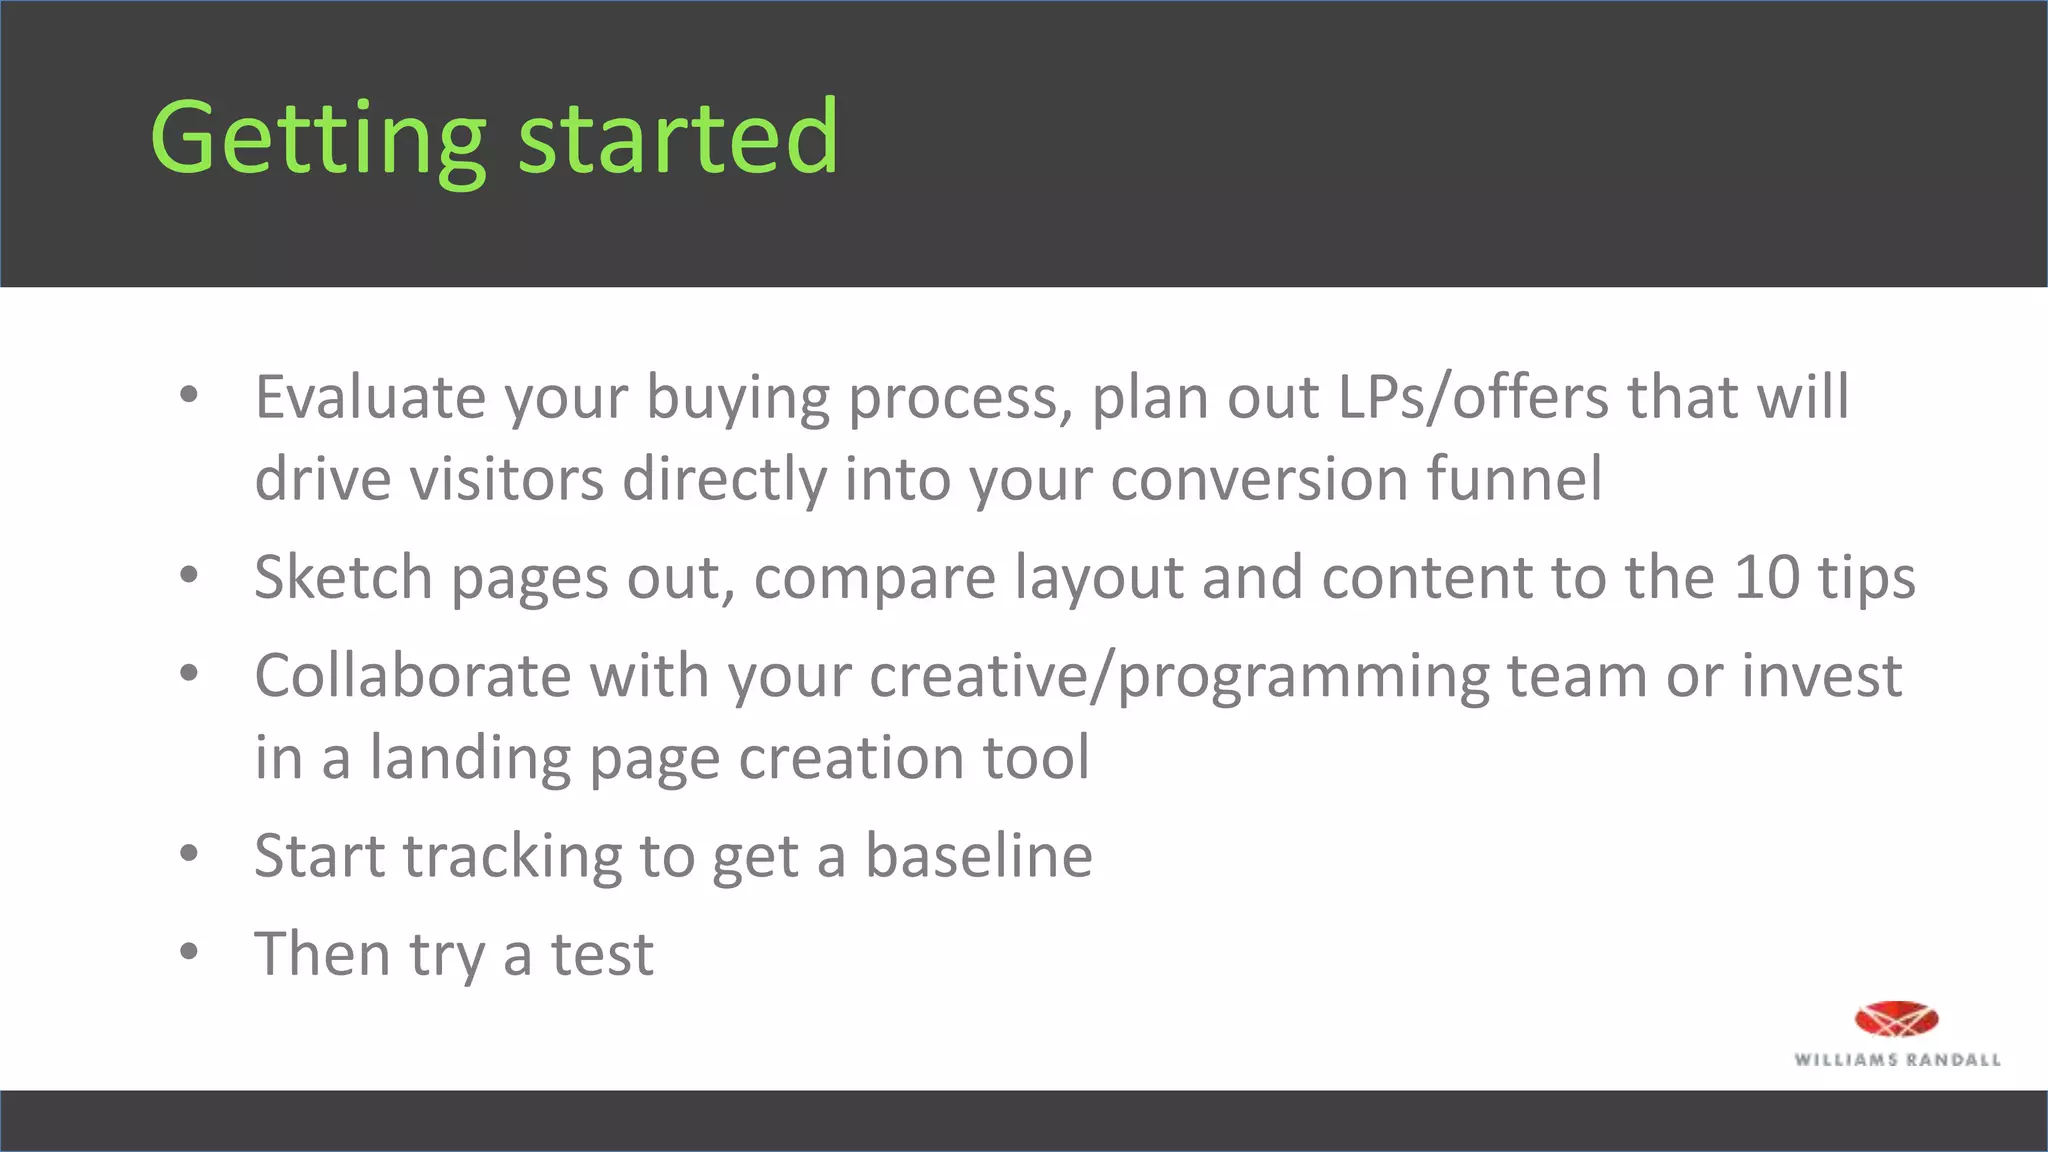
HOW TO CREATE
SMART
LANDING PAGES
• Traffic from a campaign Campaign landing page
– Pay per click (SEM)
– Online display
– Email
– Social
• Created specifically to get a visitor to take a specific action
• Different than website or SEO landing pages
– Print
– Direct mail
– TV
– Radio
– Outdoor
EARN
TRUST
REDUCE
FRICTION
FOR SMART
LANDING PAGES
10TIPS
• Consistency between campaign & landing page
• Reduce clutter
• Important elements above the fold
• Short copy is better
• Short forms are better
• CTA buttons
• Include trust elements
• Use directional cues
• Optimize for mobile
• Aim for multiple landing pages
10T I P S
Consistency between campaign
and landing page
• Message match – copy, keywords
• Visual match – photos, colors, branding
• Motivation match – pay off the promise
1
T I P
Message & visual match
Display ad
Landing Page
A - Control B – PPC keyword
Source:MECLABSResearch
4.9%  12.1%
+144%
Reduce clutter
• Distractions = lower conversion rates
• Strip anything that might detract from a conversion
– Page navigation
– Off-page links
– Unnecessary copy
– Unnecessary form fields
2
T I P
A B
Source:WhichTestWon
Winner: LESS CLUTTER
+2,069%
Important elements above the fold
3
T I P
( & M Y T H )
• Value proposition, call to action and conversion point
• 5-second test
Important elements above the fold
• However, there is a correlation between the complexity of
the product or offer and the CTA placement
KISSmetrics found that “higher conversion rates have nothing to do with
whether the button is above the fold, and everything to do with whether the
button is below the right amount of good copy.”
• Key: have call to action visible at point where
prospect has become convinced to take action
3
T I P
( & M Y T H )
Short copy is better
• Scannable content
• Engaging headline
• Subheads
• Bullets
• Short copy blocks
4
T I P
( & M Y T H )
Short copy is better
• However, the more commitment a conversion requires, the
more copy you might need
• Key: Use as much copy as your potential customer needs to
make an informed decision
– Longer copy complex offers with high anxiety
(such as a payment or many form fields)
– Shorter copy simple offers with low anxiety
4
T I P
( & M Y T H )
A – Short copy B – Long copy
Source:WhichTestWon
A B
?
Winner: SHORT
+36
%
Shorter forms are better
• Shorter forms = less friction, more leads
• Longer forms = more friction, fewer leads
An Eloqua study found the ‘sweet spot’ for form length is between 5-10 fields
where 7 was the optimal number.
5
T I P
( & M Y T H )
…but higher quality
Shorter forms are better
• Work/reward ratio
– Is offer valuable enough to the visitor to be worth form completion?
• Create the appearance of a low hurdle to conversion
– Break long forms into multi-step experiences
– Set expectations with progress bars
– Pre-populate form fields
• Optional fields
5
T I P
( & M Y T H )
A – Longer Form B – Shorter Form
?Source: WhichTestWon
Winner: LONG
+31
%
CTA buttons
• Contrasting color
• Big is good
• White space
6
T I P
CTA buttons
• Use language that speaks to the value they will get
– Download 5 Steps to a Great Landing Page
– Request Free Quote
– Get Started Today
6
T I P
A - RESERVE B – BOOK NOW
?Source: MECLABS Research
Winner: RESERVE
+12
%
Include trust elements
• “Social proof”
– Real customer testimonials
– Ratings
– Facebook or Twitter plugins
– Partner logos
7
T I P
Include trust elements
• Third-party verification symbols
7
T I P
Use directional cues
• Literally point the visitor to what you want them to do
– Arrows
– Eyes gazing
– Fingers pointing
8
T I P
13.2% -> 22.2%
+68
%
Source: Monetate
Optimize for mobile9
T I P
Source: Google’s “Our Mobile Planet” Report, Jan 2014, USA Smartphone Usage
USA
Optimize for mobile
• Device-specific versions of the page
• Responsive design to automatically adjust to the visitor’s
screen size ( http://www.sportevents.com/landing/super_bowl_packages )
9
T I P
A - Desktop B - Mobile-optimized
Source:IonInteractive
+153%
Winner: Mobile-optimized
Aim for multiple landing pages
• More landing pages means more targeting opportunities
– Traffic source-specific
– Campaign-specific / offer-specific (create more offers)
10
T I P
Aim for multiple landing pages
• Increased relevancy means more conversions
Businesses with 31-40 landing pages get 7x more leads than those with 1-5 pages.
Businesses with 40+ landing pages get 12x more leads than those with 1-5 pages.
– Hubspot
10
T I P
Aim for multiple landing pages
• Consider investing in a landing page creation tool
– HubSpot
– Unbounce
– ClickThroo
10
T I P
• Consistency between campaign & landing page
• Reduce clutter
• Important elements above the fold
• Short copy is better
• Short forms are better
• CTA buttons
• Include trust elements
• Use directional cues
• Optimize for mobile
• Aim for multiple landing pages
10T I P S
Headline consistent with ad
Subhead as needed
Form Headline
Call to Action
Text explaining offer and benefits of
product or service.
• Bulleted feature / benefit statement
Footer (privacy, terms)
Logo
Hero shot
Testimonials, social proof, logos, video
TRACKING & REPORTING
What to track and report
• By traffic source
– Cost
– Unique visitors
– Conversions/leads
– Cost per lead/acquisition
– Bounce rate
– Conversion rate
Imagesource:IonInteractive
Track beyond the conversion rate
AD PERFORMANCE LANDING PAGE PERFORMANCE SALES TEAM PERFORMANCE
Budget IMPs
Unique
Clicks CTR CPC
Form
Leads
Phone
Leads
Total
Leads
LP Conv
Rate CPL # Sales
Sales
Conv
Rate $ Sales
Avg $
Per Sale
SEM $66,885 2,654,136 21,006 0.79% $3.18 506 319 825 3.9% $81.07 52 6.3% $368,415 $7,085
Ad Group 1 $3,741 90,644 951 1.05% $3.93 59 30 89 9.4% $42.04 1 1.1% $4,500 $4,500
Ad Group 2 $12,474 378,570 6,888 1.82% $1.81 110 84 194 4.0% $64.30 11 5.7% $63,496 $5,772
Ad Group 3 $22,741 509,592 7,971 1.56% $2.85 149 106 255 3.2% $89.18 24 9.4% $198,755 $8,281
Ad Group 4 $4,915 331,288 668 0.20% $7.36 59 34 93 13.9% $52.85 2 2.2% $12,009 $6,005
Ad Group 5 $23,013 1,344,042 6,528 0.49% $3.53 129 65 94 1.4% $244.82 14 14.9% $89,655 $6,404
In-page analytics
Traffic by source: LP Visits Time Spent Top nav links clicked: % of total
Online Display 6,243 00:09 Location Finder 254 37%
SEM 1,810 00:33 Service Line 1 164 24%
Outdoor 49 00:08 Service Line 2 110 16%
Radio 26 01:38 Service Line 3 105 15%
TV 11 02:46 Service Line 4 56 8%
Print 7 00:20
Direct (none) 9 00:34
Total / Average 8,146 00:53 Top 10 location searches: % of total
City 1 118 16%
Top landing page actions: % of total visits City 2 100 13%
Location Search 751 9% City 3 98 13%
Clicked on Page Navigation 688 8% City 4 58 8%
Viewed Map 98 1% City 5 32 4%
Tracking toolbox
• Unique URLs
• Trackable phone numbers
• Tracking pixels
• Google Analytics:
– Event tracking
– Conversion goals
TESTING
What to test
• Layout
• Headline
• Offer
• Copy – short vs. long, style
• Images – hero shot, video
• Form – style, number of fields
• Buttons – color, CTA language, placement, size
Innovation vs. Iteration
Image source: Ion Interactive
A/B vs. Multivariate
Image source: Ion Interactive
Do you have enough traffic to test?
• Use a test duration calculator to determine how long a test
will take to give you good results
– http://visualwebsiteoptimizer.com/ab-split-test-duration/
• If calculator says 8 weeks or less, go ahead
Testing tools
• Google Analytics Content Experiments
• Optimizely
• Visual Website Optimizer
• Maxymiser
• Unbounce
• Adobe Test & Target
• Don’t rush to judgment
• Results may surprise you
A – Offer B – No Offer
?
Source:WilliamsRandallMarketing
Winner: NO OFFER
+74
%
GETTING STARTED
Getting started
• Evaluate your buying process, plan out LPs/offers that will
drive visitors directly into your conversion funnel
• Sketch pages out, compare layout and content to the 10 tips
• Collaborate with your creative/programming team or invest
in a landing page creation tool
• Start tracking to get a baseline
• Then try a test
Joy Cropper
Joy.cropper@willran.com

How to Create Smart Landing Pages, by Joy Cropper

  • 1.
  • 3.
    • Traffic froma campaign Campaign landing page – Pay per click (SEM) – Online display – Email – Social • Created specifically to get a visitor to take a specific action • Different than website or SEO landing pages – Print – Direct mail – TV – Radio – Outdoor
  • 4.
  • 5.
  • 6.
    • Consistency betweencampaign & landing page • Reduce clutter • Important elements above the fold • Short copy is better • Short forms are better • CTA buttons • Include trust elements • Use directional cues • Optimize for mobile • Aim for multiple landing pages 10T I P S
  • 7.
    Consistency between campaign andlanding page • Message match – copy, keywords • Visual match – photos, colors, branding • Motivation match – pay off the promise 1 T I P
  • 8.
    Message & visualmatch Display ad Landing Page
  • 9.
    A - ControlB – PPC keyword Source:MECLABSResearch
  • 10.
  • 11.
    Reduce clutter • Distractions= lower conversion rates • Strip anything that might detract from a conversion – Page navigation – Off-page links – Unnecessary copy – Unnecessary form fields 2 T I P
  • 12.
  • 14.
  • 15.
    Important elements abovethe fold 3 T I P ( & M Y T H ) • Value proposition, call to action and conversion point • 5-second test
  • 16.
    Important elements abovethe fold • However, there is a correlation between the complexity of the product or offer and the CTA placement KISSmetrics found that “higher conversion rates have nothing to do with whether the button is above the fold, and everything to do with whether the button is below the right amount of good copy.” • Key: have call to action visible at point where prospect has become convinced to take action 3 T I P ( & M Y T H )
  • 17.
    Short copy isbetter • Scannable content • Engaging headline • Subheads • Bullets • Short copy blocks 4 T I P ( & M Y T H )
  • 18.
    Short copy isbetter • However, the more commitment a conversion requires, the more copy you might need • Key: Use as much copy as your potential customer needs to make an informed decision – Longer copy complex offers with high anxiety (such as a payment or many form fields) – Shorter copy simple offers with low anxiety 4 T I P ( & M Y T H )
  • 19.
    A – Shortcopy B – Long copy Source:WhichTestWon
  • 22.
  • 23.
  • 24.
    Shorter forms arebetter • Shorter forms = less friction, more leads • Longer forms = more friction, fewer leads An Eloqua study found the ‘sweet spot’ for form length is between 5-10 fields where 7 was the optimal number. 5 T I P ( & M Y T H ) …but higher quality
  • 25.
    Shorter forms arebetter • Work/reward ratio – Is offer valuable enough to the visitor to be worth form completion? • Create the appearance of a low hurdle to conversion – Break long forms into multi-step experiences – Set expectations with progress bars – Pre-populate form fields • Optional fields 5 T I P ( & M Y T H )
  • 26.
    A – LongerForm B – Shorter Form ?Source: WhichTestWon
  • 27.
  • 28.
    CTA buttons • Contrastingcolor • Big is good • White space 6 T I P
  • 29.
    CTA buttons • Uselanguage that speaks to the value they will get – Download 5 Steps to a Great Landing Page – Request Free Quote – Get Started Today 6 T I P
  • 30.
    A - RESERVEB – BOOK NOW ?Source: MECLABS Research
  • 31.
  • 32.
    Include trust elements •“Social proof” – Real customer testimonials – Ratings – Facebook or Twitter plugins – Partner logos 7 T I P
  • 33.
    Include trust elements •Third-party verification symbols 7 T I P
  • 34.
    Use directional cues •Literally point the visitor to what you want them to do – Arrows – Eyes gazing – Fingers pointing 8 T I P
  • 35.
  • 36.
    Optimize for mobile9 TI P Source: Google’s “Our Mobile Planet” Report, Jan 2014, USA Smartphone Usage USA
  • 37.
    Optimize for mobile •Device-specific versions of the page • Responsive design to automatically adjust to the visitor’s screen size ( http://www.sportevents.com/landing/super_bowl_packages ) 9 T I P
  • 38.
    A - DesktopB - Mobile-optimized Source:IonInteractive
  • 39.
  • 40.
    Aim for multiplelanding pages • More landing pages means more targeting opportunities – Traffic source-specific – Campaign-specific / offer-specific (create more offers) 10 T I P
  • 41.
    Aim for multiplelanding pages • Increased relevancy means more conversions Businesses with 31-40 landing pages get 7x more leads than those with 1-5 pages. Businesses with 40+ landing pages get 12x more leads than those with 1-5 pages. – Hubspot 10 T I P
  • 42.
    Aim for multiplelanding pages • Consider investing in a landing page creation tool – HubSpot – Unbounce – ClickThroo 10 T I P
  • 43.
    • Consistency betweencampaign & landing page • Reduce clutter • Important elements above the fold • Short copy is better • Short forms are better • CTA buttons • Include trust elements • Use directional cues • Optimize for mobile • Aim for multiple landing pages 10T I P S
  • 44.
    Headline consistent withad Subhead as needed Form Headline Call to Action Text explaining offer and benefits of product or service. • Bulleted feature / benefit statement • Bulleted feature / benefit statement • Bulleted feature / benefit statement Footer (privacy, terms) Logo Hero shot Testimonials, social proof, logos, video
  • 45.
  • 46.
    What to trackand report • By traffic source – Cost – Unique visitors – Conversions/leads – Cost per lead/acquisition – Bounce rate – Conversion rate Imagesource:IonInteractive
  • 47.
    Track beyond theconversion rate AD PERFORMANCE LANDING PAGE PERFORMANCE SALES TEAM PERFORMANCE Budget IMPs Unique Clicks CTR CPC Form Leads Phone Leads Total Leads LP Conv Rate CPL # Sales Sales Conv Rate $ Sales Avg $ Per Sale SEM $66,885 2,654,136 21,006 0.79% $3.18 506 319 825 3.9% $81.07 52 6.3% $368,415 $7,085 Ad Group 1 $3,741 90,644 951 1.05% $3.93 59 30 89 9.4% $42.04 1 1.1% $4,500 $4,500 Ad Group 2 $12,474 378,570 6,888 1.82% $1.81 110 84 194 4.0% $64.30 11 5.7% $63,496 $5,772 Ad Group 3 $22,741 509,592 7,971 1.56% $2.85 149 106 255 3.2% $89.18 24 9.4% $198,755 $8,281 Ad Group 4 $4,915 331,288 668 0.20% $7.36 59 34 93 13.9% $52.85 2 2.2% $12,009 $6,005 Ad Group 5 $23,013 1,344,042 6,528 0.49% $3.53 129 65 94 1.4% $244.82 14 14.9% $89,655 $6,404
  • 48.
    In-page analytics Traffic bysource: LP Visits Time Spent Top nav links clicked: % of total Online Display 6,243 00:09 Location Finder 254 37% SEM 1,810 00:33 Service Line 1 164 24% Outdoor 49 00:08 Service Line 2 110 16% Radio 26 01:38 Service Line 3 105 15% TV 11 02:46 Service Line 4 56 8% Print 7 00:20 Direct (none) 9 00:34 Total / Average 8,146 00:53 Top 10 location searches: % of total City 1 118 16% Top landing page actions: % of total visits City 2 100 13% Location Search 751 9% City 3 98 13% Clicked on Page Navigation 688 8% City 4 58 8% Viewed Map 98 1% City 5 32 4%
  • 49.
    Tracking toolbox • UniqueURLs • Trackable phone numbers • Tracking pixels • Google Analytics: – Event tracking – Conversion goals
  • 50.
  • 51.
    What to test •Layout • Headline • Offer • Copy – short vs. long, style • Images – hero shot, video • Form – style, number of fields • Buttons – color, CTA language, placement, size
  • 52.
    Innovation vs. Iteration Imagesource: Ion Interactive
  • 53.
    A/B vs. Multivariate Imagesource: Ion Interactive
  • 54.
    Do you haveenough traffic to test? • Use a test duration calculator to determine how long a test will take to give you good results – http://visualwebsiteoptimizer.com/ab-split-test-duration/ • If calculator says 8 weeks or less, go ahead
  • 55.
    Testing tools • GoogleAnalytics Content Experiments • Optimizely • Visual Website Optimizer • Maxymiser • Unbounce • Adobe Test & Target
  • 56.
    • Don’t rushto judgment • Results may surprise you
  • 57.
    A – OfferB – No Offer ? Source:WilliamsRandallMarketing
  • 58.
  • 59.
  • 60.
    Getting started • Evaluateyour buying process, plan out LPs/offers that will drive visitors directly into your conversion funnel • Sketch pages out, compare layout and content to the 10 tips • Collaborate with your creative/programming team or invest in a landing page creation tool • Start tracking to get a baseline • Then try a test
  • 61.