Project analytics in Project ManagementKetan Gandhi
Project managers can use this predictive information to make better decisions and keep projects on schedule and on budget. Analytics does more than simply enable project managers to capture data and mark the tasks done when completed.
This presentation highlights the factors that are critical for the success of a Data Analytics initiative. Questions like how one should go about analyzing data and why data analytics initiatives go wrong are answered in this presentation.
What is Data Science and How to Succeed in itKhosrow Hassibi
The use of machine learning and data mining to create value from corporate or public data is nothing new. It is not the first time that these technologies are in the spotlight. Many remember the late ‘80s and the early ‘90s when machine learning techniques—in particular neural networks—had become very popular. Data mining was at a rise. There were talks everywhere about advanced analysis of data for decision making. Even the popular android character in “Star Trek: The Next Generation” had been named appropriately as “Data.” Data science has been the cornerstone of many data products and applications for more than two decades, e.g., in finance, Telco, and retail. Credit scores have been in use for decades to assess credit worthiness of people when applying for credit or loan. Sophisticated real-time fraud scores based on individual’s transaction spending patterns have been used since early ‘90s to protect credit card holders from a variety of fraud schemes. However, the popularity of web products from the likes of Google, Linked-in, Amazon, and Facebook has helped analytics become a household name. Every new technology comes with lots of hype and many new buzzwords. Often, fact and fiction get mixed-up making it impossible for outsiders to assess the technology’s true relevance. Due to the exponential growth of data, today there is an ever increasing need to process and analyze big data which has required a rethinking of every aspect of the data science life cycle, from data management, to data mining and analysis, to deployment. The purpose of this talk is first to describe what data science is and how it has evolved historically. Second, I share my own experiences as a data scientist across different industries and through time with the audience emphasizing the challenges and rewards.
Everyone is a data scientist today, but that is impossible. How do you spot the real data scientist from the fake? Some people just lie. Don't be fooled this presentation will help find the fools
Data Analysis: Putting Data Capital to WorkMohit Mahendra
This short deck explains the work of a modern data analyst. Putting data capital to work in the business enables decision quality & velocity, operating speed and growth
Jordan Engbers - Making an Effective Data ScientistCybera Inc.
It is difficult for organizations to find and train effective data scientists because of the
multidisciplinary nature of the requisite skillset, typically a combination of programming,
statistics and domain knowledge. Furthermore, data science technologies are evolving at a
rapid pace, requiring practitioners to constantly explore new tools and methodologies. Given this broad and changing landscape, how do we prepare the next generation of data scientists? Since we cannot predict what specific skills or knowledge will be required in the coming years, I propose that we focus on fostering generalist traits, like creativity, curiosity, critical thinking, and a scientific mindset. If we encourage a generalist approach to problem solving, new data scientists will be able to learn skills as necessary and adapt effectively to coming data science technologies.
Introduction to Business Analytics Part 1 published by BeamSync.
BeamSync is providing business analytics training course in Bangalore. If you are looking for analytics training then visit BeamSync. Regular classes are running during the weekend.
For details visit: http://beamsync.com/business-analytics-training-bangalore/
The world is morphing fast:
Low economic growth
Increasing uncertainty
Accelerating change
Increasing complexity
Digitalization
More chance of surprise
Discover emerging change in your interest topics as it happens
Automatically follow rivals, experts, suppliers, regulators, protest groups
Profile and analyze your rivals
Assess your own competitive position
Assess potential M&A targets
Determine your own vulnerability to an unwanted bid
GIAF USA Winter 2015 - Measuring collaboration in a multiplayer gameLauren Cormack
Measuring collaboration in a multiplayer game by Dierdre Kerr, Associate Research Scientist at Educational Testing Service (ETS).
The kind of collaborator an individual is can have a huge impact on not only their game experience, but their teammates’ experiences as well. However, determining this solely from in-game behavior can be a difficult task. In this talk, you will hear about the different types of collaborative behavior anticipated in game environments, how evidence about an individual’s collaboration type can be identified from the log data, and how that evidence might be used to create a better player experience.
Business Analytics, "Second Edition teaches the fundamental concepts of the emerging field of business analytics and provides vital tools in understanding how data analysis works in today s organizations. Students will learn to apply basic business analytics principles, communicate with analytics professionals, and effectively use and interpret analytic models to make better business decisions. Included access to commercial grade analytics software gives students real-world experience and career-focused value. Author James Evans takes a balanced, holistic approach and looks at business analytics from descriptive, and predictive perspectives.
Slides used for a presentation to introduce the field of business analytics. Covers what BA is, how it is a part of business intelligence, and what areas make up BA.
Start With Why: Build Product Progress with a Strong Data CultureAggregage
Have you ever thought your product's progress was headed in one direction, and been shocked to see a different story reflected in big picture KPIs like revenue? It can be confusing when customer feedback or metrics like registration or retention are painting a different picture. No matter how sophisticated your analytics are, if you're asking the wrong questions - or looking at the wrong metrics - you're going to have trouble getting answers that can help you.
Join Nima Gardideh, CTO of Pearmill, as he demonstrates how to build a strong data culture within your team, so everyone understands which metrics they should actually focus on - and why. Then, he'll explain how you can use your analytics to regularly review progress and successes. Finally, he'll discuss what you should keep in mind when instrumenting your analytics.
Start With Why: Build Product Progress with a Strong Data CultureBrittanyShear
Have you ever thought your product's progress was headed in one direction, and been shocked to see a different story reflected in big picture KPIs like revenue? It can be confusing when customer feedback or metrics like registration or retention are painting a different picture. No matter how sophisticated your analytics are, if you're asking the wrong questions - or looking at the wrong metrics - you're going to have trouble getting answers that can help you.
Join Nima Gardideh, CTO of Pearmill, as he demonstrates how to build a strong data culture within your team, so everyone understands which metrics they should actually focus on - and why. Then, he'll explain how you can use your analytics to regularly review progress and successes. Finally, he'll discuss what you should keep in mind when instrumenting your analytics.
In the fast-changing world of corporate recruiting, it’s important to be aware of and prepared for the problems and opportunities that you will soon face. In short, because it’s “better to be prepared than surprised”, both recruiting and hiring managers must find a way to be “proactive” in planning for these upcoming events, rather than being “reactive”. The most effective way to identify trends and to predict upcoming recruiting issues is through the use of analytics and predictive metrics This advanced webinar will be led by long time ERE.net author and global metrics expert Dr. John Sullivan. He will guide you through the goals, the action steps and the best emerging corporate practices in predictive recruiting metrics.
Data Science. Business Analytics is the statistical study of business data to gain insights. Data science is the study of data using statistics, algorithms and technology. Uses mostly structured data. Uses both structured and unstructured data.
Data Science - Part I - Sustaining Predictive Analytics CapabilitiesDerek Kane
This is the first lecture in a series of data analytics topics and geared to individuals and business professionals who have no understand of building modern analytics approaches. This lecture provides an overview of the models and techniques we will address throughout the lecture series, we will discuss Business Intelligence topics, predictive analytics, and big data technologies. Finally, we will walk through a simple yet effective example which showcases the potential of predictive analytics in a business context.
Chapter 3: Data Analysis or Interpretation of DataEmilyDagami
This is for Inquiries, Investigation, and Immersion Senior High School grade 12 learners and teachers: Chapter 3: Data Analysis or Interpretation of Data. Data analysis is the process of cleaning, analyzing, interpreting, and visualizing data using various techniques and business intelligence tools. Data analysis tools help you discover relevant insights that lead to smarter and more effective decision-making. "It is a capital mistake to theorize before one has data. Insensibly one begins to twist facts to suit theories, instead of theories to suit facts," Sherlock Holme's proclaims in Sir Arthur Conan Doyle's A Scandal in Bohemia.
This idea lies at the root of data analysis. When we can extract meaning from data, it empowers us to make better decisions. And we’re living in a time when we have more data than ever at our fingertips.
Framework for creating Analytics that delivers cost effective Value. From what to output, to how to scale and motivate a team, passing through data acquisition. Analytics has become a critical asset for the most competitive organizations; practitioners must ensure their ability to create and communicate insight, especially the most senior decision-makers is effective and efficient.
Keep a Pulse: Turning Data into Relationship Insights and (Automated) ActionTALiNT Partners
Sinéad Daly, Regional Manager for UK & Ireland, Bullhorn
- Are you working harder OR smarter? The technology and subsequent data at our fingertips creates boundless opportunities and valuable insights if harnessed properly
- However, with endless requests from clients, candidates, and internal employees, it’s difficult to slow down to evaluate, set strategy and execute. In this session
-We will share tips on leveraging the data from your ATS and CRM to drive (and potentially automate) activity to increase both efficiency and results.
Data analytics presentation- Management career institute PoojaPatidar11
1. The basic definition of Data, Analytics, and Data Analytics
2. Definition: Data: Data is a set of values of qualitative or quantitative variables. It is information in the raw or unorganized form. It may be a fact, figure, characters, symbols etc
Analytics: Analytics is the discovery, interpretation, and communication of meaningful patterns in data and applying those patterns towards effective decision making.
Data Analytics: Data analytics refers to qualitative and quantitative techniques and processes used to enhance productivity and business gain.
3.Types of analytics: Predictive Analytics (What could happen?)
Prescriptive Analytics (What should we do)
Descriptive Analytics (What has happened?)
4.Why Data analytics? Data Analytics is needed in Business to Consumer applications (B2C)
5.The process of Data analytics: Data requirements,
Data collection, Data processing, Data cleaning, Exploratory data analysis,
Modeling and algorithms, Data product, Communication
6.The scope of Data Analytics: Bright future of data analytics, many professionals and students are interested in a career in data analytics.
7.Importance of data analytics:1. Predict customer trends and behaviors
Analyze,
2 interpret and deliver data in meaningful ways
3.Increase business productivity
4.Drive effective decision-making
8.why become a data analyst? talented gaps of skill candidates, good salaries for freshers, great future growth path
9. What recruiters look for in applicants: Problem-Solving Skills, Analytical Mind, Maths and Statistic Skills, Communication (both oral and written), Teamwork Abilities
10. Skill is required for Data analytics?
1.) Analytical Skills
2.) Numeracy Skills
3.) Technical and Computer Skills
4.) Attention to Details
5.) Business Skills
6.) Communication Skills
11. Data analytics tools
1.SAS: SAS (Statistical Analysis System) is a software suite developed by SAS Institute. sas language can be defined as a programming language in the computing field. This language is generally used for the purpose of statistical analysis. The language has the ability to read data from databases and common spreadsheets.
2. R: R is a programming language and software environment for statistical analysis, graphics representation and reporting.R is freely available under the GNU General Public License, and pre-compiled binary versions are provided for various operating systems like Linux, Windows, and Mac.
3.PYTHON: Python is a popular programming language Python is a powerful, flexible, open-sources language that is easy to use,
and has a powerful library for data manipulation and analysis.
4.TABLEAU: Tableau Software is a software company that produces interactive data visualization products focused on business intelligence.
Similar to 
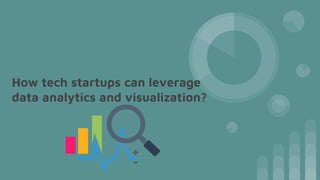
How tech startups can leverage data analytics and visualization (20)
Levelwise PageRank with Loop-Based Dead End Handling Strategy : SHORT REPORT ...Subhajit Sahu
Abstract — Levelwise PageRank is an alternative method of PageRank computation which decomposes the input graph into a directed acyclic block-graph of strongly connected components, and processes them in topological order, one level at a time. This enables calculation for ranks in a distributed fashion without per-iteration communication, unlike the standard method where all vertices are processed in each iteration. It however comes with a precondition of the absence of dead ends in the input graph. Here, the native non-distributed performance of Levelwise PageRank was compared against Monolithic PageRank on a CPU as well as a GPU. To ensure a fair comparison, Monolithic PageRank was also performed on a graph where vertices were split by components. Results indicate that Levelwise PageRank is about as fast as Monolithic PageRank on the CPU, but quite a bit slower on the GPU. Slowdown on the GPU is likely caused by a large submission of small workloads, and expected to be non-issue when the computation is performed on massive graphs.
Data Centers - Striving Within A Narrow Range - Research Report - MCG - May 2...pchutichetpong
M Capital Group (“MCG”) expects to see demand and the changing evolution of supply, facilitated through institutional investment rotation out of offices and into work from home (“WFH”), while the ever-expanding need for data storage as global internet usage expands, with experts predicting 5.3 billion users by 2023. These market factors will be underpinned by technological changes, such as progressing cloud services and edge sites, allowing the industry to see strong expected annual growth of 13% over the next 4 years.
Whilst competitive headwinds remain, represented through the recent second bankruptcy filing of Sungard, which blames “COVID-19 and other macroeconomic trends including delayed customer spending decisions, insourcing and reductions in IT spending, energy inflation and reduction in demand for certain services”, the industry has seen key adjustments, where MCG believes that engineering cost management and technological innovation will be paramount to success.
MCG reports that the more favorable market conditions expected over the next few years, helped by the winding down of pandemic restrictions and a hybrid working environment will be driving market momentum forward. The continuous injection of capital by alternative investment firms, as well as the growing infrastructural investment from cloud service providers and social media companies, whose revenues are expected to grow over 3.6x larger by value in 2026, will likely help propel center provision and innovation. These factors paint a promising picture for the industry players that offset rising input costs and adapt to new technologies.
According to M Capital Group: “Specifically, the long-term cost-saving opportunities available from the rise of remote managing will likely aid value growth for the industry. Through margin optimization and further availability of capital for reinvestment, strong players will maintain their competitive foothold, while weaker players exit the market to balance supply and demand.”
Opendatabay - Open Data Marketplace.pptxOpendatabay
Opendatabay.com unlocks the power of data for everyone. Open Data Marketplace fosters a collaborative hub for data enthusiasts to explore, share, and contribute to a vast collection of datasets.
First ever open hub for data enthusiasts to collaborate and innovate. A platform to explore, share, and contribute to a vast collection of datasets. Through robust quality control and innovative technologies like blockchain verification, opendatabay ensures the authenticity and reliability of datasets, empowering users to make data-driven decisions with confidence. Leverage cutting-edge AI technologies to enhance the data exploration, analysis, and discovery experience.
From intelligent search and recommendations to automated data productisation and quotation, Opendatabay AI-driven features streamline the data workflow. Finding the data you need shouldn't be a complex. Opendatabay simplifies the data acquisition process with an intuitive interface and robust search tools. Effortlessly explore, discover, and access the data you need, allowing you to focus on extracting valuable insights. Opendatabay breaks new ground with a dedicated, AI-generated, synthetic datasets.
Leverage these privacy-preserving datasets for training and testing AI models without compromising sensitive information. Opendatabay prioritizes transparency by providing detailed metadata, provenance information, and usage guidelines for each dataset, ensuring users have a comprehensive understanding of the data they're working with. By leveraging a powerful combination of distributed ledger technology and rigorous third-party audits Opendatabay ensures the authenticity and reliability of every dataset. Security is at the core of Opendatabay. Marketplace implements stringent security measures, including encryption, access controls, and regular vulnerability assessments, to safeguard your data and protect your privacy.
Chatty Kathy - UNC Bootcamp Final Project Presentation - Final Version - 5.23...John Andrews
SlideShare Description for "Chatty Kathy - UNC Bootcamp Final Project Presentation"
Title: Chatty Kathy: Enhancing Physical Activity Among Older Adults
Description:
Discover how Chatty Kathy, an innovative project developed at the UNC Bootcamp, aims to tackle the challenge of low physical activity among older adults. Our AI-driven solution uses peer interaction to boost and sustain exercise levels, significantly improving health outcomes. This presentation covers our problem statement, the rationale behind Chatty Kathy, synthetic data and persona creation, model performance metrics, a visual demonstration of the project, and potential future developments. Join us for an insightful Q&A session to explore the potential of this groundbreaking project.
Project Team: Jay Requarth, Jana Avery, John Andrews, Dr. Dick Davis II, Nee Buntoum, Nam Yeongjin & Mat Nicholas
Techniques to optimize the pagerank algorithm usually fall in two categories. One is to try reducing the work per iteration, and the other is to try reducing the number of iterations. These goals are often at odds with one another. Skipping computation on vertices which have already converged has the potential to save iteration time. Skipping in-identical vertices, with the same in-links, helps reduce duplicate computations and thus could help reduce iteration time. Road networks often have chains which can be short-circuited before pagerank computation to improve performance. Final ranks of chain nodes can be easily calculated. This could reduce both the iteration time, and the number of iterations. If a graph has no dangling nodes, pagerank of each strongly connected component can be computed in topological order. This could help reduce the iteration time, no. of iterations, and also enable multi-iteration concurrency in pagerank computation. The combination of all of the above methods is the STICD algorithm. [sticd] For dynamic graphs, unchanged components whose ranks are unaffected can be skipped altogether.
As Europe's leading economic powerhouse and the fourth-largest hashtag#economy globally, Germany stands at the forefront of innovation and industrial might. Renowned for its precision engineering and high-tech sectors, Germany's economic structure is heavily supported by a robust service industry, accounting for approximately 68% of its GDP. This economic clout and strategic geopolitical stance position Germany as a focal point in the global cyber threat landscape.
In the face of escalating global tensions, particularly those emanating from geopolitical disputes with nations like hashtag#Russia and hashtag#China, hashtag#Germany has witnessed a significant uptick in targeted cyber operations. Our analysis indicates a marked increase in hashtag#cyberattack sophistication aimed at critical infrastructure and key industrial sectors. These attacks range from ransomware campaigns to hashtag#AdvancedPersistentThreats (hashtag#APTs), threatening national security and business integrity.
🔑 Key findings include:
🔍 Increased frequency and complexity of cyber threats.
🔍 Escalation of state-sponsored and criminally motivated cyber operations.
🔍 Active dark web exchanges of malicious tools and tactics.
Our comprehensive report delves into these challenges, using a blend of open-source and proprietary data collection techniques. By monitoring activity on critical networks and analyzing attack patterns, our team provides a detailed overview of the threats facing German entities.
This report aims to equip stakeholders across public and private sectors with the knowledge to enhance their defensive strategies, reduce exposure to cyber risks, and reinforce Germany's resilience against cyber threats.
2. Today's key discussion points
1. What is data?
2. Importance of having meaningful data?
3. Tech startup - Data driven business decision
4. Lean Analytics
5. Importance of data visualization
6. Let’s get technical
7. Conclusion
8. Share your experience
3. Who are we?
Vish
● Data scientist and software
developer at Explorate.
● Masters in Data Science at
Queensland University of Technology
(QUT).
● Current interest - Statistical data
analysis in R programming language.
www.linkedin.com/in/vishanthbala
Abi
● Business analysis consultant at
BAPL.
● 6 years experience as Business
analyst and consultant.
● Current interest - robotic process
automation (RPA) and data
management.
www.linkedin.com/in/abisachi
4. 56% of SMEs rarely or infrequently
check their business’s data, while
3% have never looked at it at all.
(One Poll, 2018)
5. 40% of major decisions are
still based on your Manager’s
gut feeling.
(Accenture, 2019)
12. Importance of having meaningful data
On a high level, you can achieve two things with meaningful data;
1. Understanding your audience better. Learning about their needs, their
struggles, their motivations, their habits and their relationships to your
product or service.
2. Using this understanding to create a better product or service and turning
that into profit.
13. Importance of having meaningful data
The order is important!!
Understand
your customer
Create a better
service or
product
Turn that into
profit
17. Collect the Right Data
● Data is the foundation of your data analytics.
● Even the best analysts in the world won’t be able to do much for you if they
don’t have good data to work with.
“Deciding what data to collect is something you should research
and implement as early as possible….
….because the more good data you’ve collected, the more
effective your analysts can be in their analysis”.
18. What are the 5 metrics every start-up
should measure?
21. At the end of the day, there are no five
metrics that are relevant to every start-up.
It’s impossible!!
Every start-up is different, every entrepreneur
is different. We all have different goals and
different plans for achieving those goals.
26. Decision Tree - Pros and Cons
● Pros
○ Easy to understand
○ East to generate rules
● Cons
○ Sometime the tree can get very long
○ Easily can overfit (Pruning)
○ Not effective for continuous variables (May lose information)
31. What do we do when the dataset is
small?
N-Fold Validation
32. Top 3 Start-up Analytics Mistakes
1. Playing in Success Theatre
33. Top 3 Start-up Analytics Mistakes
2. Focusing Too Much on the Long-term or Short-term
34. Top 3 Start-up Analytics Mistakes
3. Collecting Data and Neglecting Action
35. Start-up Analytics Best Practices
1. Embrace Lean Start-up Analytics
2. Balance between short-term and long-term
3. Follow Dave McClure’s Start-up Metrics for Pirates (AARRR)
4. Deal only with important metrics
5. Ask WHY?