Download as PDF, PPTX
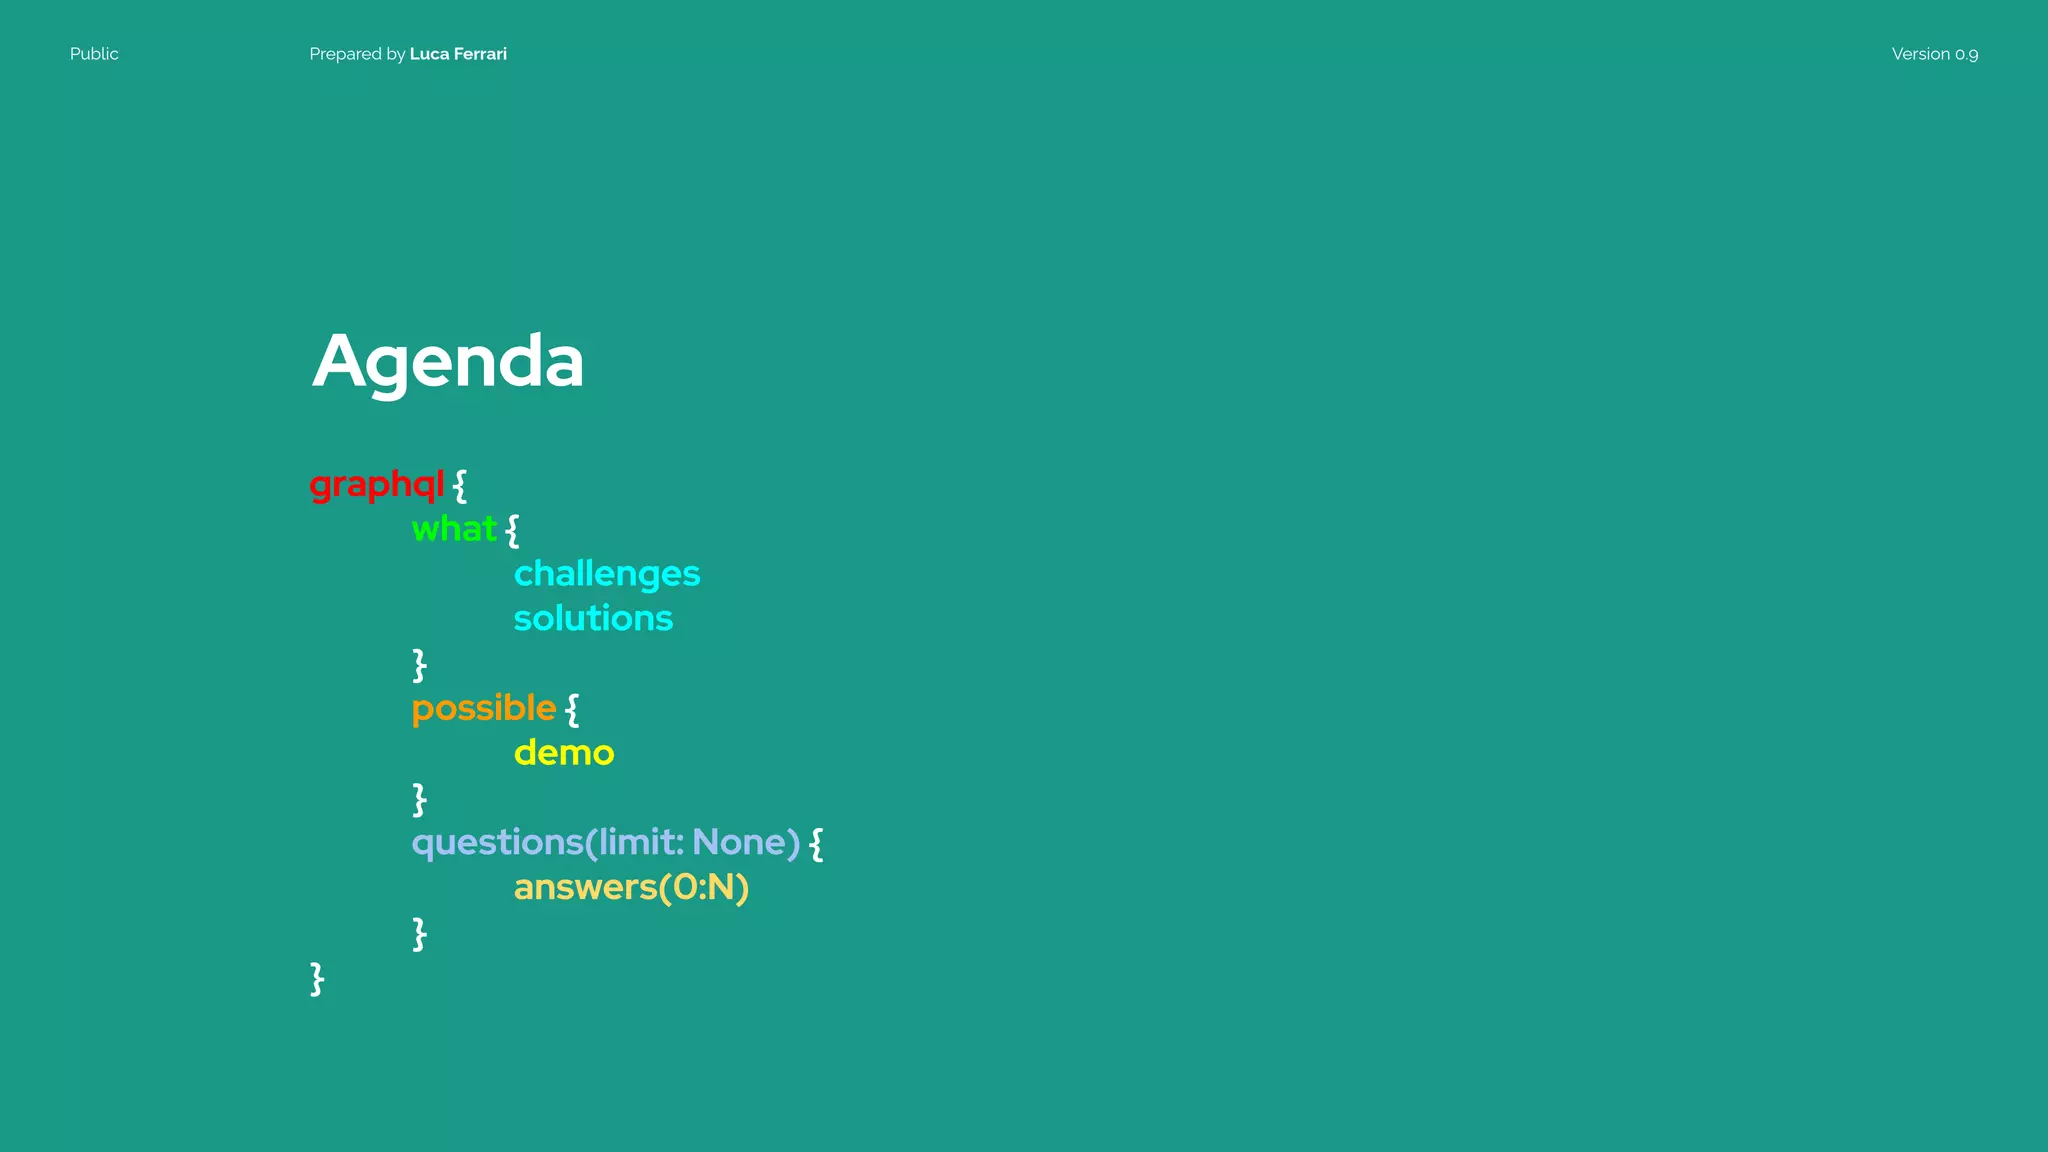
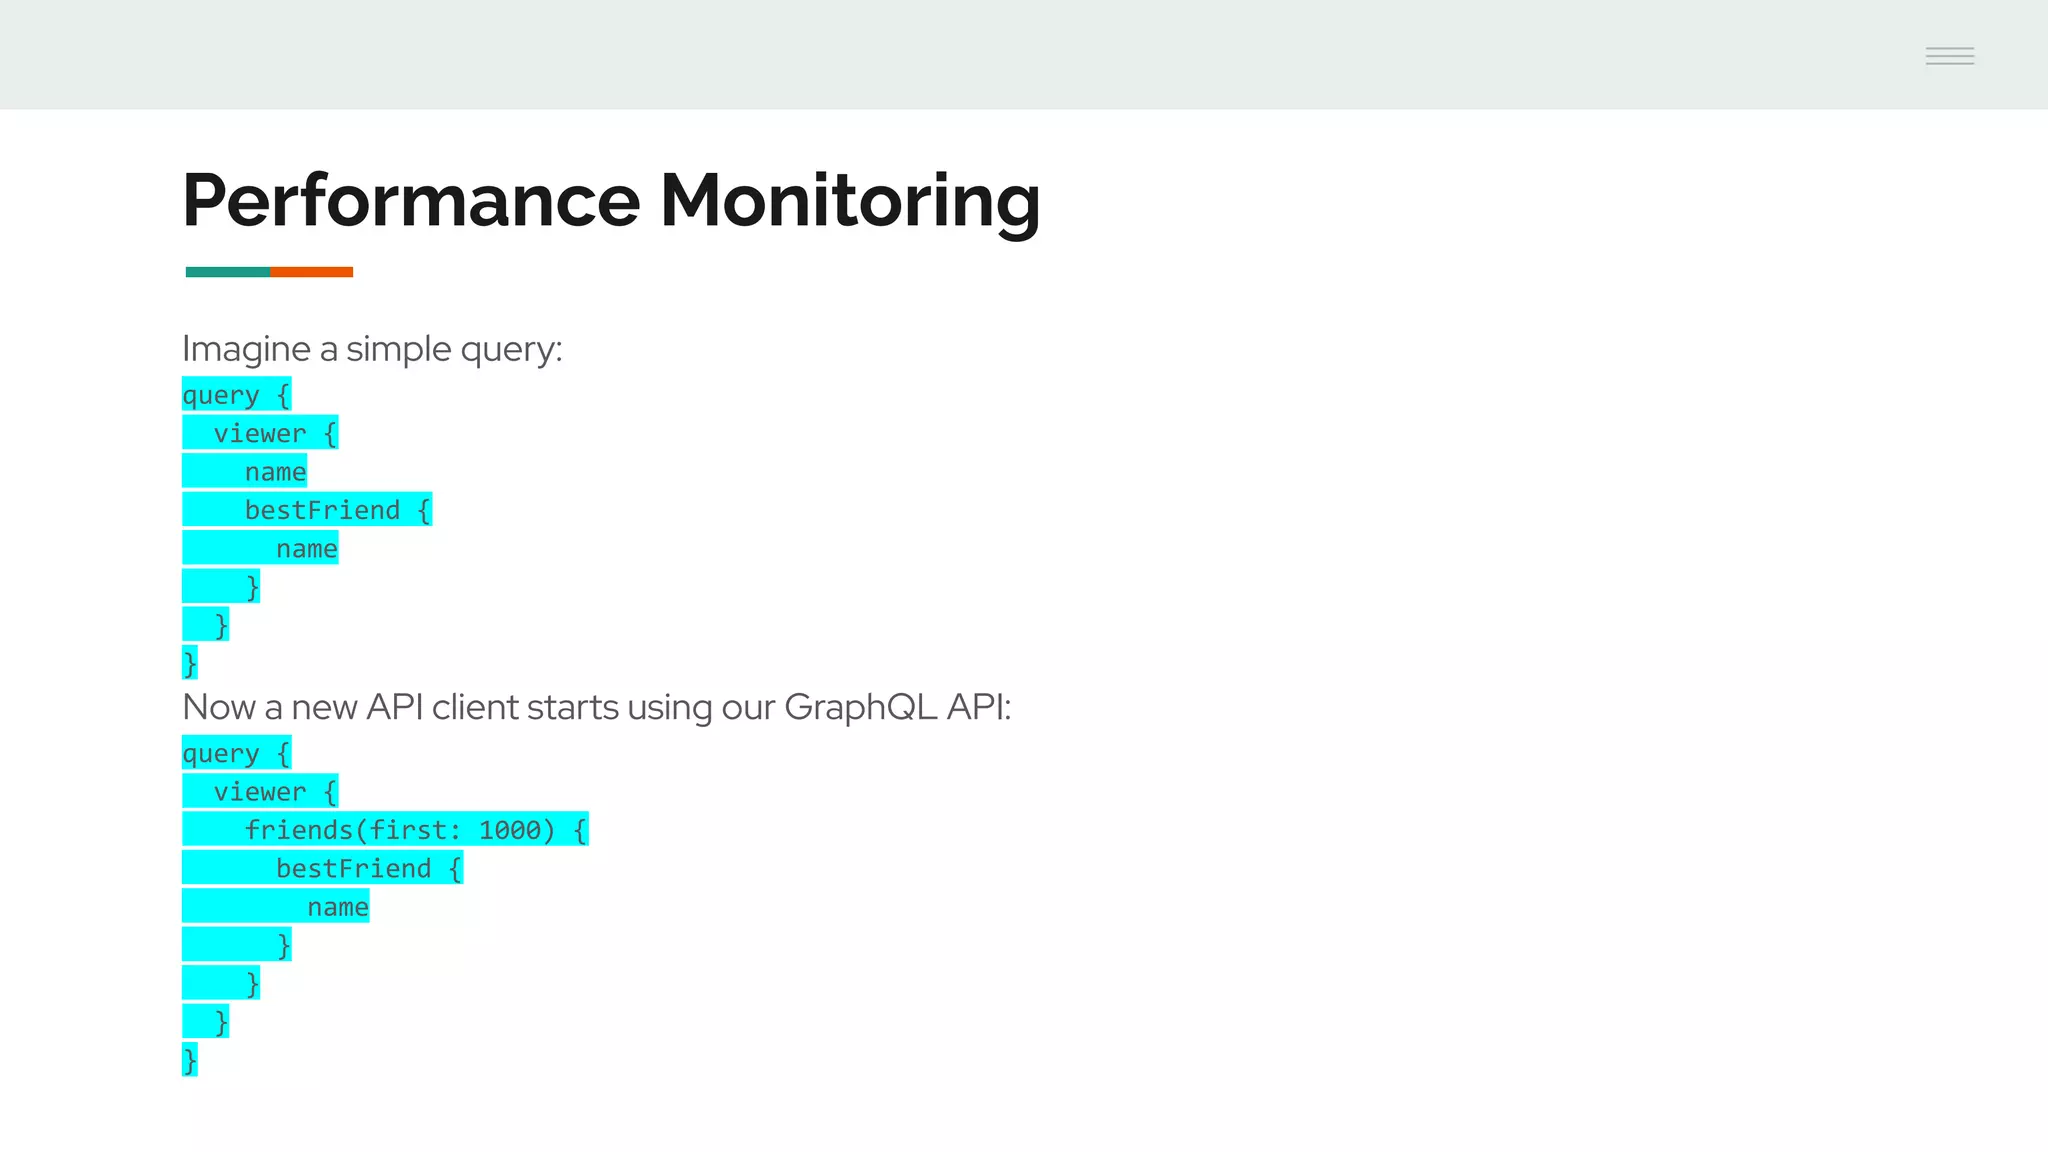

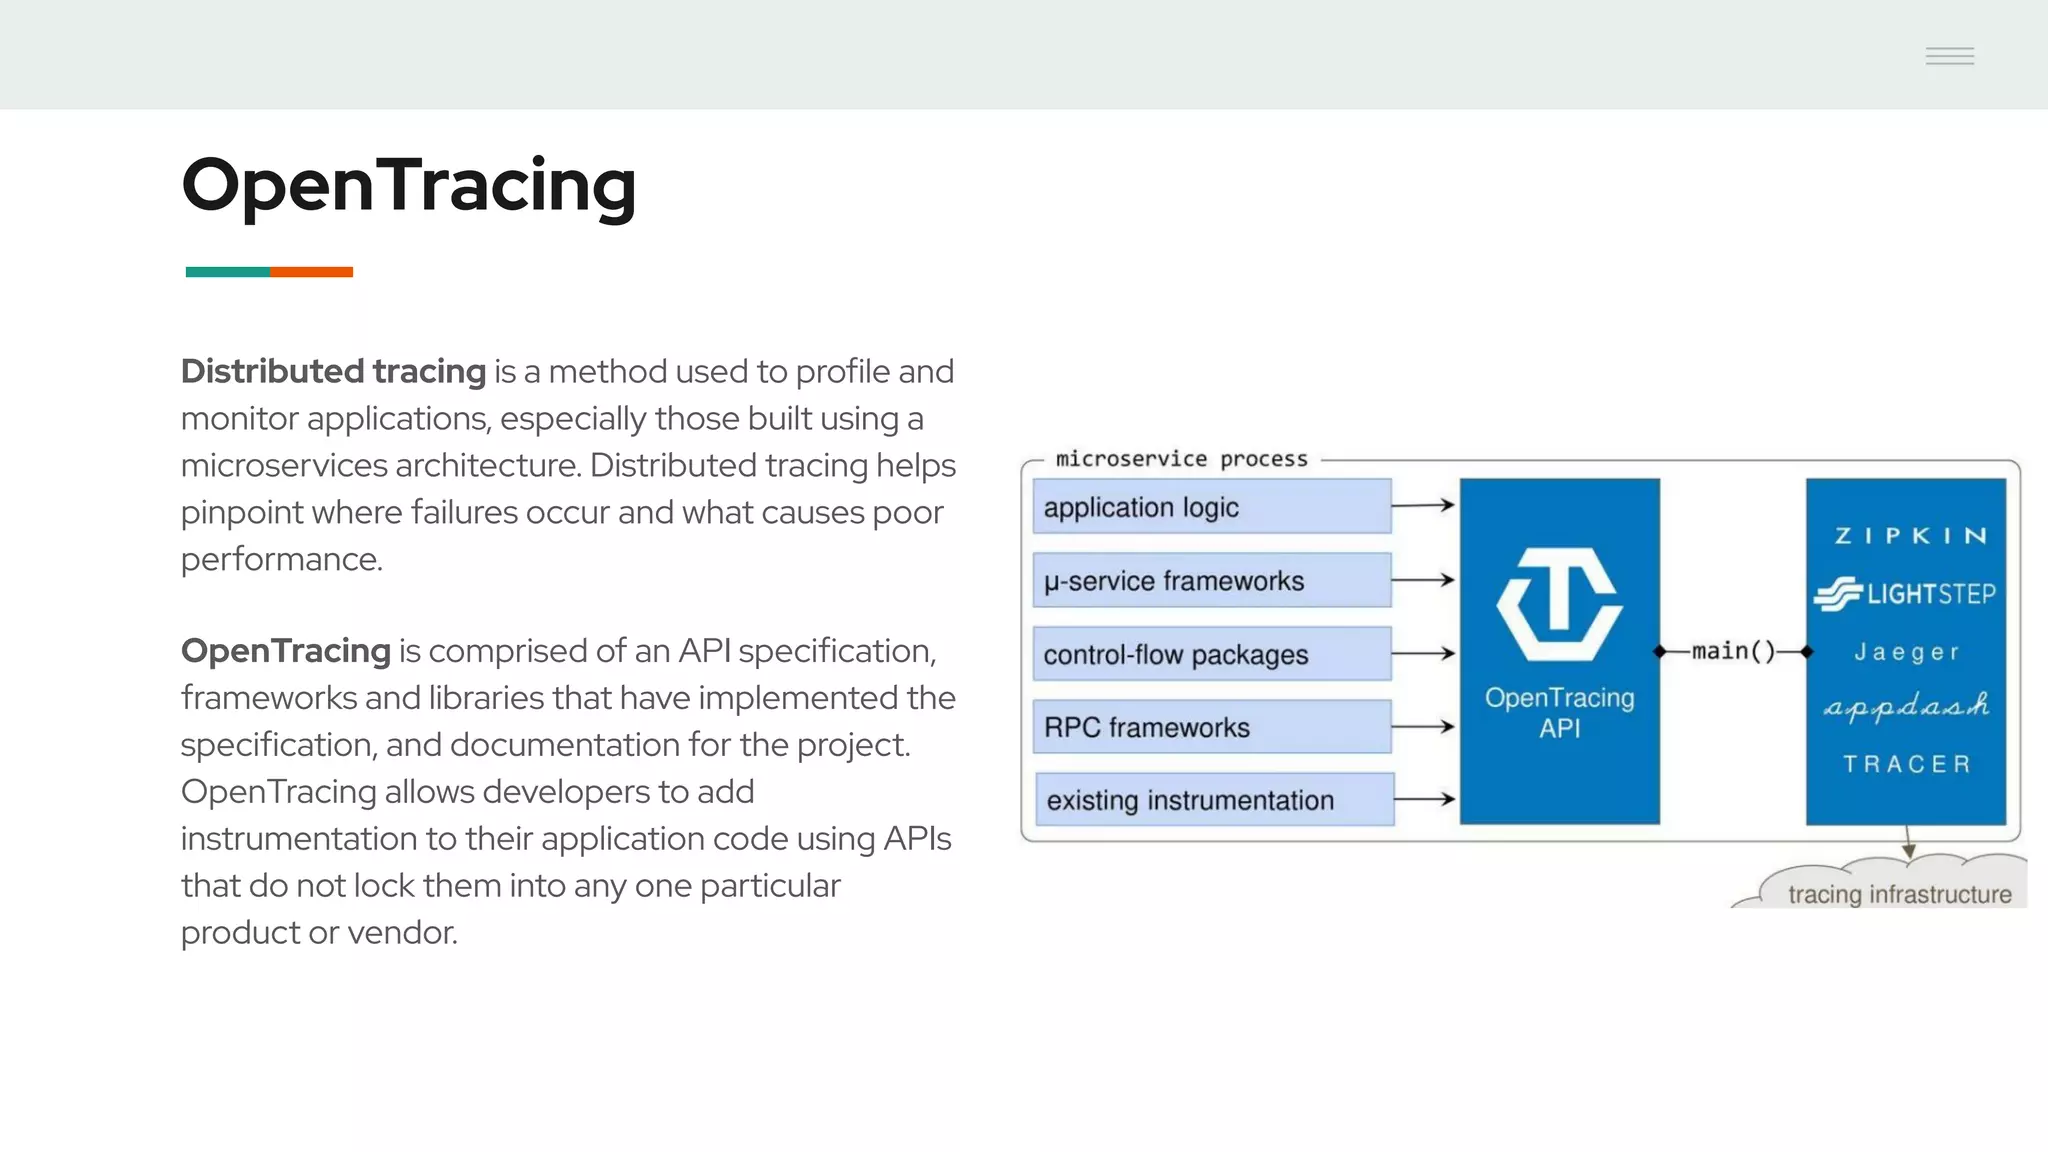
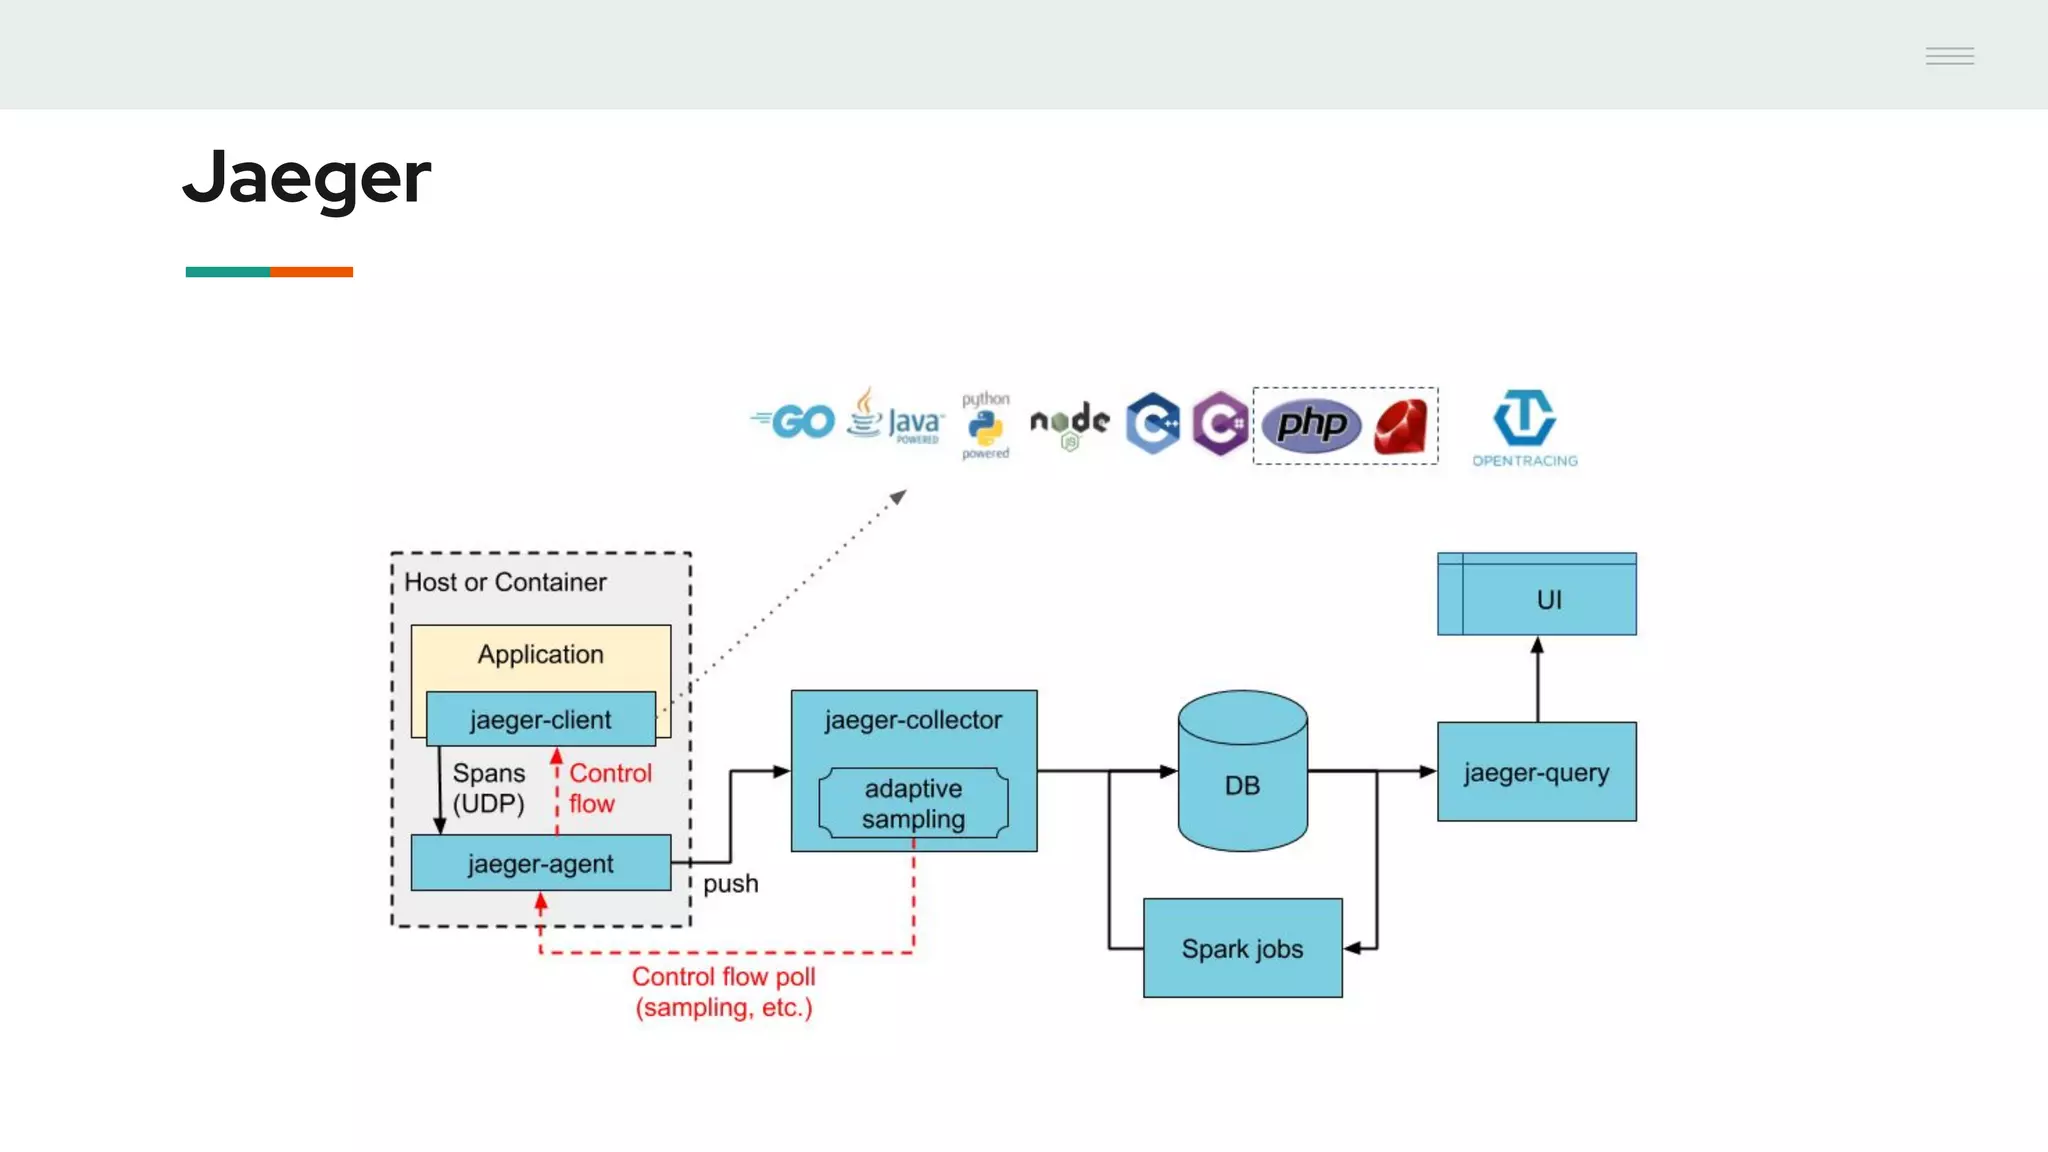
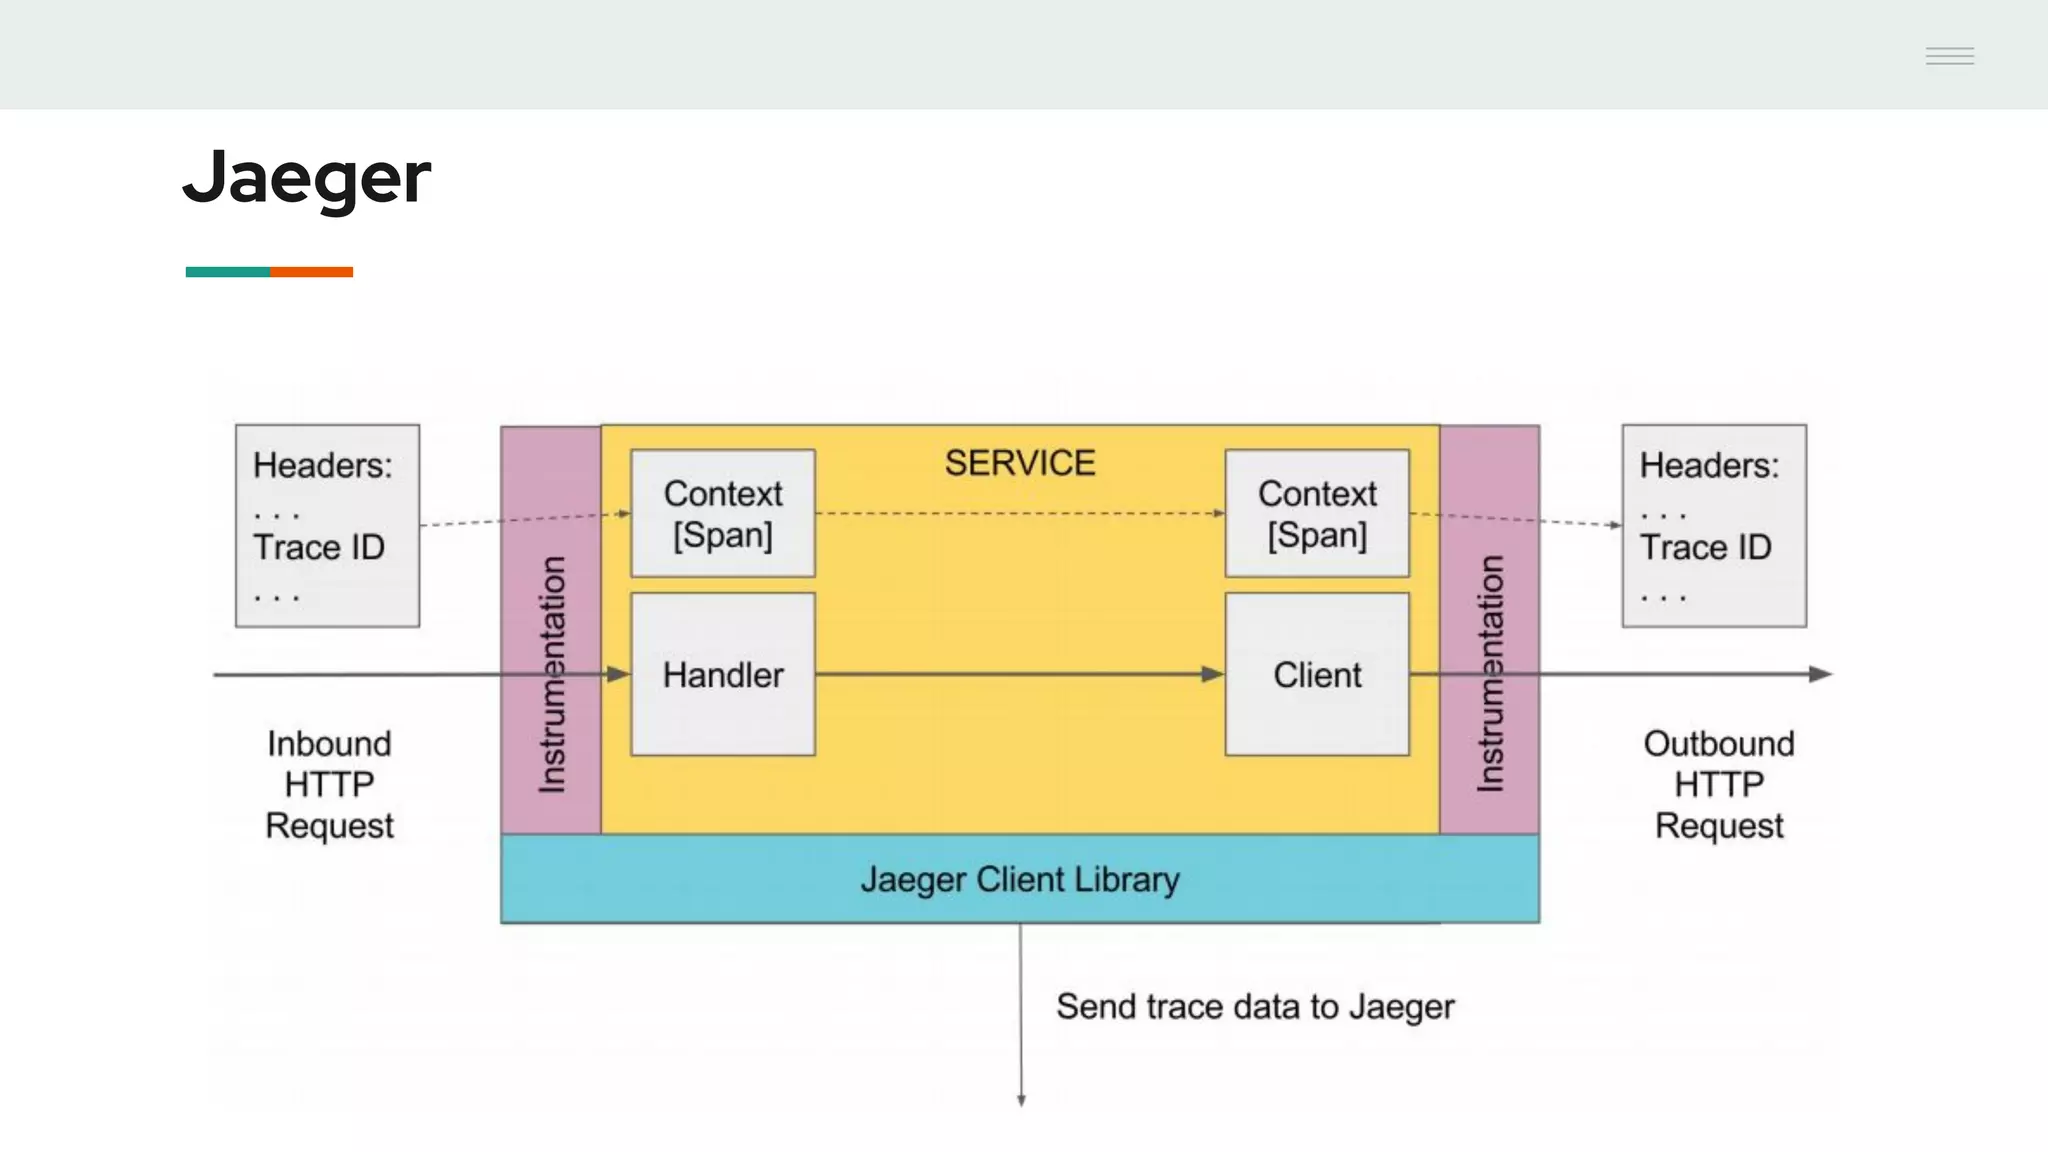

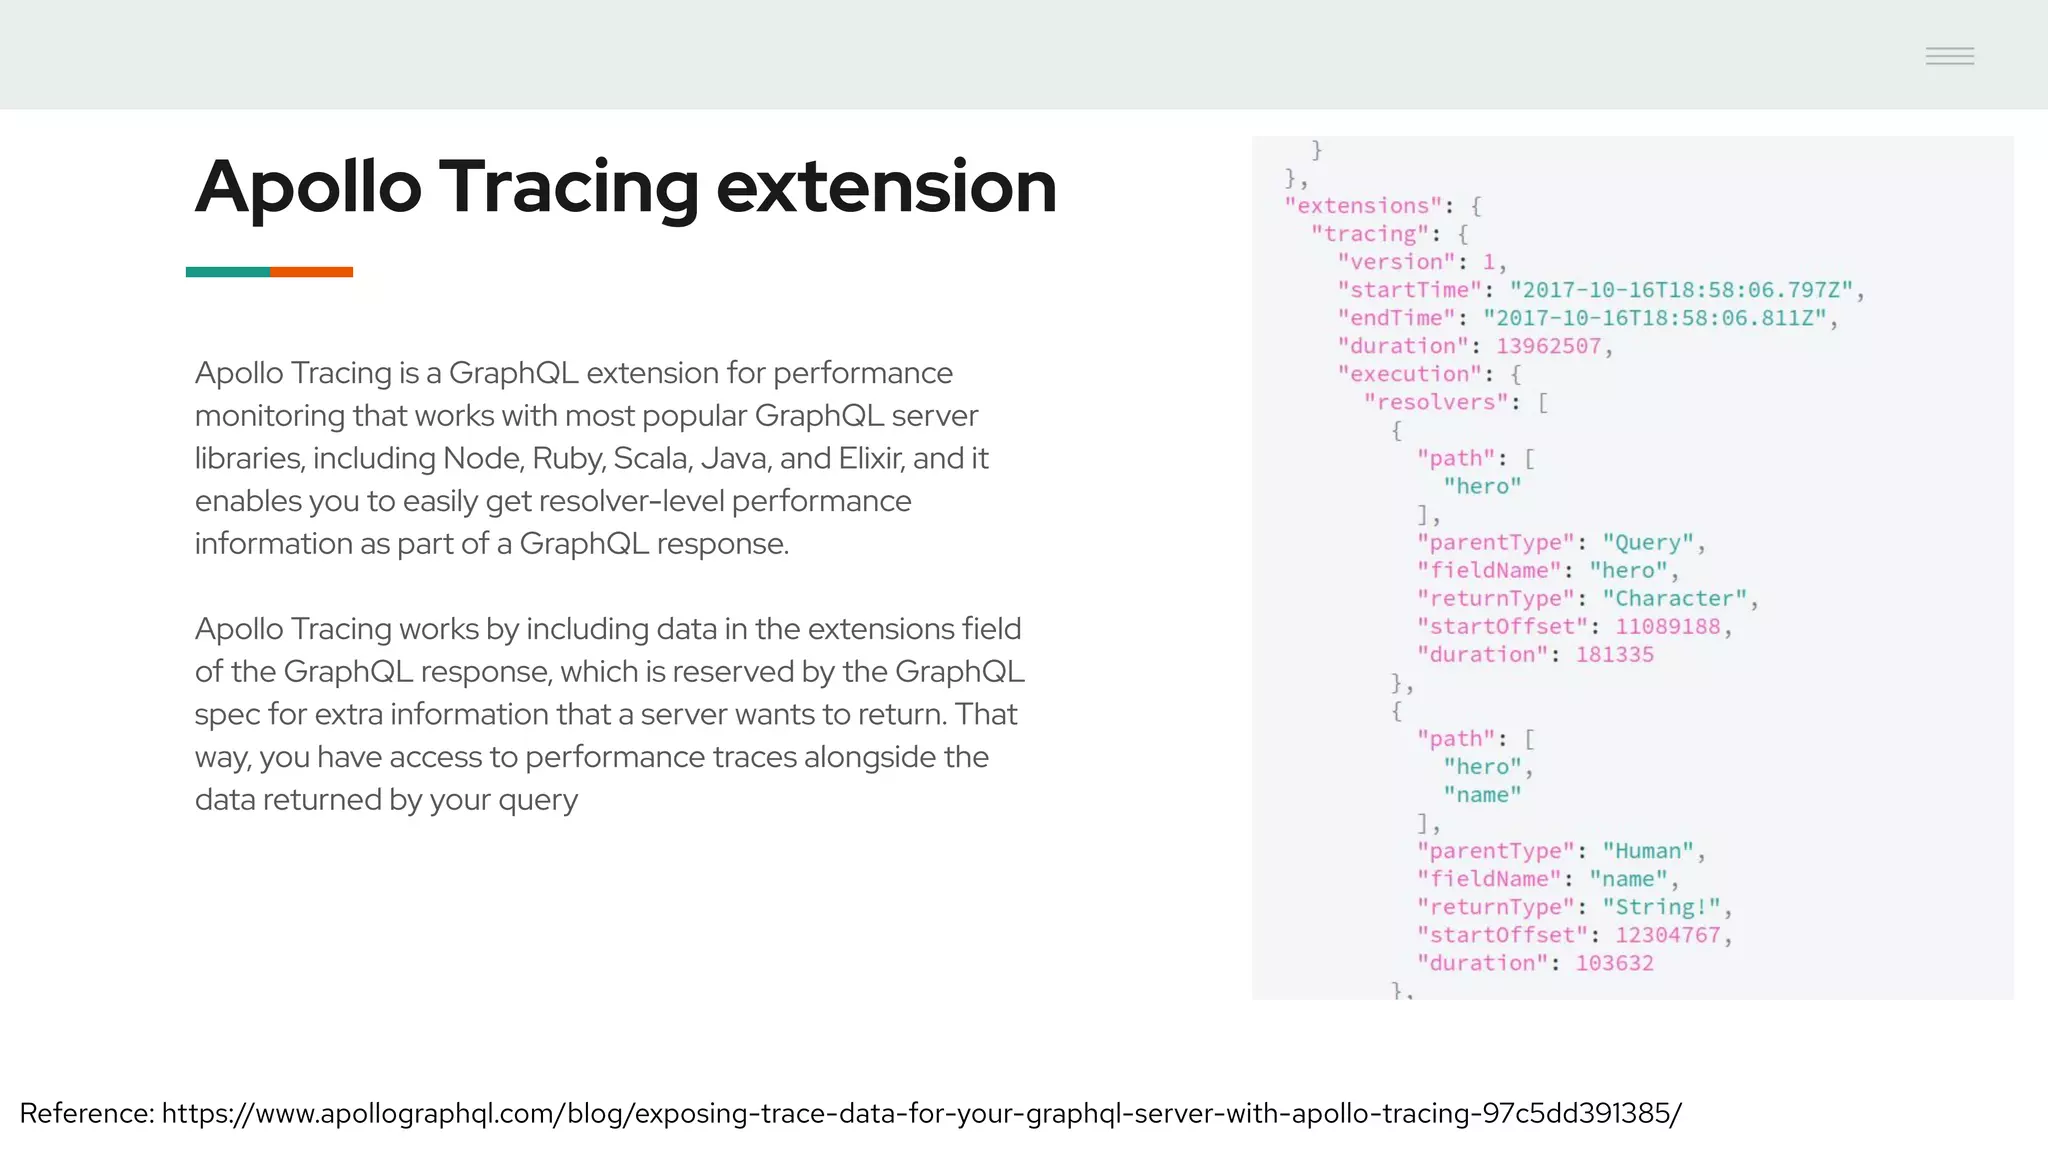
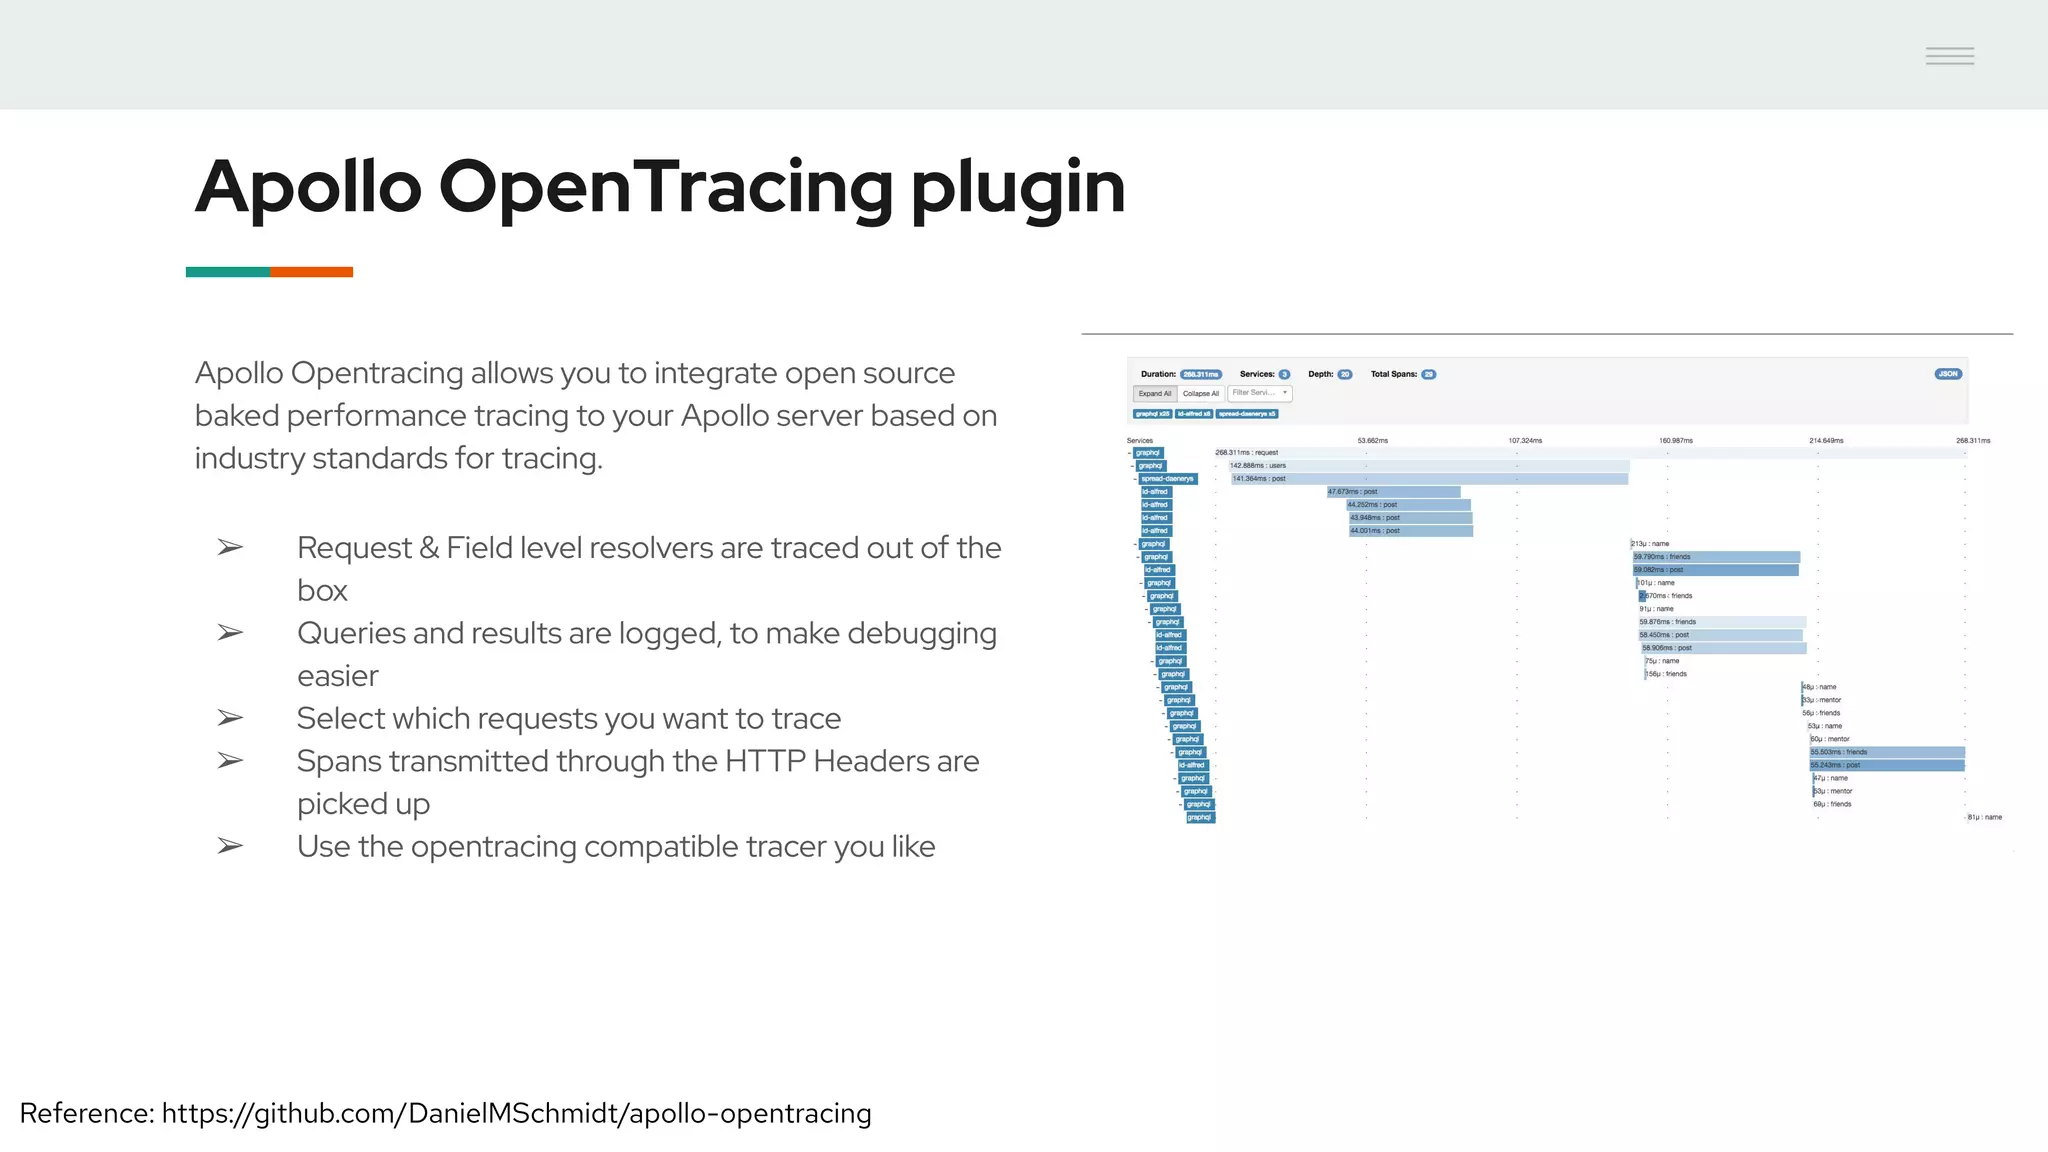
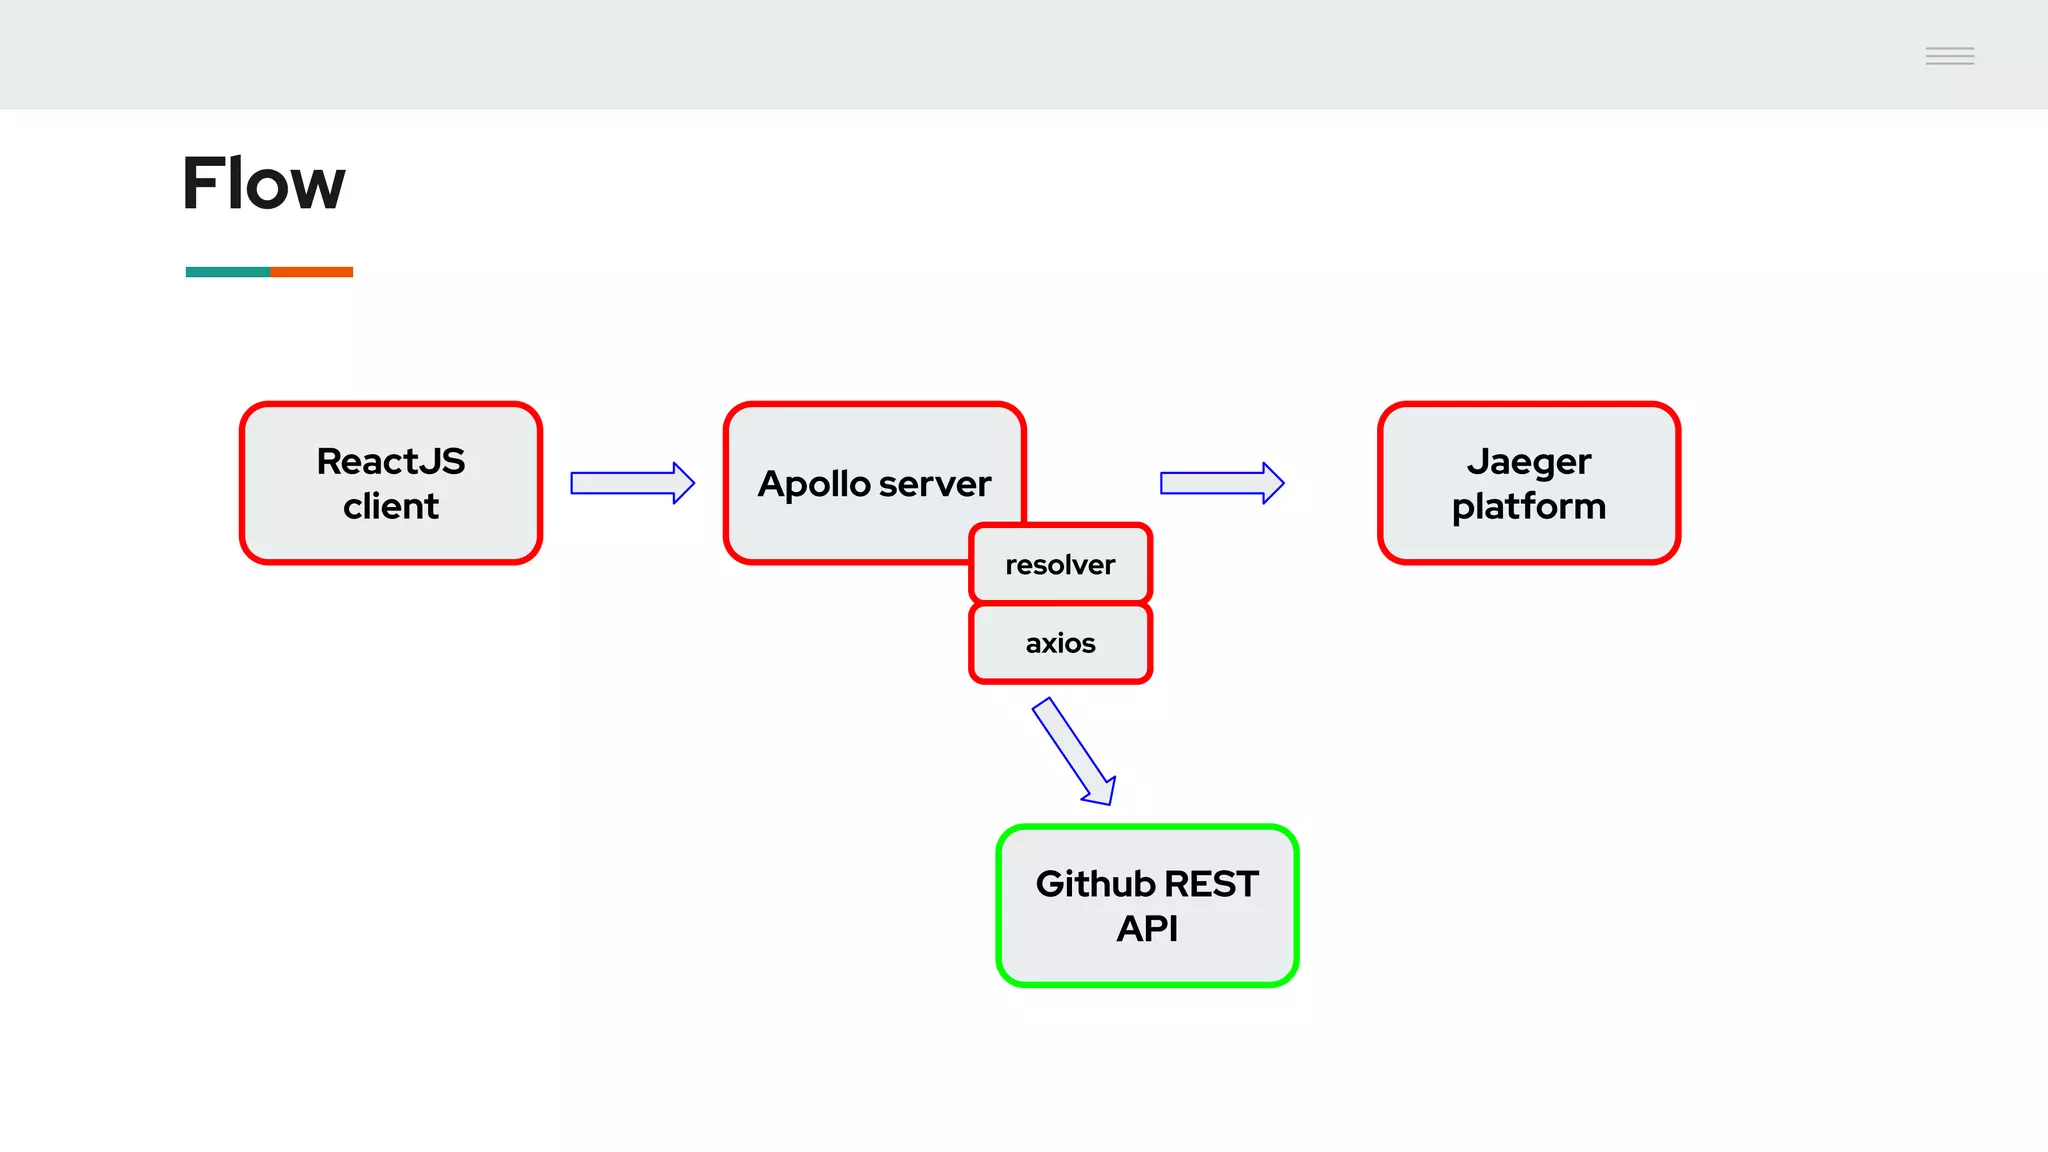


- GraphQL performance monitoring can be challenging as queries can vary significantly even when requesting the same data. Traditional endpoint monitoring provides little insight. - Distributed tracing using OpenTracing allows tracing queries to monitor performance at the resolver level. Tools like Jaeger and plugins for Apollo Server and other GraphQL servers can integrate tracing. - A demo showed using the Apollo OpenTracing plugin to trace a query through an Apollo server and resolver to an external API. The trace data was sent to Jaeger for analysis to help debug performance issues.