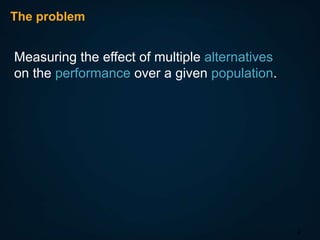
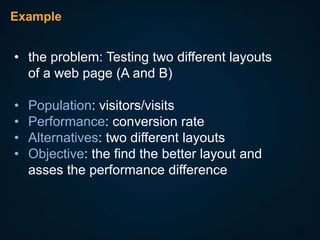
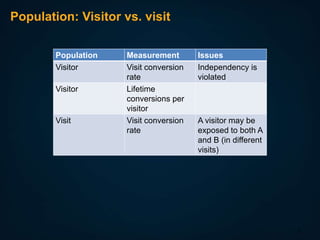
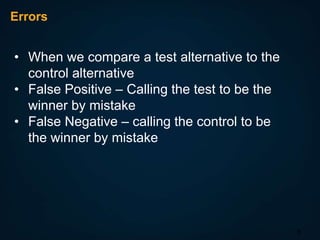
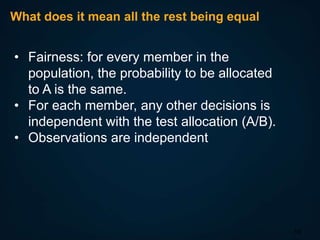
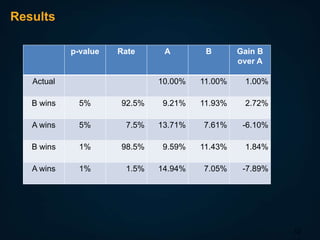
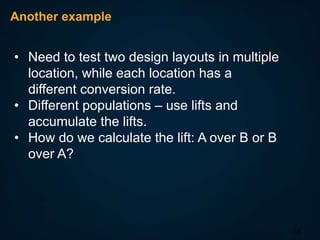
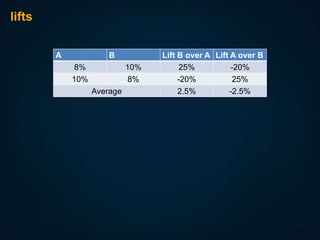
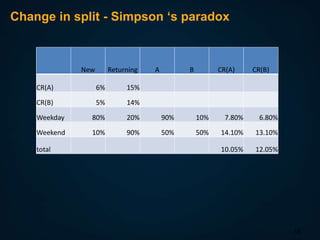
A/B testing
Shlomo Lahav
The problem

Measuring the effect of multiple alternatives
on the performance over a given population.

2
Performance

A list of objective measurements

3
Possible solutions

• A model that describe the results and
evaluates the marginal effect of the
alternatives
• Test the alternatives side by side while all
the rest is equal

4
Example

• the problem: Testing two different layouts
of a web page (A and B)
•
•
•
•

Population: visitors/visits
Performance: conversion rate
Alternatives: two different layouts
Objective: the find the better layout and
asses the performance difference

5
What does it mean all the rest being equal

• Fairness: for every member in the
population, the probability to be allocated
to A is the same.
• For each member, any other decisions is
independent with the test allocation (A/B).
• Observations are independent

6
Population: Visitor vs. visit
Population
Visitor

Visitor

Visit

Measurement
Visit conversion
rate
Lifetime
conversions per
visitor
Visit conversion
rate

Issues
Independency is
violated

A visitor may be
exposed to both A
and B (in different
visits)

7
Errors

• When we compare a test alternative to the
control alternative
• False Positive – Calling the test to be the
winner by mistake
• False Negative – calling the control to be
the winner by mistake

8
When do we end the test

• After a predefined period/observations.
• When the difference is significant

9
What does it mean all the rest being equal

• Fairness: for every member in the
population, the probability to be allocated
to A is the same.
• For each member, any other decisions is
independent with the test allocation (A/B).
• Observations are independent

10
Example

• We want to test two alternatives and
select the better one.
• The results are: CR(A)=9.21%,
CR(B)=11.93%. The win of B is statistical
significant (p-value<5%).
• We need to estimate the gain of B vs. A.
• Is our estimate of 2.72% a fair estimate?

11
Results
p-value

Rate

Actual

A

B

Gain B
over A

10.00%

11.00%

1.00%

B wins

5%

92.5%

9.21%

11.93%

2.72%

A wins

5%

7.5%

13.71%

7.61%

-6.10%

B wins

1%

98.5%

9.59%

11.43%

1.84%

A wins

1%

1.5%

14.94%

7.05%

-7.89%

12
Selection bias

• An AB test is conducted between A1,
A2,…,An
• After the test is completed, we select Ak.
• Should we expect Ak to perform as it did
during the test?
• Does the test outcome (the rank of k)
affects our expectation?

13
What else can go wrong?

• Independency is not maintained (traffic,
changes etc.)
• The fairness is handled by random
allocation. This can be biased due chance
• The significance level is usually higher
than planned (continues evaluation) which
results in a higher false positive.

14
How to control the traffic split?

• By percentage or round robin?
• Can we change the split?

15
Another example

• Need to test two design layouts in multiple
location, while each location has a
different conversion rate.
• Different populations – use lifts and
accumulate the lifts.
• How do we calculate the lift: A over B or B
over A?

16
lifts
A

B
8%
10%

10%
8%

Average

Lift B over A Lift A over B
25%
-20%
-20%
25%
2.5%
-2.5%

17
Change in split - Simpson ‘s paradox

New

Returning

A

B

CR(A)

CR(B)

CR(A)

6%

15%

CR(B)

5%

14%

Weekday

80%

20%

90%

10%

7.80%

6.80%

Weekend

10%

90%

50%

50%

14.10%

13.10%

10.05%

12.05%

total

18
Can we remove alternatives

• Start with 3 alternatives (equal split)
• Remove one

start

0

0

0.5

0.5

1

1

modify

0

0

0

1

1

1

19
Multiple tests

• Is it valid to run multiple AB tests
simultaneously?

20

How can A/B testing go wrong?

  • 1.
  • 2.
    The problem Measuring theeffect of multiple alternatives on the performance over a given population. 2
  • 3.
    Performance A list ofobjective measurements 3
  • 4.
    Possible solutions • Amodel that describe the results and evaluates the marginal effect of the alternatives • Test the alternatives side by side while all the rest is equal 4
  • 5.
    Example • the problem:Testing two different layouts of a web page (A and B) • • • • Population: visitors/visits Performance: conversion rate Alternatives: two different layouts Objective: the find the better layout and asses the performance difference 5
  • 6.
    What does itmean all the rest being equal • Fairness: for every member in the population, the probability to be allocated to A is the same. • For each member, any other decisions is independent with the test allocation (A/B). • Observations are independent 6
  • 7.
    Population: Visitor vs.visit Population Visitor Visitor Visit Measurement Visit conversion rate Lifetime conversions per visitor Visit conversion rate Issues Independency is violated A visitor may be exposed to both A and B (in different visits) 7
  • 8.
    Errors • When wecompare a test alternative to the control alternative • False Positive – Calling the test to be the winner by mistake • False Negative – calling the control to be the winner by mistake 8
  • 9.
    When do weend the test • After a predefined period/observations. • When the difference is significant 9
  • 10.
    What does itmean all the rest being equal • Fairness: for every member in the population, the probability to be allocated to A is the same. • For each member, any other decisions is independent with the test allocation (A/B). • Observations are independent 10
  • 11.
    Example • We wantto test two alternatives and select the better one. • The results are: CR(A)=9.21%, CR(B)=11.93%. The win of B is statistical significant (p-value<5%). • We need to estimate the gain of B vs. A. • Is our estimate of 2.72% a fair estimate? 11
  • 12.
    Results p-value Rate Actual A B Gain B over A 10.00% 11.00% 1.00% Bwins 5% 92.5% 9.21% 11.93% 2.72% A wins 5% 7.5% 13.71% 7.61% -6.10% B wins 1% 98.5% 9.59% 11.43% 1.84% A wins 1% 1.5% 14.94% 7.05% -7.89% 12
  • 13.
    Selection bias • AnAB test is conducted between A1, A2,…,An • After the test is completed, we select Ak. • Should we expect Ak to perform as it did during the test? • Does the test outcome (the rank of k) affects our expectation? 13
  • 14.
    What else cango wrong? • Independency is not maintained (traffic, changes etc.) • The fairness is handled by random allocation. This can be biased due chance • The significance level is usually higher than planned (continues evaluation) which results in a higher false positive. 14
  • 15.
    How to controlthe traffic split? • By percentage or round robin? • Can we change the split? 15
  • 16.
    Another example • Needto test two design layouts in multiple location, while each location has a different conversion rate. • Different populations – use lifts and accumulate the lifts. • How do we calculate the lift: A over B or B over A? 16
  • 17.
    lifts A B 8% 10% 10% 8% Average Lift B overA Lift A over B 25% -20% -20% 25% 2.5% -2.5% 17
  • 18.
    Change in split- Simpson ‘s paradox New Returning A B CR(A) CR(B) CR(A) 6% 15% CR(B) 5% 14% Weekday 80% 20% 90% 10% 7.80% 6.80% Weekend 10% 90% 50% 50% 14.10% 13.10% 10.05% 12.05% total 18
  • 19.
    Can we removealternatives • Start with 3 alternatives (equal split) • Remove one start 0 0 0.5 0.5 1 1 modify 0 0 0 1 1 1 19
  • 20.
    Multiple tests • Isit valid to run multiple AB tests simultaneously? 20