Downloaded 130 times
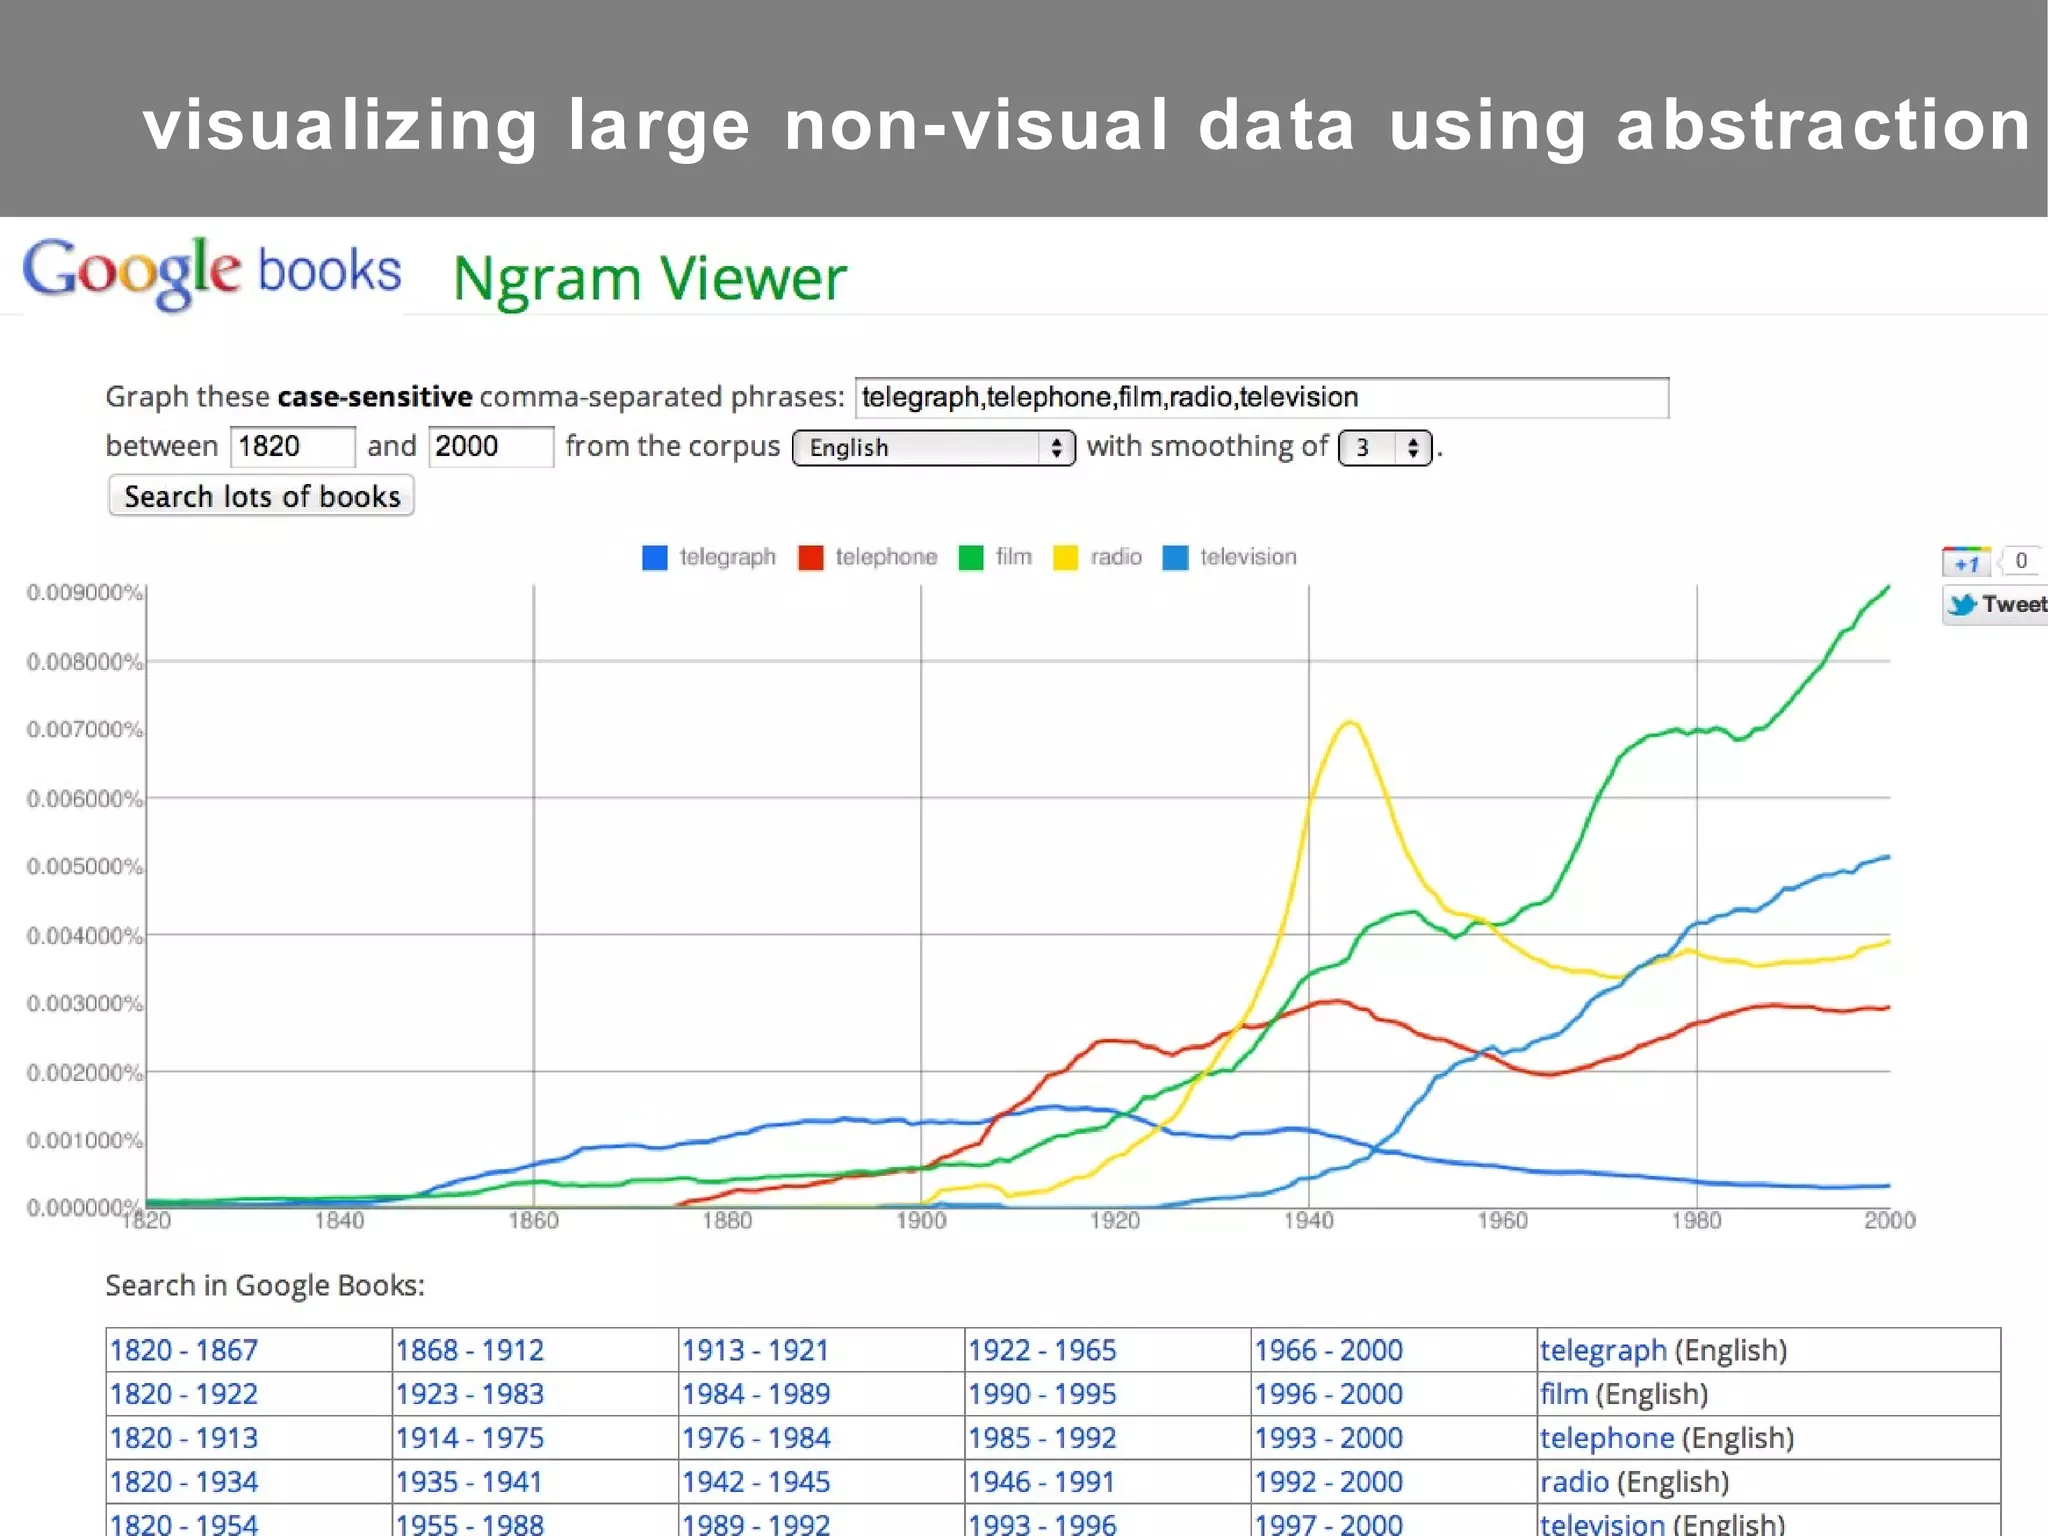
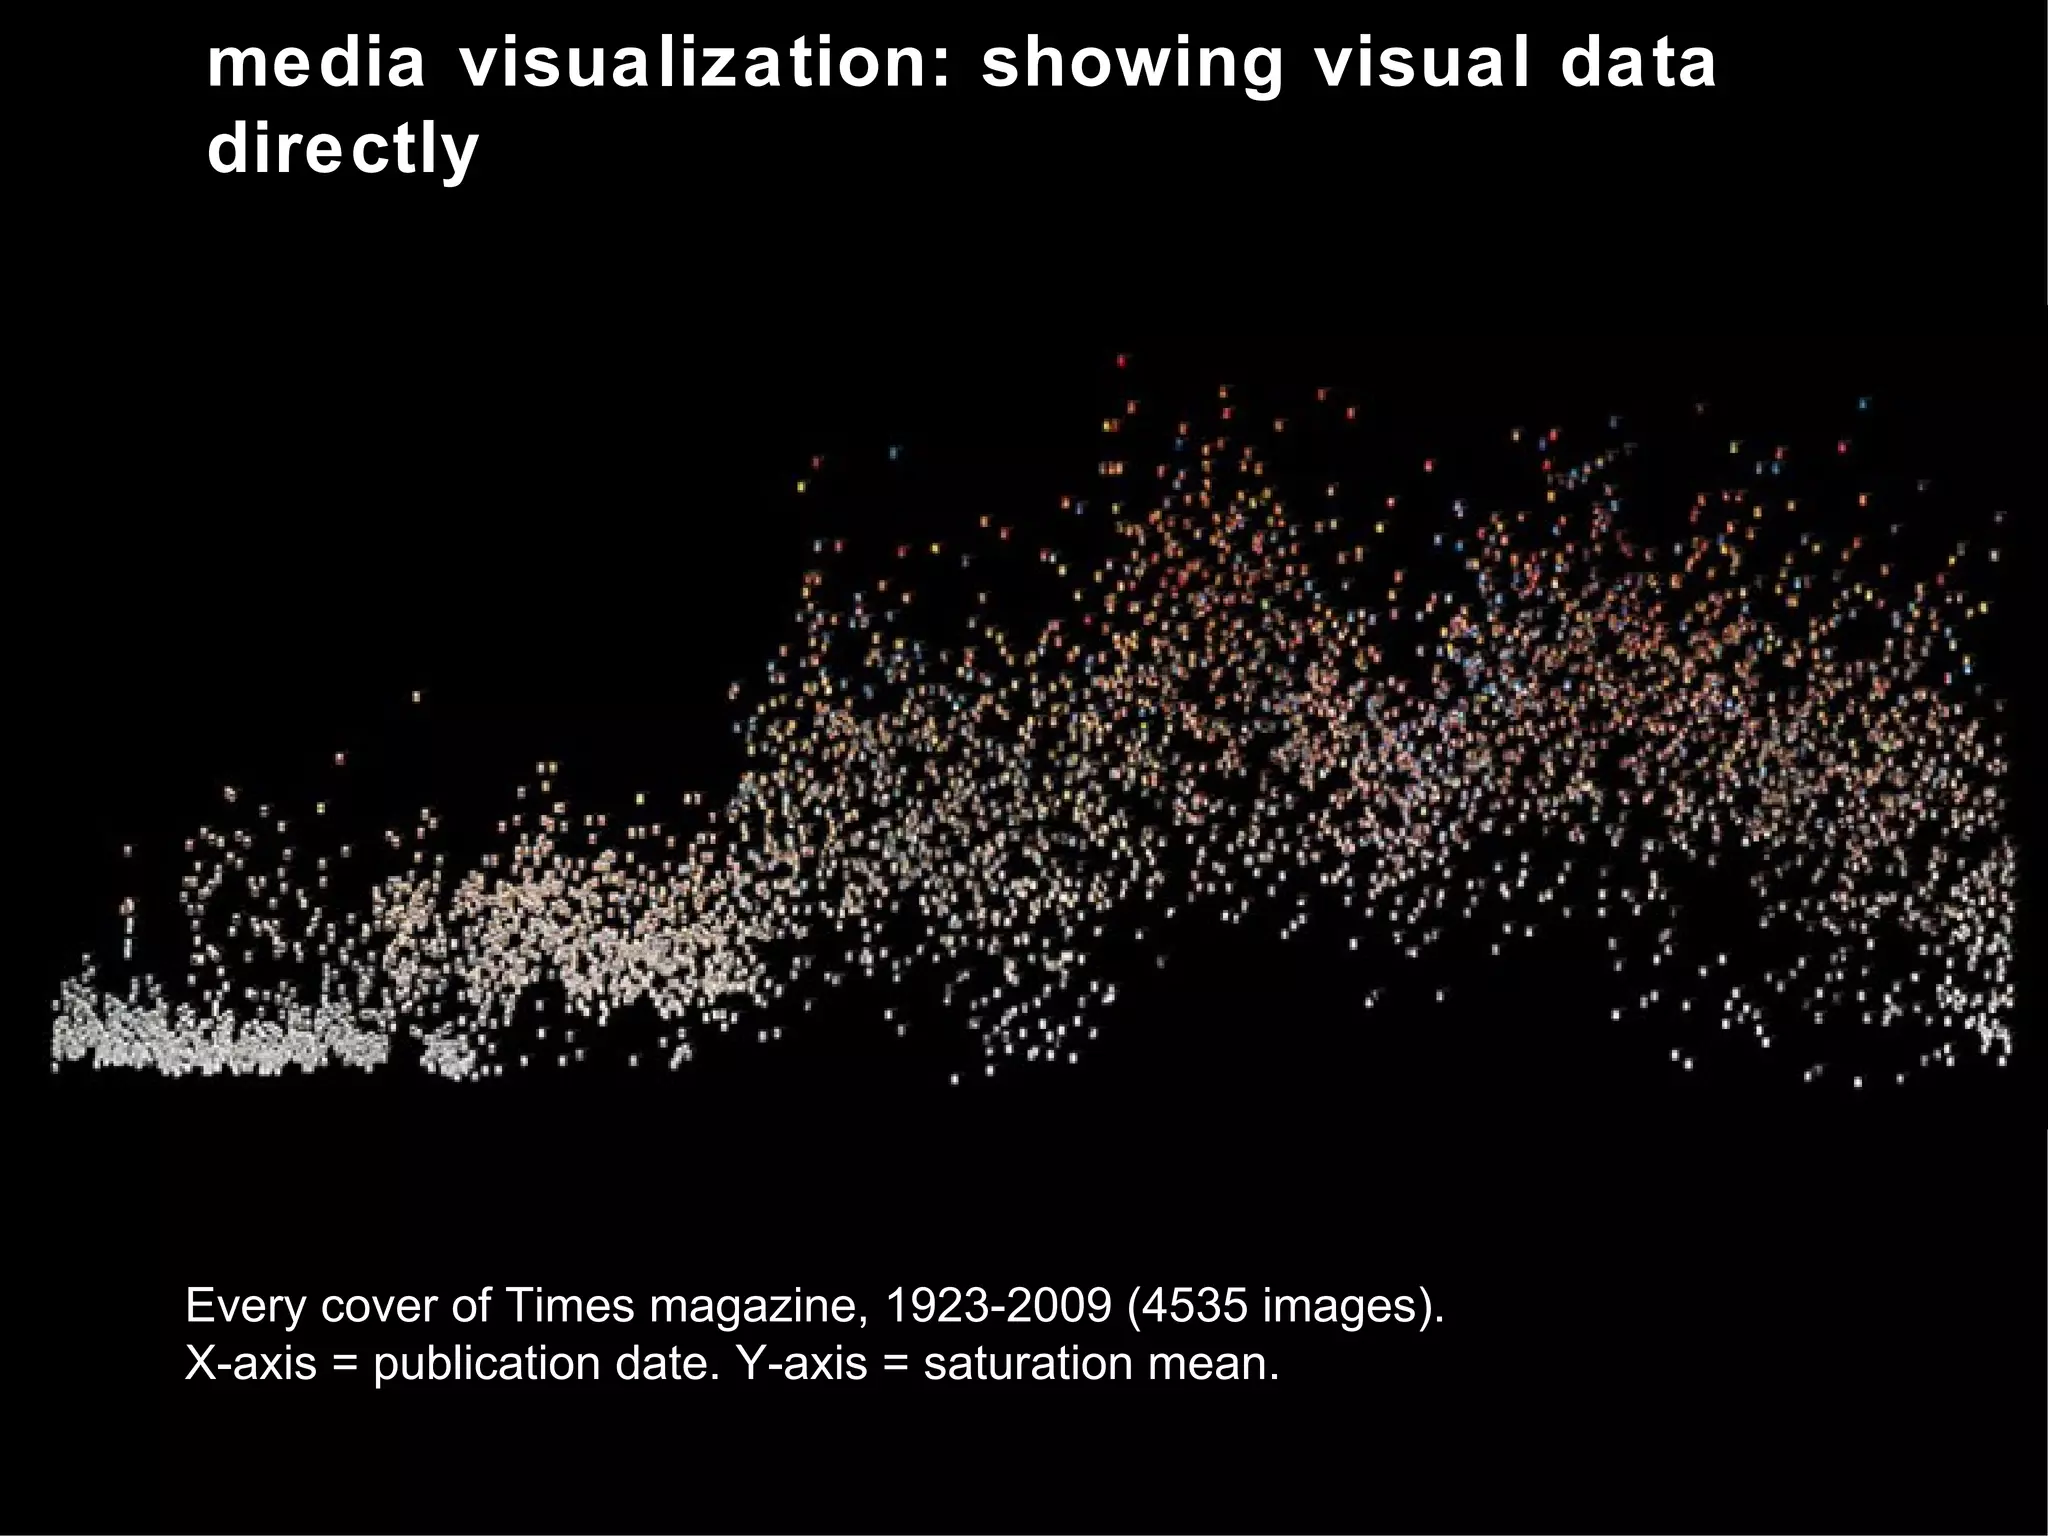
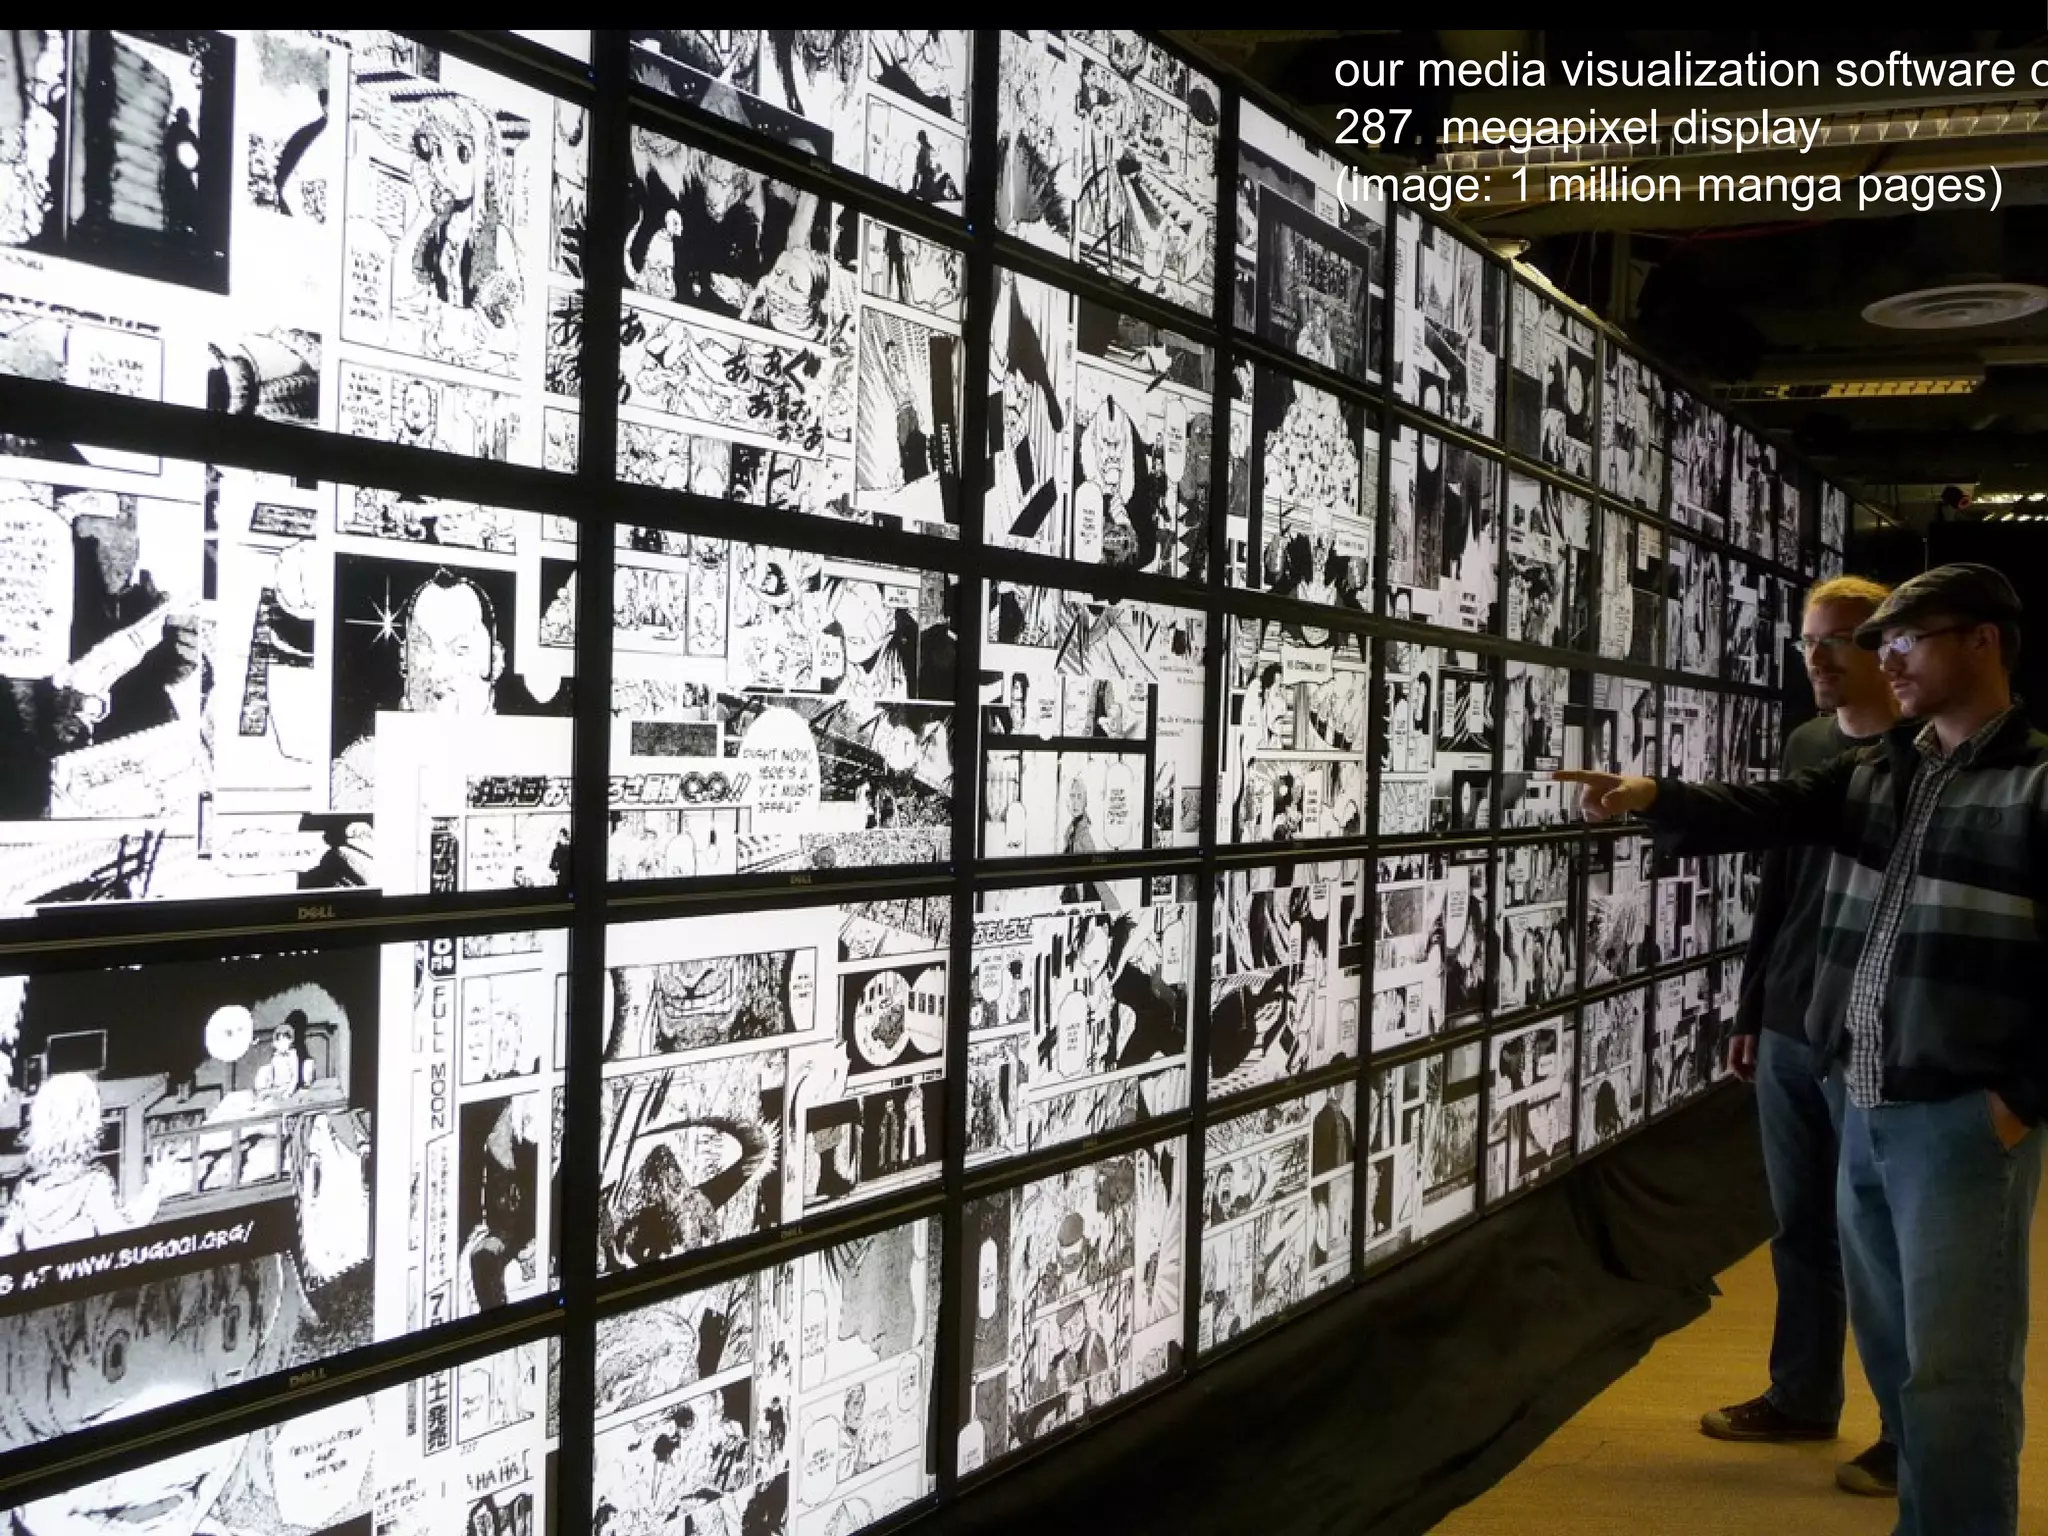
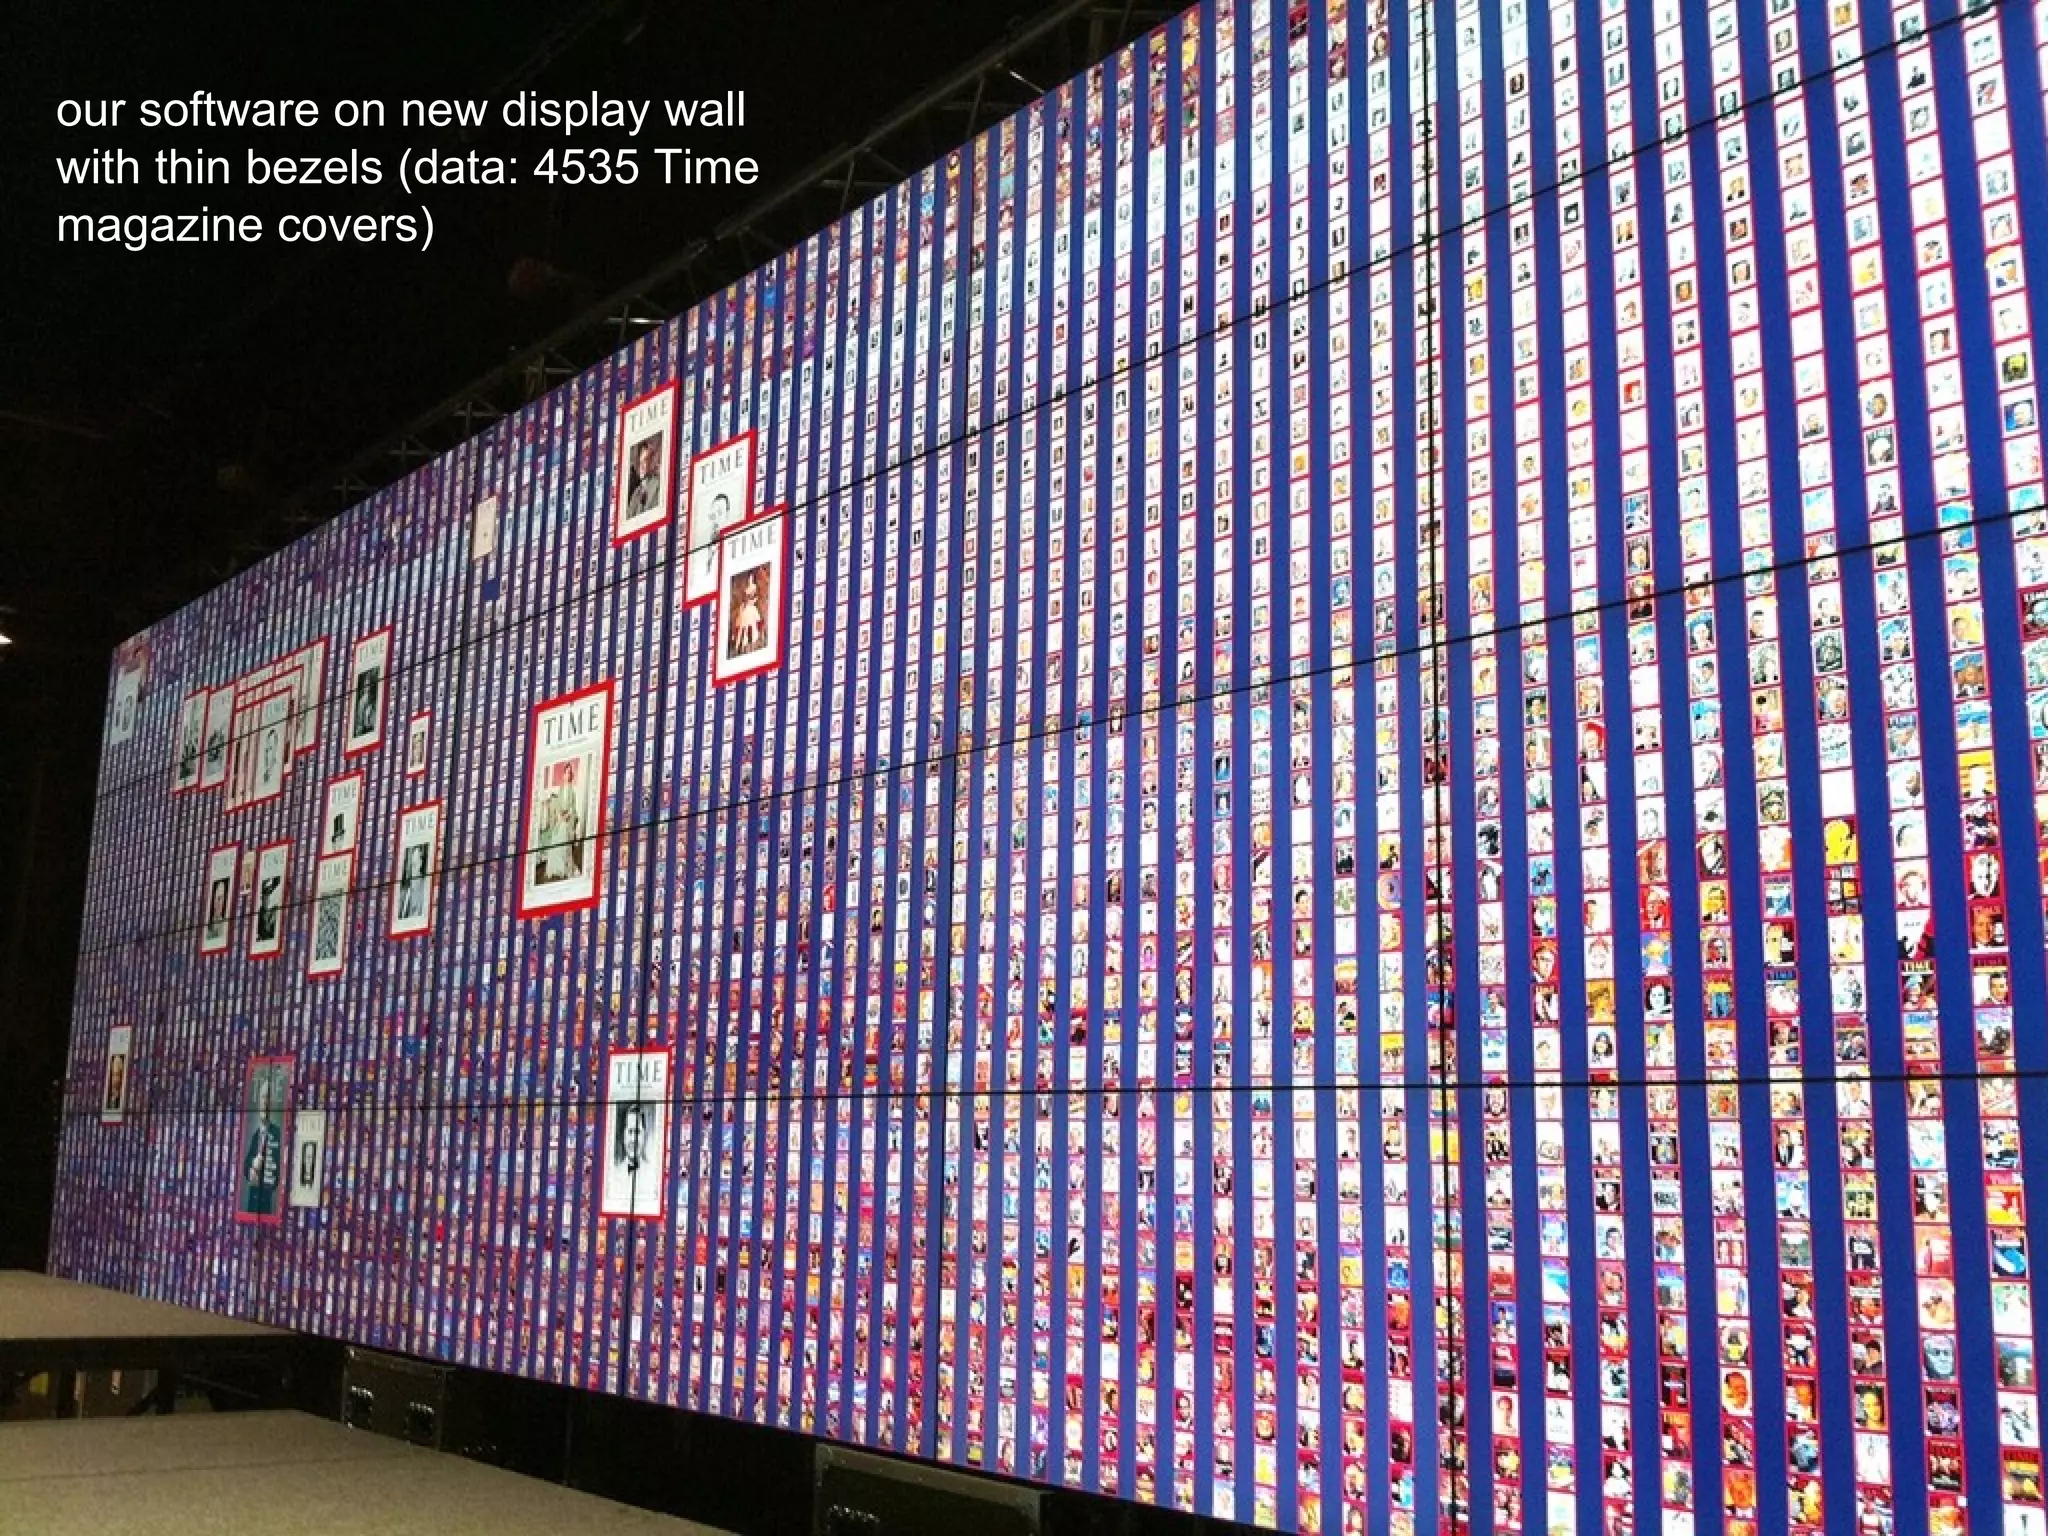
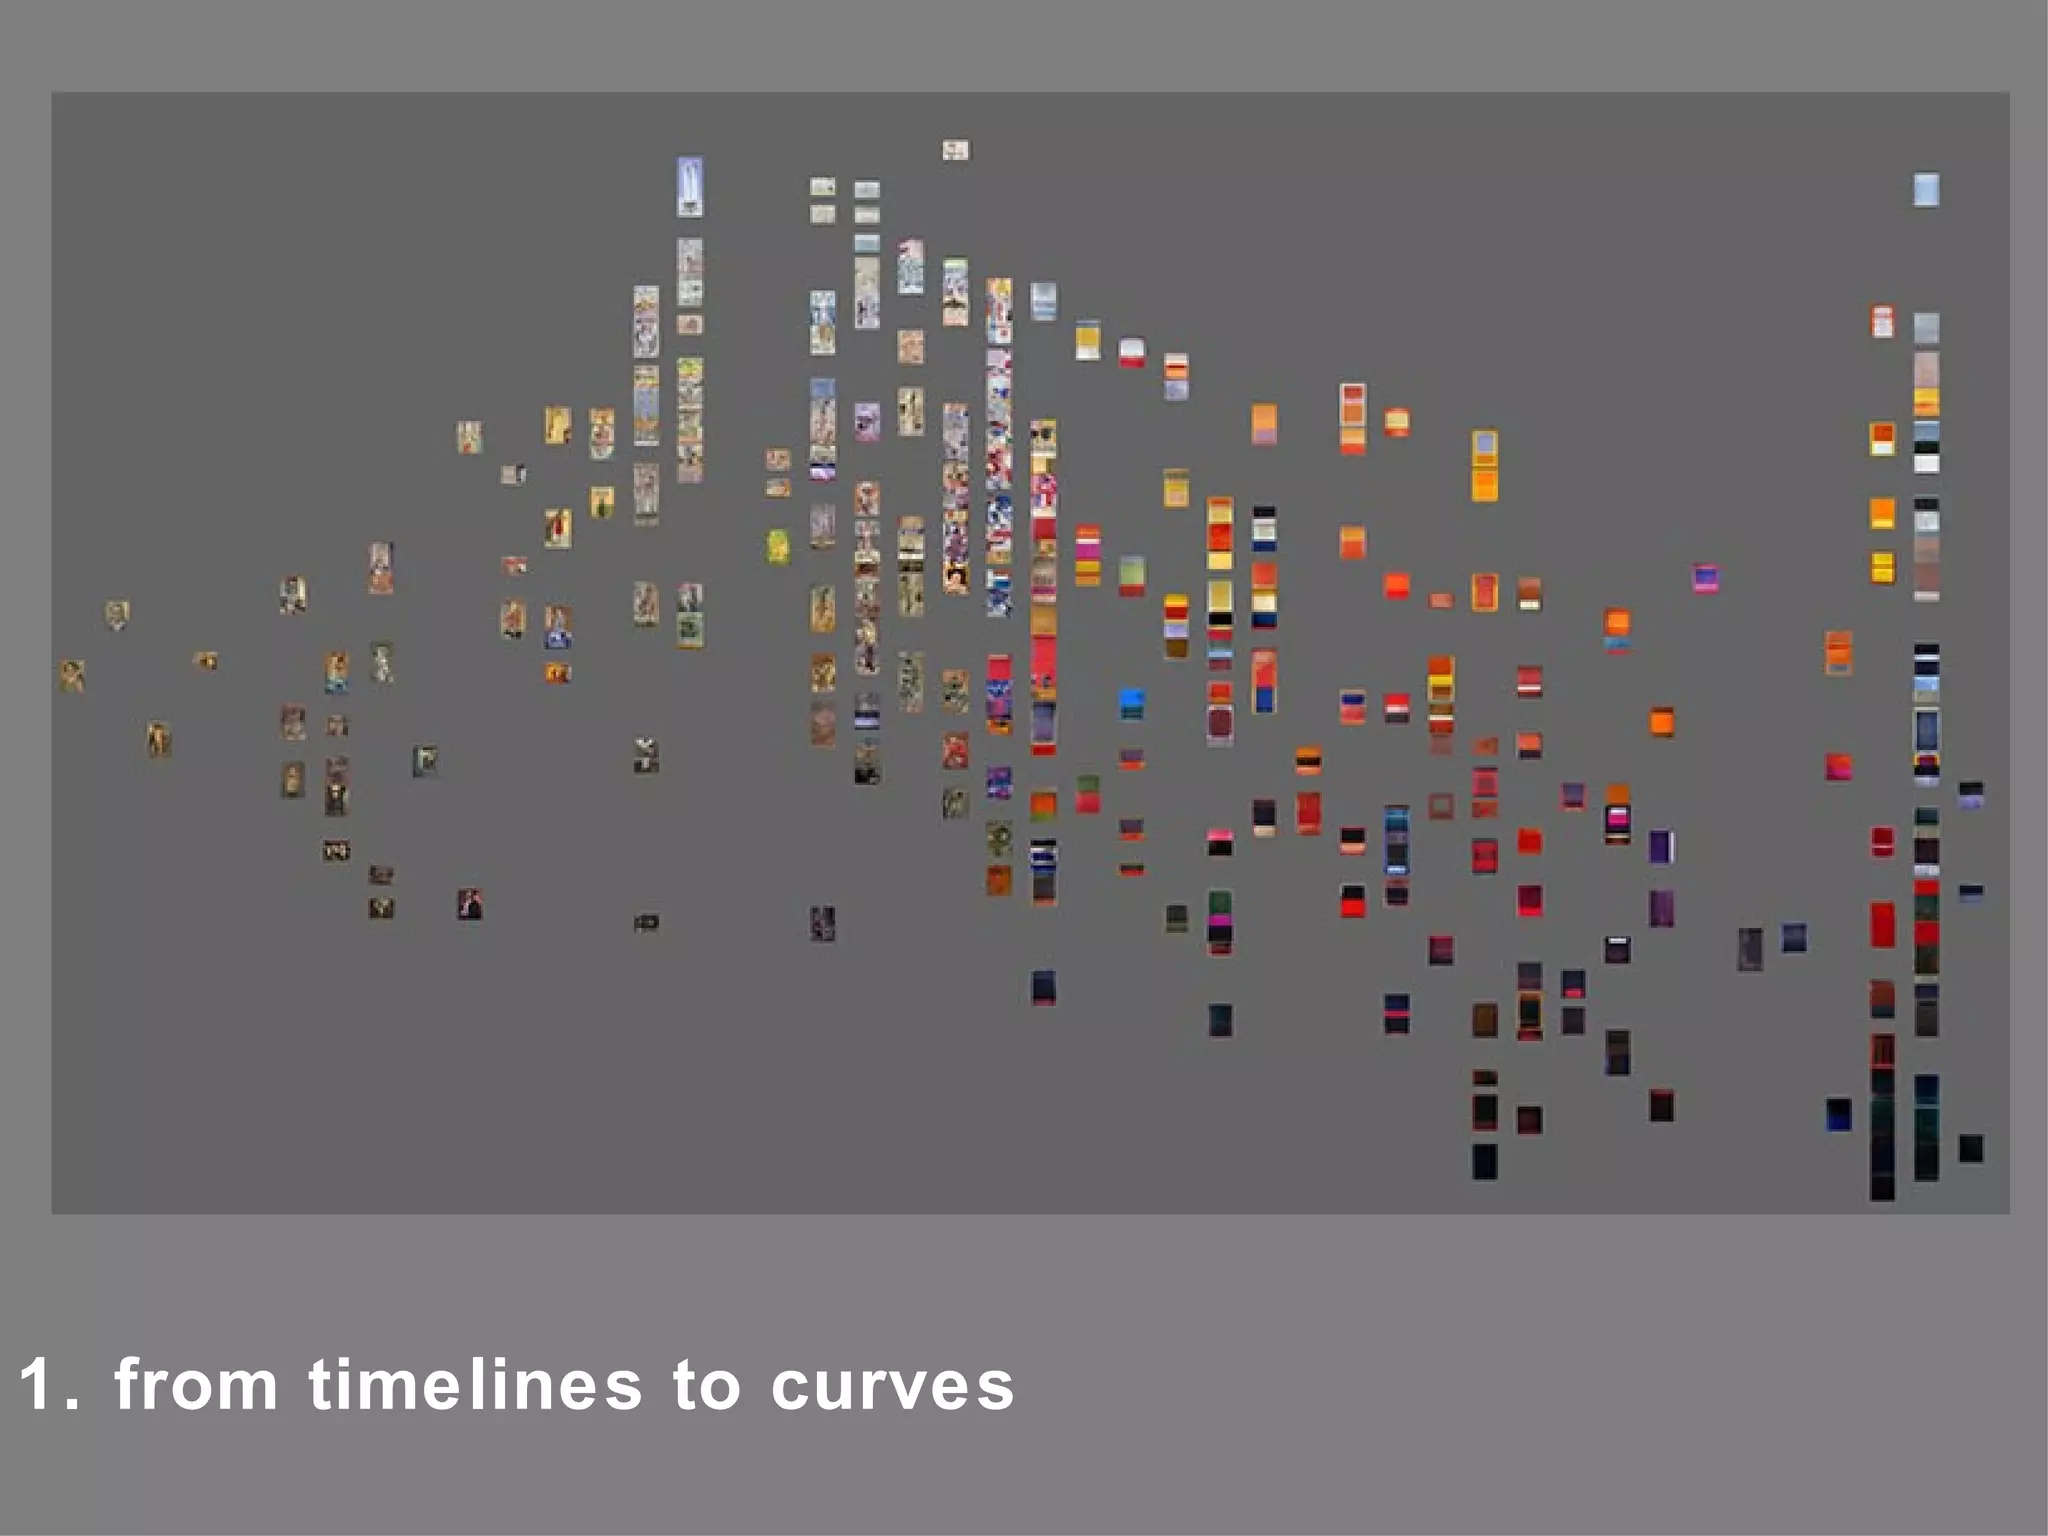
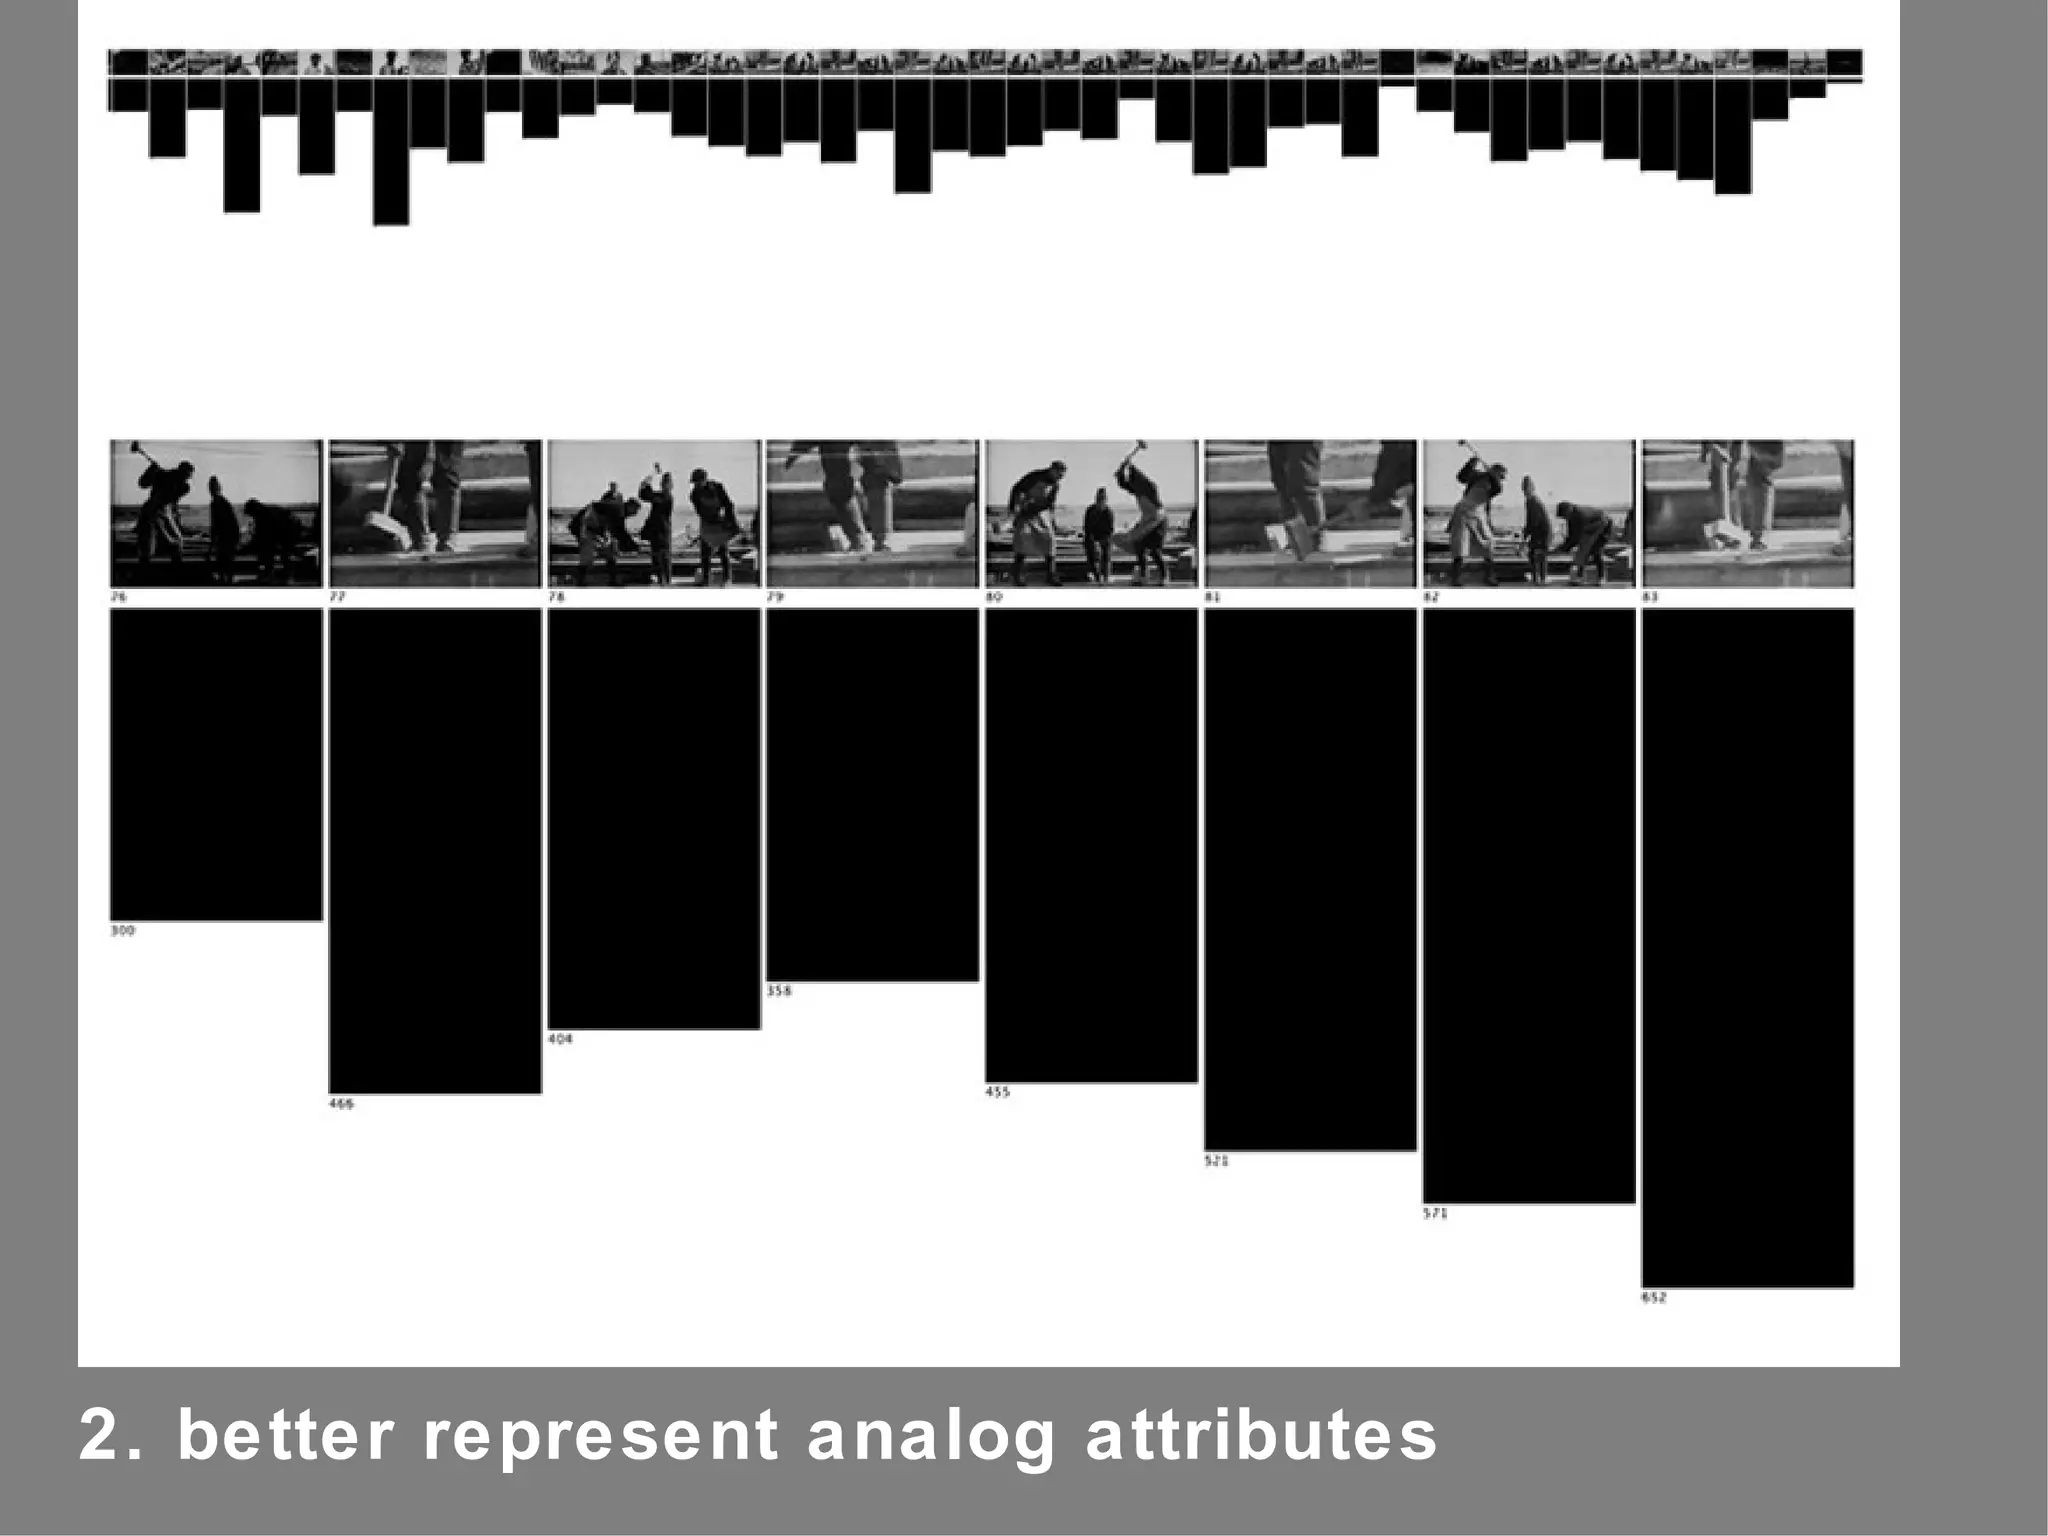
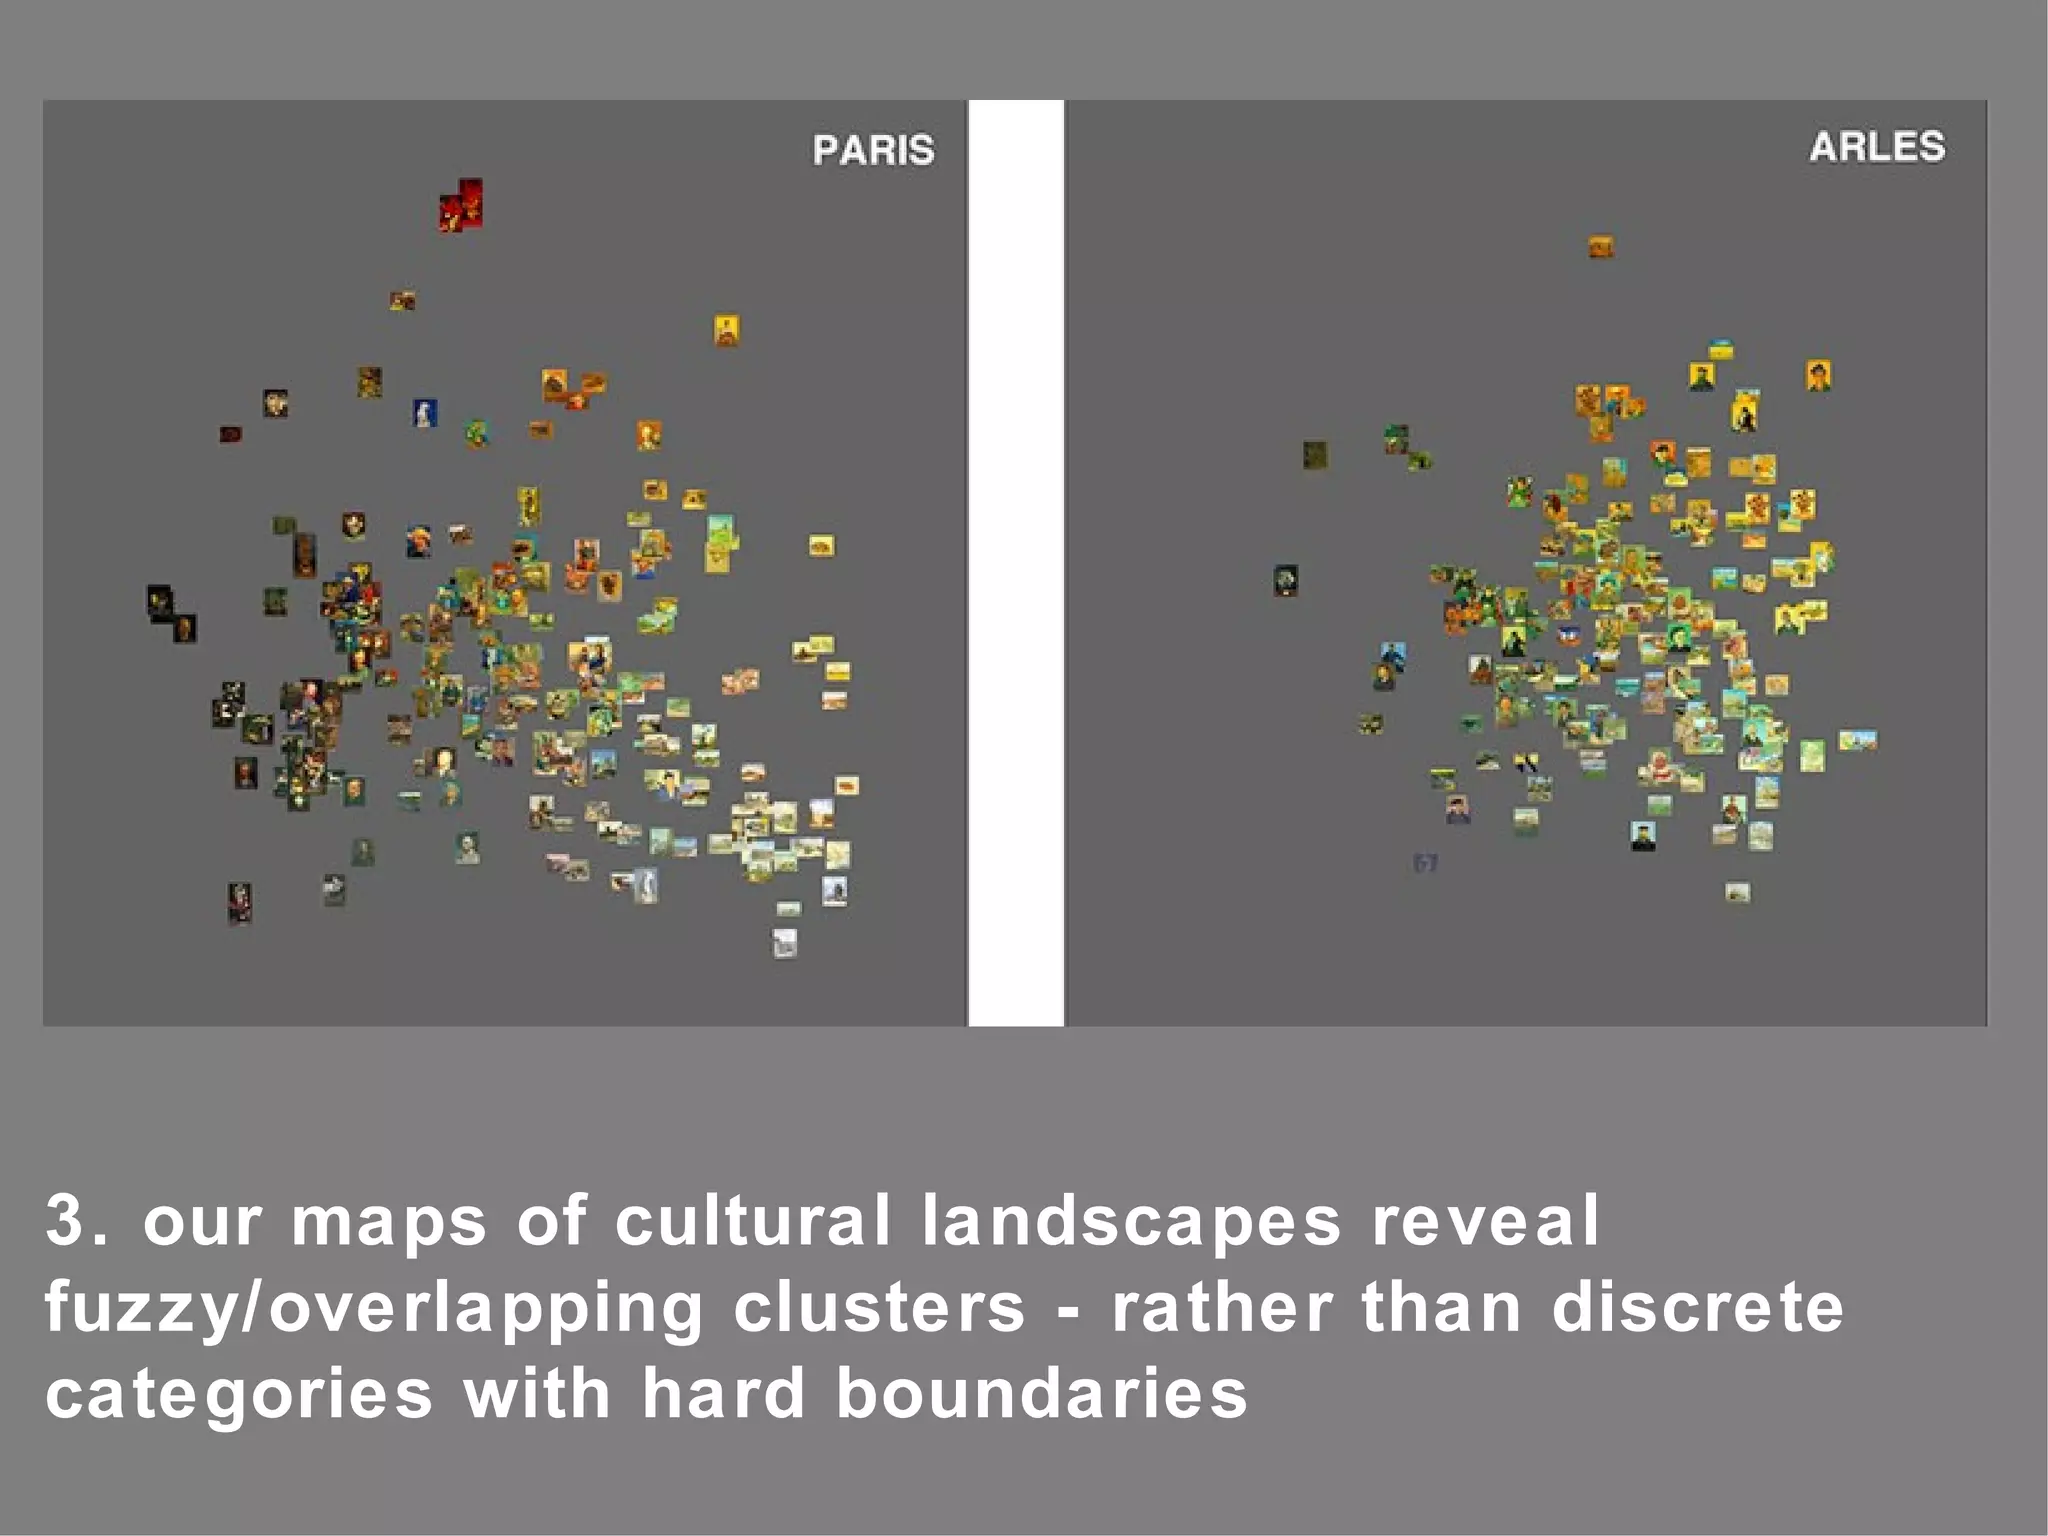
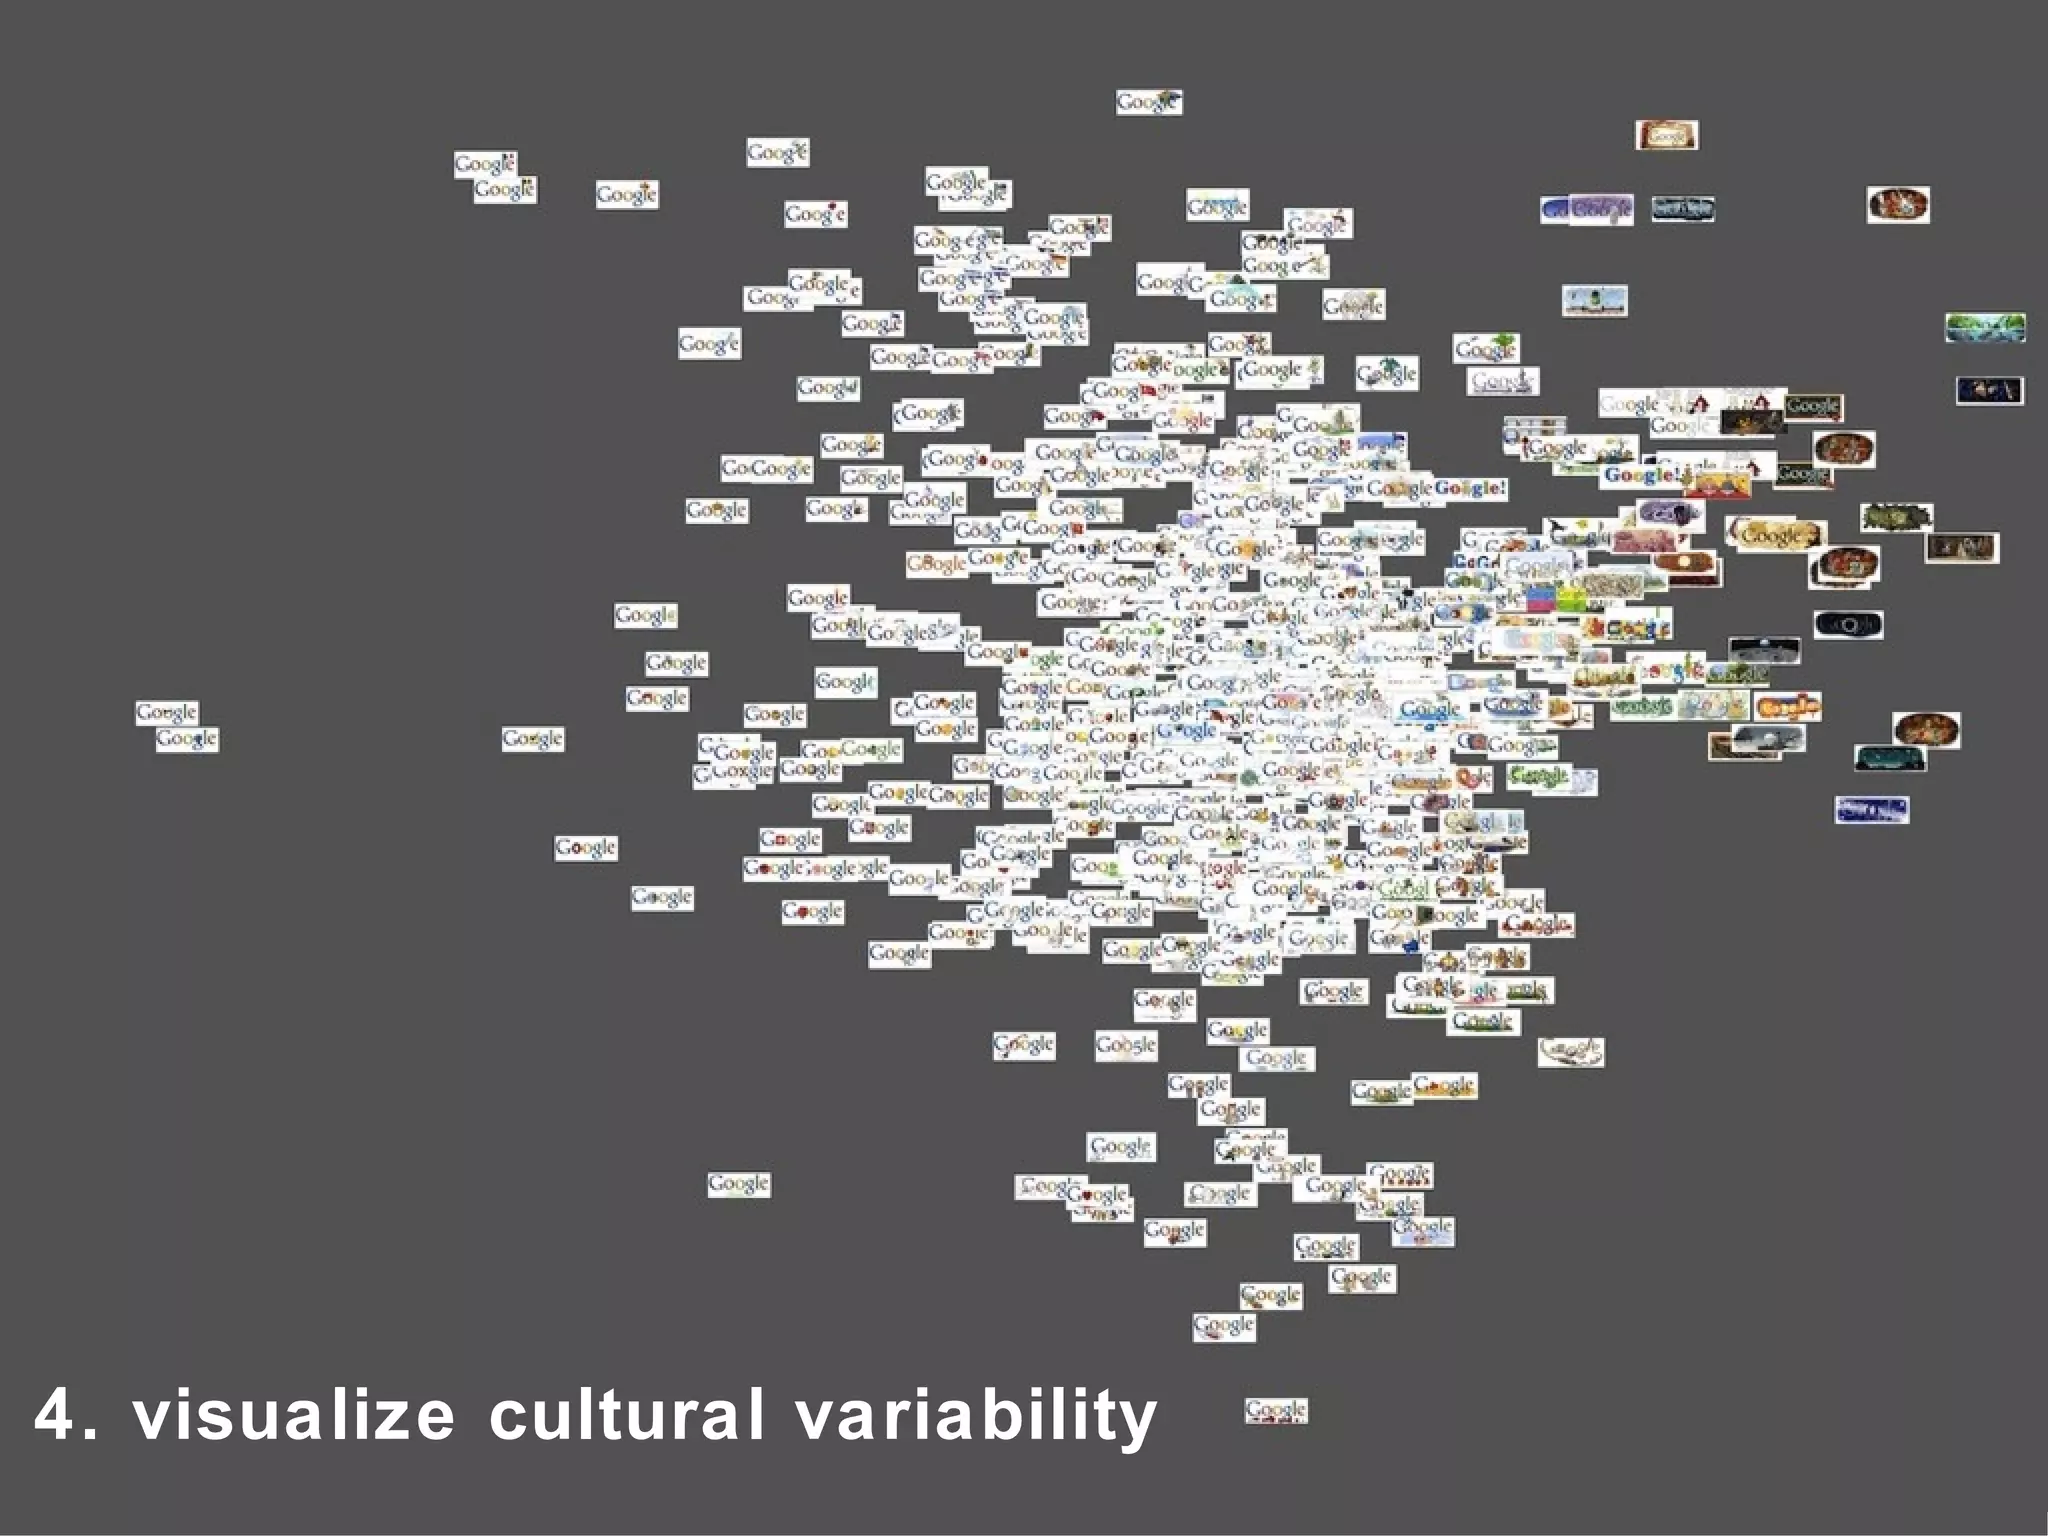


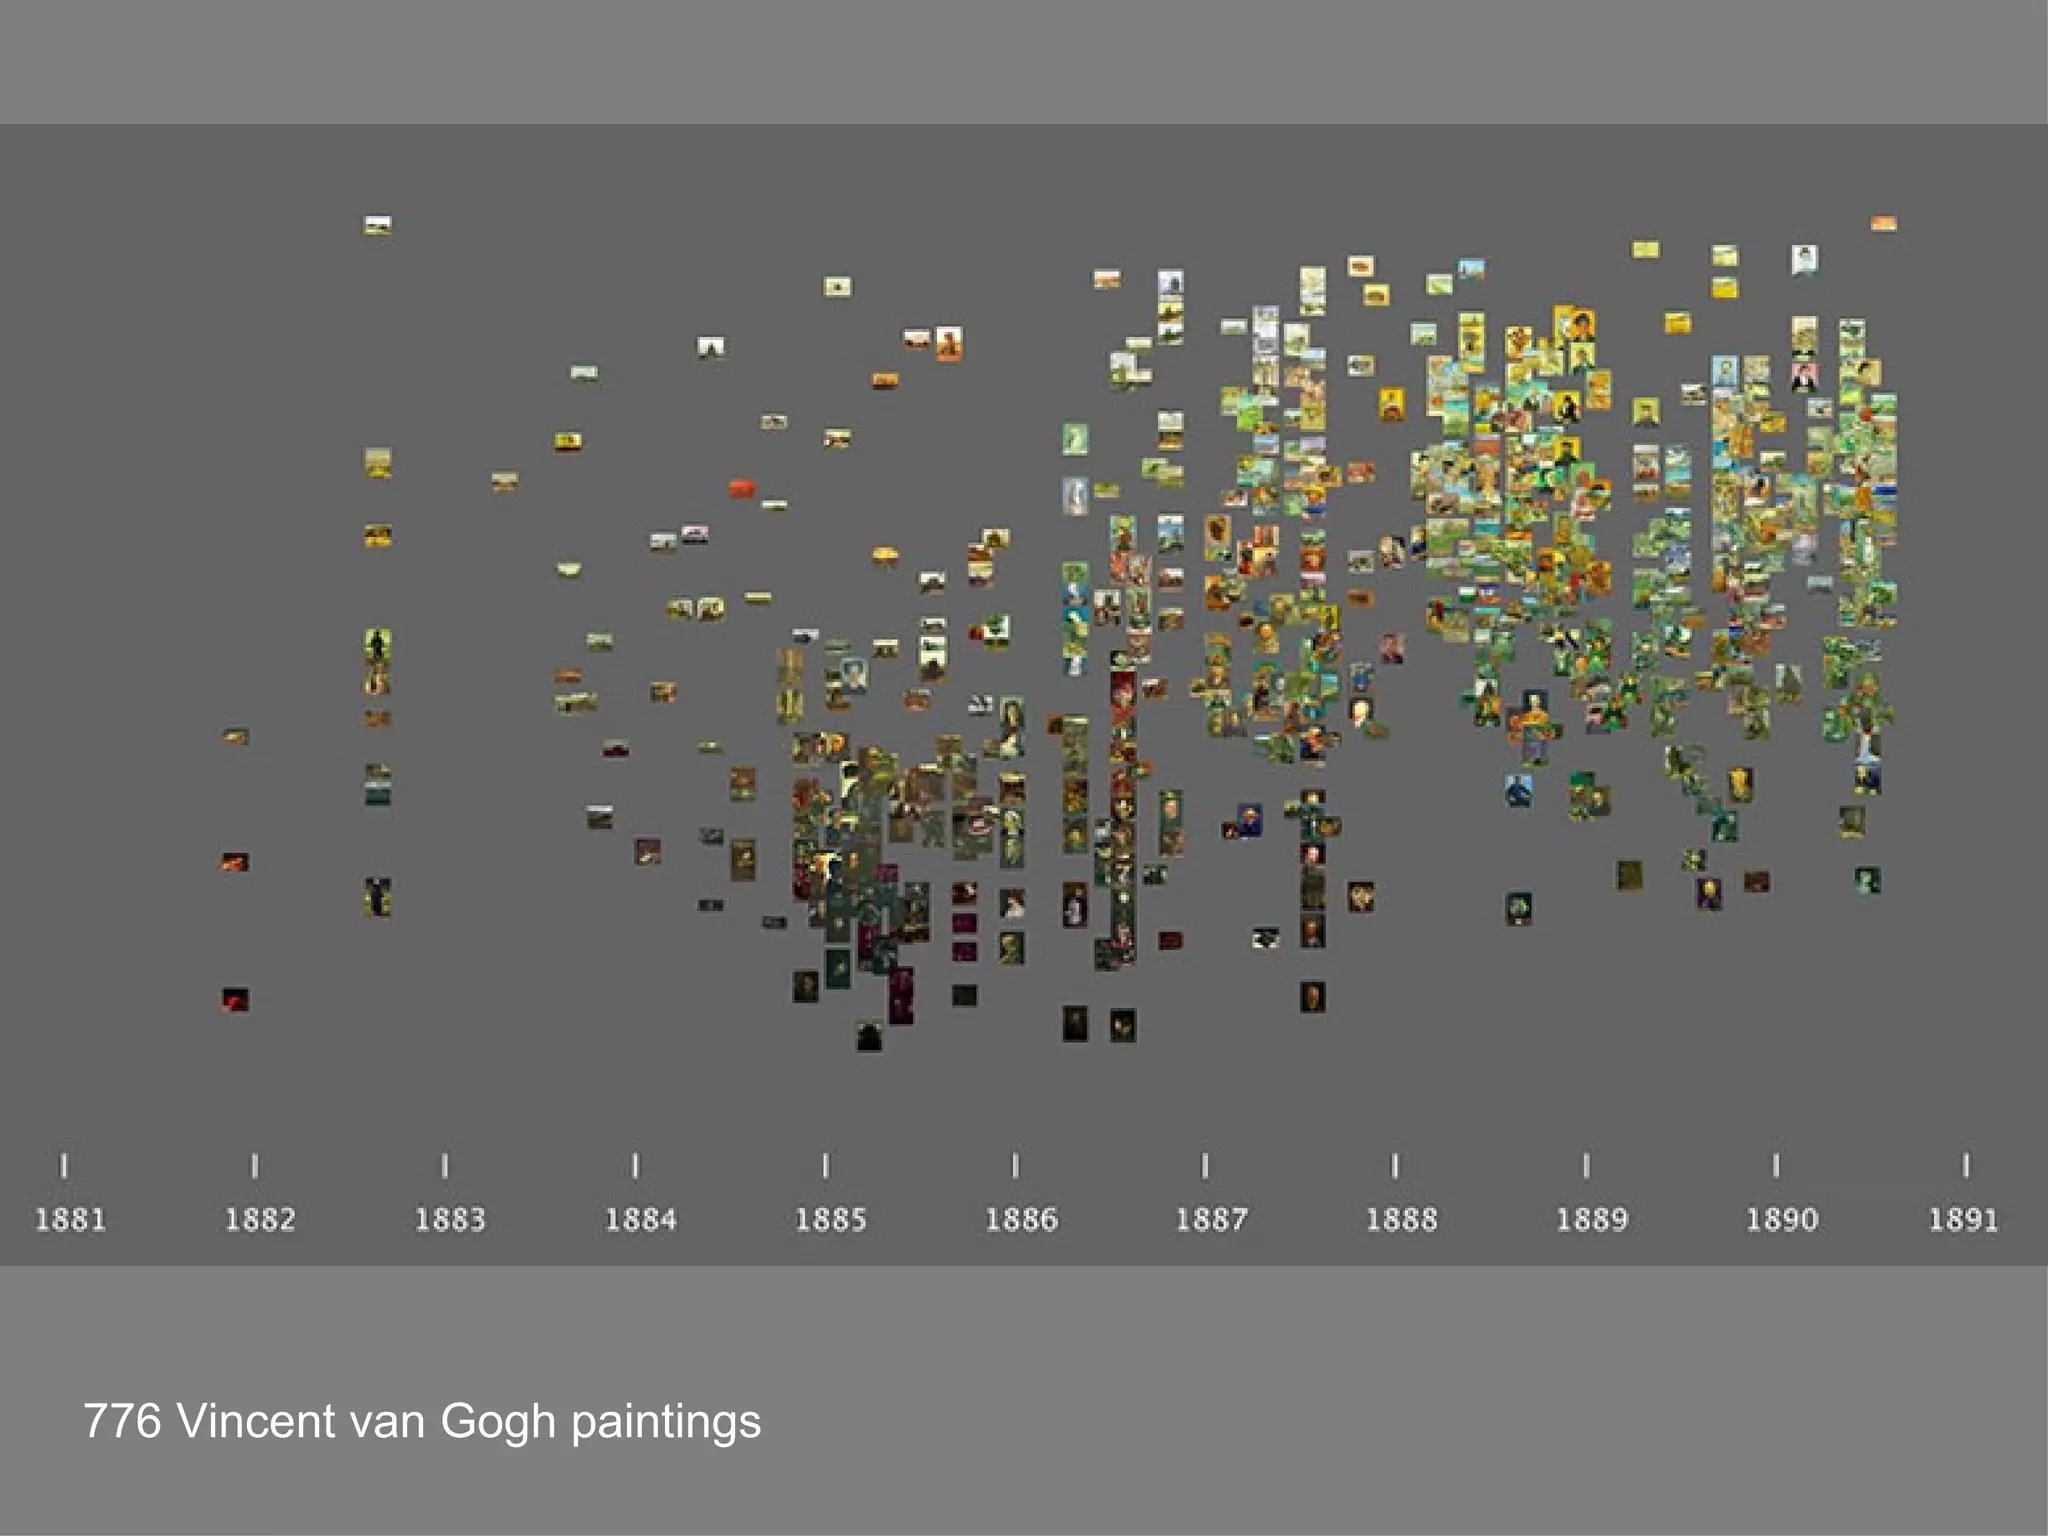

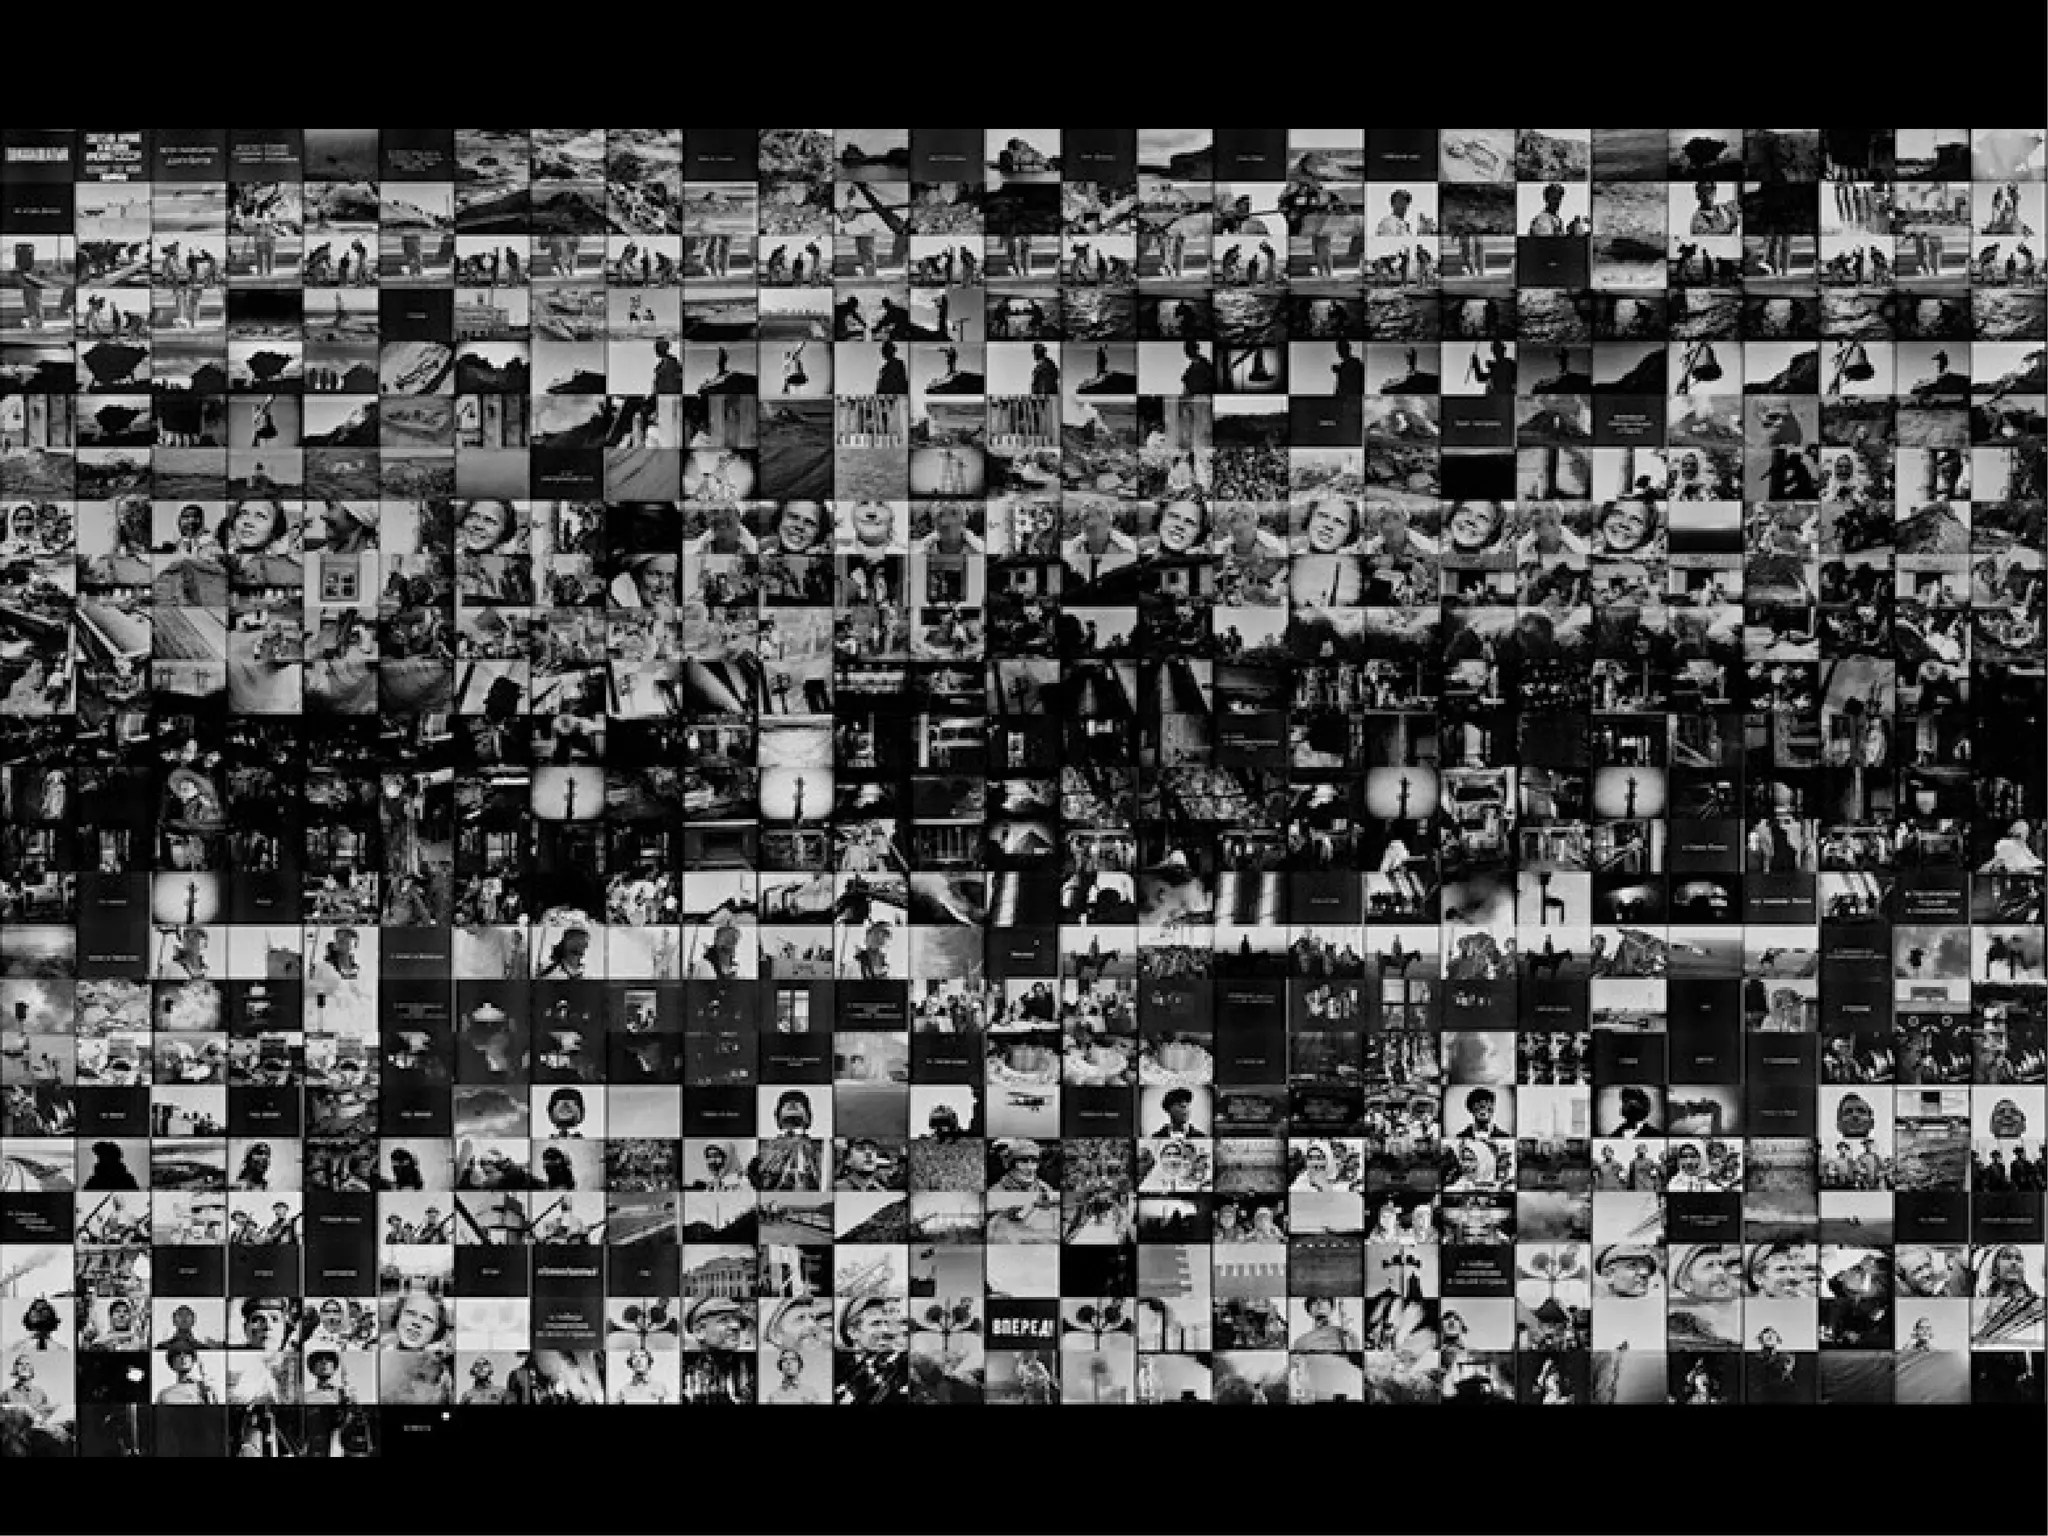


The document discusses the importance of studying big cultural data to understand societal dynamics, cultural variability, and historical context using large datasets derived from social media and other digital sources. It highlights the challenges and methods of media visualization, focusing on analyzing vast collections of visual and textual data to recognize patterns and derive insights. The conclusion differentiates computational humanities from digital humanities, emphasizing the potential of leveraging massive data for understanding cultural processes and improving research methodologies.


