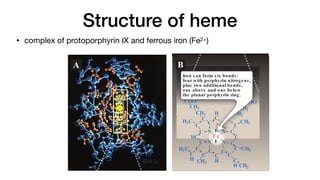
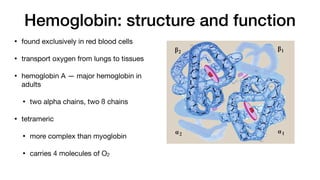
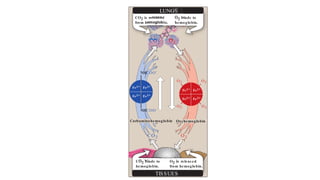
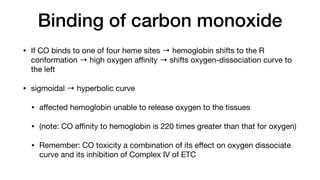
Hemoglobin and myoglobin are hemeproteins that transport oxygen in the body.
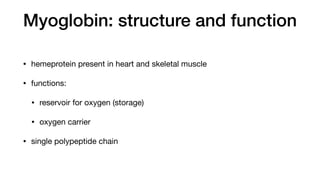
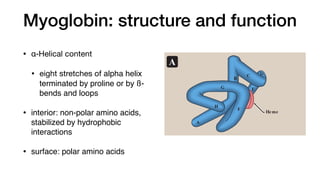
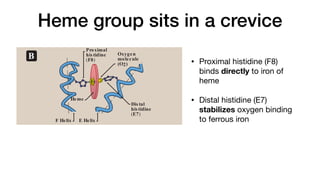
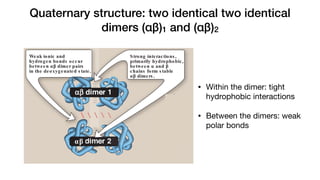
Myoglobin stores and transports oxygen in muscle cells. It has a higher affinity for oxygen than hemoglobin and binds one oxygen molecule. Hemoglobin transports oxygen from the lungs to tissues. It has four subunits that cooperatively bind four oxygen molecules in a sigmoidal binding curve. This allows hemoglobin to efficiently deliver oxygen to tissues in response to changes in oxygen levels. Key differences between the two proteins relate to their quaternary structure, cooperative binding, and oxygen dissociation curves.


![Binding of myoglobin
and hemoglobin
• Oxygen-dissociation curve
• key di
ff
erences:
• myoglobin has higher oxygen a
ffi
nity at all PO2
values
• myoglobin curve has a hyperbolic shape
• binds only one molecule of O2
• hemoglobin curve has a sigmoidal shape
• cooperative binding
%
S
aturatio
n
with
O
2
(Y)
Figure 3.5
Oxygen-dissociation curves for
myoglobin and hemoglobin (Hb).
0
0
40 80 120
P50 = 1 P50 = 26
100
Hemoglobin
Myoglobin
tis s ues lungs
50
ratio
n
with
O
2
(Y)
100
Hemoglo n
obin
Myoglobin
tis s ues lungs
50
Partial pres s ure of oxygen (pO2)
(mm Hg)
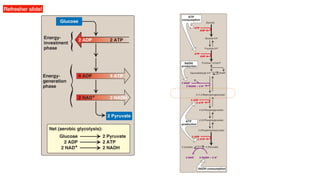
sure of oxygen needed to achieve half-saturation
tes (P50) is approximately 1 mm Hg for myoglobin
for hemoglobin. The higher the oxygen affinity
e tightly oxygen binds), the lower the P50.
he oxygen-dissociation curve for myoglobin has
shape (see Figure 3.5). This reflects the fact that
versibly binds a single molecule of oxygen. Thus,
MbO2) and deoxygenated (Mb) myoglobin exist in
librium:
Mb + O2
→
← MbO2
um is shifted to the right or to the left as oxygen
r removed from the system. [Note: Myoglobin is
bind oxygen released by hemoglobin at the low
n muscle. Myoglobin, in turn, releases oxygen
scle cell in response to oxygen demand.]
The oxygen-dissociation curve for hemoglobin
in shape (see Figure 3.5), indicating that the](https://image.slidesharecdn.com/hemoglobinandmyoglobinmay232023-230522231457-1b6ec96b/85/Hemoglobin-and-myoglobin-16-320.jpg)
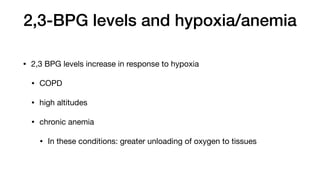
![Cooperative binding in hemoglobin
• binding of an oxygen molecule at heme
group increases the oxygen a
ffi
nity of
the remaining heme groups in the same
hemoglobin tetramer → heme-heme
interaction
Figure 3.5
Oxygen-dissociation curves for
myoglobin and hemoglobin (Hb).
O2
O2
O2
O2
Hb
Hb
Hb
Hb
Hb
O2 O2
O2 O2
O2
O2
O2 O2
O2
O2
Increas ing
affinity
for
O2
designed to bind oxygen released by hemoglobin at the low
pO2 found in muscle. Myoglobin, in turn, releases oxygen
within the muscle cell in response to oxygen demand.]
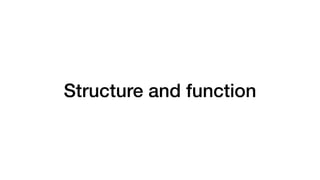
b. Hemoglobin: The oxygen-dissociation curve for hemoglobin
is sigmoidal in shape (see Figure 3.5), indicating that the
subunits cooperate in binding oxygen. Cooperative binding
of oxygen by the four subunits of hemoglobin means that the
binding of an oxygen molecule at one heme group increases
the oxygen affinity of the remaining heme groups in the same
hemoglobin tetramer (Figure 3.6). This effect is referred to as
heme–heme interaction (see below). Although it is more dif-
ficult for the first oxygen molecule to bind to hemoglobin, the
subsequent binding of oxygen occurs with high affinity, as
shown by the steep upward curve in the region near 20–30
mm Hg (see Figure 3.5).
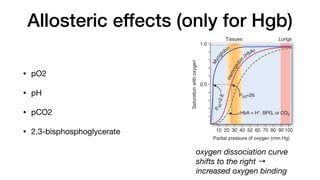
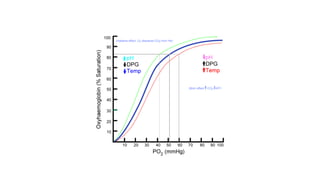
E. Allos teric effects
The ability of hemoglobin to reversibly bind oxygen is affected by
the pO2 (through heme–heme interactions as described above),
the pH of the environment, the partial pressure of carbon dioxide
(pCO2) and the availability of 2,3-bisphosphoglycerate. These are
collectively called allosteric (“other site”) effectors, because their
interaction at one site on the hemoglobin molecule affects the bind-
ing of oxygen to heme groups at other sites on the molecule. [Note:
The binding of oxygen to monomeric myoglobin is not influenced by
allosteric effectors.]
1. Heme–heme interactions : The sigmoidal oxygen-dissociation
300 times oxygen a
ffi
nity](https://image.slidesharecdn.com/hemoglobinandmyoglobinmay232023-230522231457-1b6ec96b/85/Hemoglobin-and-myoglobin-17-320.jpg)
![%
S
aturatio
n
with
O
2
(Y)
0
0
40 80 120
P50 = 1 P50 = 26
100
Hemoglobin
Myoglobin
pO2 in
tis s ues
pO2 in
lungs
50
ratio
n
with
O
2
(Y)
100
Hemoglo n
obin
Myoglobin
pO2 in
tis s ues
pO2 in
lungs
50
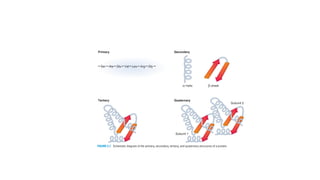
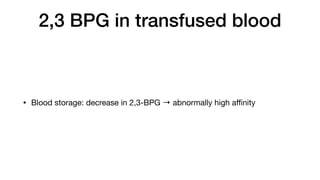
The oxygen-dis s ociation curve for Hb is
s teepes t at the oxygen concentrations
that occur in the tis s ues . This permits
oxygen delivery to res pond to s mall
changes in pO2.
Partial pres s ure of oxygen (pO2)
(mm Hg)
ot of Y measured at different
is called the oxygen-dissoci-
be represented as PO2.] The
globin show important differ-
illustrates that myoglobin has
values than does hemoglobin.
ded to achieve half-saturation
mately 1 mm Hg for myoglobin
The higher the oxygen affinity
ds), the lower the P50.
ation curve for myoglobin has
3.5). This reflects the fact that
gle molecule of oxygen. Thus,
enated (Mb) myoglobin exist in
MbO2
right or to the left as oxygen
e system. [Note: Myoglobin is
Less oxygen af
fi
nity
oxygen released to tissue
Greater oxygen af
fi
nity
“refueling”
Note that myoglobin
has max a
ffi
nity for
oxygen → delivers no
oxygen to tissues](https://image.slidesharecdn.com/hemoglobinandmyoglobinmay232023-230522231457-1b6ec96b/85/Hemoglobin-and-myoglobin-18-320.jpg)

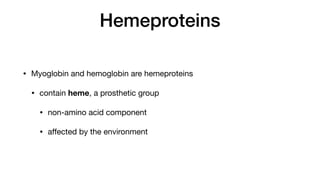
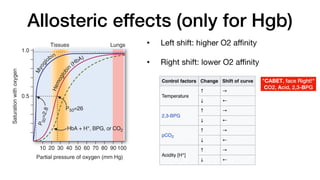
![Effect of 2,3-BPG
• 2,3-bisphosphoglycerate
• most abundant organic phosphate in RBC
• synthesized as an intermediate in the
glycolytic pathway
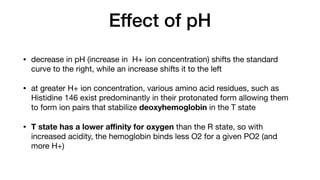
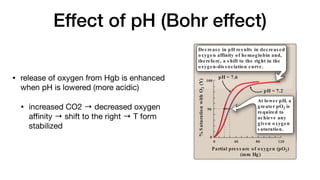
b. Mechanis m of the Bohr effect: The Bohr effect reflects the
fact that the deoxy form of hemoglobin has a greater affinity
for protons than does oxyhemoglobin. This effect is caused
by ionizable groups such as specific histidine side chains that
have a higher pKa in deoxyhemoglobin than in oxyhemoglobin.
Therefore, an increase in the concentration of protons (resulting
in a decrease in pH) causes these groups to become protonated
(charged) and able to form ionic bonds (salt bridges). These
bonds preferentially stabilize the deoxy form of hemoglobin, pro-
ducing a decrease in oxygen affinity. [Note: Hemoglobin, then, is
an important blood buffer.]
The Bohr effect can be represented schematically as:
HbO2 + H+ →
← HbH + O2
oxyhemoglobin deoxyhemoglobin
where an increase in protons (or a lower pO2) shifts the equi-
librium to the right (favoring deoxyhemoglobin), whereas an
increase in pO2 (or a decrease in protons) shifts the equilib-
rium to the left.
3. Effe c t of 2,3-bis pho s phog lyc e rate o n oxyge n affinity: 2,3-
Bisphosphoglycerate (2,3-BPG) is an important regulator of the
binding of oxygen to hemoglobin. It is the most abundant organic
II. Globular Hemeproteins 31
Figure 3.9
2,3-Bis phos pho-
glycerate
H
C
H O
C
H O
C
O
O–
P
P
1,3-Bisphospho-
glycerate
Glucos e
3-Phospho-
glycerate
Pyruvate
H2O
PO4
2–
Glycolys is
Lactate](https://image.slidesharecdn.com/hemoglobinandmyoglobinmay232023-230522231457-1b6ec96b/85/Hemoglobin-and-myoglobin-27-320.jpg)
![decreases
hemoglobin
g stabilizes
t of binding
2
binds to a
enter of the
et contains
bonds with
PG. [Note:
lt in hemo-
hat may be
hrocytosis).]
bin.
lobin from
ity for oxy-
of 2,3-BPG
or oxygen,
igure 3.11).
3
3-bisphosphoglycerate (2,3-BPG)
may be referred to as 2,3-diphos-
phoglycerate (2,3-DPG).
Figure 3.10
β2 α2
A s ingle molecule of 2,3-BPG
binds to a pos itively charged
cavity formed by the β-chains
of deoxyhemoglobin.
α1
2,3-BPG binding shifts oxygen dissociation curve to the right → enables
hemoglobin to be released to tissues e
ffi
ciently
d. Re s po ns e o f 2
mia: The conce
response to chr
obstructive pulm
at high altitudes
ficulty receiving
BPG are also e
normal RBCs ar
Elevated 2,3-BP
bin, permitting g
the tissues (see
e. Role of 2,3-BPG
the normal oxyg
storing blood i
decrease in 2,3-
oxygen affinity
in the tissues. H
32
%
S
aturatio
n
with
O
2
(Y)
Figure 3.11
Partial pres s ure of oxygen
(mm Hg)
0
0
40 80 120
100
2,3-BPG = 8 mmol/l
(Blood from individual
adapted to high altitudes )
2,3-BPG = 0
(Hemoglobin
s tripped of 2,3-BPG)
2,3-BPG = 5 mmol/l
(Normal blood)](https://image.slidesharecdn.com/hemoglobinandmyoglobinmay232023-230522231457-1b6ec96b/85/Hemoglobin-and-myoglobin-29-320.jpg)
![ect CO-mediated damage
treated with 100% oxygen
therapy), which facilitates
oglobin. [Note: CO inhibits
ain (see p. 76).] In addition
O) also is carried by hemo-
p. 151). It can be taken up
modulating NO availability
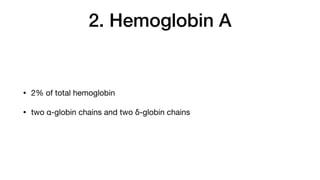
hemoglobin A (HbA) is just
urally related family of pro-
33
Figure 3.13
Normal adult human hemoglobins.
[Note: The α-chains in these hemo-
globins are identical.]
Hb = hemoglobin.
HbA α2β2
Form
Chain
compos ition
Fraction of
total hemoglobin
HbA1c α2β2-glucose
90%
3%–9%
α2γ2
HbF <2%
HbA2 α2δ2 2%–5%](https://image.slidesharecdn.com/hemoglobinandmyoglobinmay232023-230522231457-1b6ec96b/85/Hemoglobin-and-myoglobin-36-320.jpg)
![1. Fetal hemoglobin
• tetramer consisting of two α chains identical to
those found in HbA, plus two γ chains (gamma)
• Review:
• month 1: Hb Gower 1 composed of two α-like
zeta (ζ) chains and two β-like epsilon (ε) chains
(ζ2ε2), are synthesized by the embryonic yolk sac
• week 5 of gestation: primary product is HbF
• HbF - major hgb in fetus
• month 8 of gestation: HbA synthesis starts in
bone marrow, gradually replaces HbF
It is important to remember that human hemoglobin A (HbA) is just
one member of a functionally and structurally related family of pro-
teins, the hemoglobins (Figure 3.13). Each of these oxygen-carrying
proteins is a tetramer, composed of two α-globin (or α-like) polypep-
tides and two β-globin (or β-like) polypeptides. Certain hemoglobins,
such as HbF, are normally synthesized only during fetal develop-
ment, whereas others, such as HbA2, are synthesized in the adult,
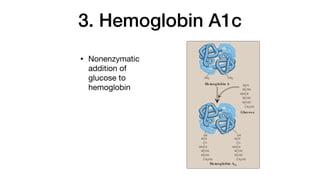
although at low levels compared with HbA. HbA can also become
modified by the covalent addition of a hexose (see p. 34).
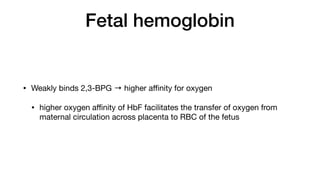
1. Fetal hemoglobin: HbF is a tetramer consisting of two α chains
identical to those found in HbA, plus two γ chains (α2γ2; see
Figure 3.13). The γ chains are members of the β-globin gene fam-
ily (see p. 35).
a. HbF s ynthes is during development: In the first month after
conception, embryonic hemoglobins such as Hb Gower 1,
composed of two α-like zeta (ζ) chains and two β-like epsilon
(ε) chains (ζ2ε2), are synthesized by the embryonic yolk sac.
In the fifth week of gestation, the site of globin synthesis shifts,
first to the liver and then to the marrow, and the primary prod-
uct is HbF. HbF is the major hemoglobin found in the fetus and
newborn, accounting for about 60% of the total hemoglobin in
the RBC during the last months of fetal life (Figure 3.14). HbA
synthesis starts in the bone marrow at about the eighth month
of pregnancy and gradually replaces HbF. (Figure 3.14 shows
the relative production of each type of hemoglobin chain during
fetal and postnatal life.) [Note: HbF represents less than 1%
of the hemoglobin in most adults and is concentrated in RBC
known as F cells.]
[Note: The α-chains in these hemo-
globins are identical.]
Hb = hemoglobin.
Months before and after birth
Pe
rc
e
ntag
e
o
f
to
tal
g
lo
bin
c
hains
–9 –6 –3 3 6 9
0
25
50
0
25
50
α
β
δ
ε
γ
ζ
α-Globin-
like chains
β-Globin-
like chains
Time of
birth
0](https://image.slidesharecdn.com/hemoglobinandmyoglobinmay232023-230522231457-1b6ec96b/85/Hemoglobin-and-myoglobin-37-320.jpg)
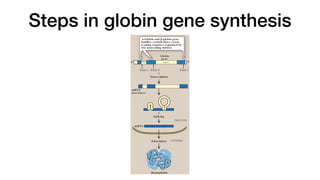
![[Note: Globin gene famillies also contain globin-like genes that are
not expressed, that is, their genetic information is not used to pro-
duce globin chains. These are called pseudogenes.]
Figure 3.16
Organization of the globin gene families. Hb = hemoglobin.
ζ α1
α2
ε δ
Gγ β
Hb Gower 1 HbA
HbF HbA2
α2β2
α2δ2
α2γ2
ζ2ε2
Hemoglobins are formed
by combinations of
chains from each
gene family.
α-Globin gene family
(chromos ome 16)
β-Globin gene family
(chromos ome 11) Aγ
The two copies of the
α-globin gene are des ignated
α1 and α2. Each can provide
α-globin chains that combine
with β-globin chains .](https://image.slidesharecdn.com/hemoglobinandmyoglobinmay232023-230522231457-1b6ec96b/85/Hemoglobin-and-myoglobin-42-320.jpg)
![Figure 3.20
Fib e r
β-6 -Va lin e
β Chain
His.Leu.Thr.Pro.Glu .Glu.Lys
His.Leu.Thr.Pro.Va l.Glu.Lys
Microinfarcts produce
tis s ue anoxia, res ulting
in s evere pain.
5
Rigid erythrocytes
occlude blood flow
in the capillaries .
4
α1
α2
β1
β2
which decreases RBC sickling. This leads to decreased frequency
of painful crises and reduces mortality. [Note: The morbidity and
mortality associated with sickle cell anemia has led to its inclu-
sion in newborn screening panels to allow prophylactic antibiotic
therapy to begin soon after the birth of an affected child.]
. Pos s ible s elective advantage of the heterozygous s tate: The
high frequency of the βS
mutation among black Africans, despite
its damaging effects in the homozygous state, suggests that
a selective advantage exists for heterozygous individuals. For
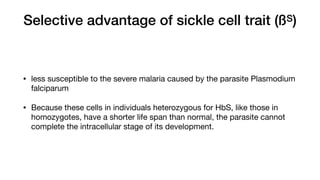
example, heterozygotes for the sickle cell gene are less suscepti-
ble to the severe malaria caused by the parasite Plasmodium fal-
ciparum. This organism spends an obligatory part of its life cycle
in the RBC. One theory is that because these cells in individuals
heterozygous for HbS, like those in homozygotes, have a shorter
life span than normal, the parasite cannot complete the intracel-
lular stage of its development. This fact may provide a selective
advantage to heterozygotes living in regions where malaria is a
major cause of death. Figure 3.21 illustrates that in Africa, the
geographic distribution of sickle cell anemia is similar to that of
malaria.
Hemoglobin C dis eas e
Like HbS, HbC is a hemoglobin variant that has a single amino acid
ubstitution in the sixth position of the β-globin chain (see Figure
.18). In HbC, however, a lysine is substituted for the glutamate (as
ompared with a valine substitution in HbS). [Note: This substitu-
on causes HbC to move more slowly toward the anode than HbA
r HbS does (see Figure 3.19).] Rare patients homozygous for HbC](https://image.slidesharecdn.com/hemoglobinandmyoglobinmay232023-230522231457-1b6ec96b/85/Hemoglobin-and-myoglobin-47-320.jpg)
![• molecule of HbS contains two normal α-globin
chains and two mutant β-globin chains (βS
), in
which glutamate at position six has been replaced
with valine
• HbS less negative than HbA → HbS moves more
slowly in electrophoresis (glutamate replaced by
valine)
Val . His . Leu . Thr . Pro . Glu . Glu . Lys
1 2 3 4 5 6 7 8
C C
H
O
COO-
HbA
HbS
Val . His . Leu . Thr . Pro . Va l . Glu . Lys
CH2
CH2
1 2 3 4 5 6 7 8
Val . His . Leu . Thr . Pro . Lys . Glu . Lys
C C
O
H
CH2
CH2
CH2
CH2
NH3
+
C
H
N C
O
CH
CH3
H3C
H
H
N
H
N
trode) than does HbA (Figure 3.19). This alte
a result of the absence of the negatively cha
dues in the two β chains, thereby rendering H
HbA. [Note: Electrophoresis of hemoglobin
RBC is routinely used in the diagnosis of sick
cell disease. DNA analysis also is used (see p
2. Sickling and tis s ue anoxia: The replacemen
tamate with the nonpolar valine forms a prot
that fits into a complementary site on the β ch
globin molecule in the cell (Figure 3.20). At
deoxyhemoglobin S polymerizes inside the
work of insoluble fibrous polymers that stiffe
producing rigid, misshapen RBC. Such sic
block the flow of blood in the narrow capilla
in the supply of oxygen leads to localized ano
tion) in the tissue, causing pain and eventu
of cells in the vicinity of the blockage. The
an increase in deoxygenated HbS. [Note: T
RBC is 7.5 µm, whereas that of the microva
Compared to normal RBC, sickled cells hav
to deform and an increased tendency to ad
and so have difficulty moving through small v
ing microvascular occlusion.]
3. Variables that increas e s ickling: The ext
therefore, the severity of disease is enhan
that increases the proportion of HbS in th
is, reduces the affinity of HbS for O2). The
decreased pO2, increased pCO2, decreased
an increased concentration of 2,3-BPG in RB
4. Treatment: Therapy involves adequate hy
aggressive antibiotic therapy if infection is p
sions in patients at high risk for fatal occlus
Intermittent transfusions with packed RBC
stroke, but the benefits must be weighed
Figure 3.18
Amino acid substitutions in
hemoglobin S (HbS) and
hemoglobin C (HbC).
HbS
Val . His . Leu . Thr . Pro . Va l . Glu . Lys
1 2 3 4 5 6 7 8
Val . His . Leu . Thr . Pro . Lys . Glu . Lys
C C
O
H
HbC
CH2
CH2
CH2
CH2
NH3
+
1 2 3 4 5 6 7 8
3
3
H
N
Anode
Cathode
Power
s ource
Positions
at the
start of
electro-
phoresis
Gel
ns
s
Gel
Hemoglobins are negatively
charged and migrate toward
the anode.
HbS
HbC
HbA](https://image.slidesharecdn.com/hemoglobinandmyoglobinmay232023-230522231457-1b6ec96b/85/Hemoglobin-and-myoglobin-48-320.jpg)
![Hemoglobin C disease
for normal RBC, hence, the anemia.] Other symptoms include acute
chest syndrome, stroke, splenic and renal dysfunction, and bone
changes due to marrow hyperplasia. Heterozygotes, representing 1
in 12 African Americans, have one normal and one sickle cell gene.
The blood cells of such heterozygotes contain both HbS and HbA.
These individuals have sickle cell trait. They usually do not show
clinical symptoms (but may under conditions of extreme physical
exertion with dehydration) and can have a normal life span.
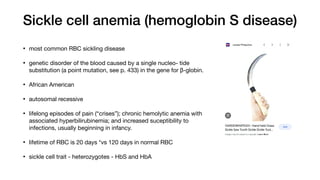
1. Amino acid s ubs titution in HbS β chains : A molecule of HbS con-
tains two normal α-globin chains and two mutant β-globin chains
(βS
), in which glutamate at position six has been replaced with
valine (Figure 3.18). Therefore, during electrophoresis at alkaline
pH, HbS migrates more slowly toward the anode (positive elec-
trode) than does HbA (Figure 3.19). This altered mobility of HbS is
a result of the absence of the negatively charged glutamate resi-
dues in the two β chains, thereby rendering HbS less negative than
HbA. [Note: Electrophoresis of hemoglobin obtained from lysed
RBC is routinely used in the diagnosis of sickle cell trait and sickle
cell disease. DNA analysis also is used (see p. 472).]
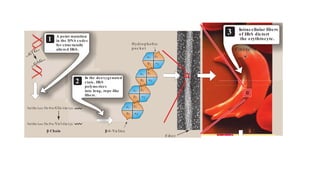
2. Sickling and tis s ue anoxia: The replacement of the charged glu-
tamate with the nonpolar valine forms a protrusion on the β chain
that fits into a complementary site on the β chain of another hemo-
globin molecule in the cell (Figure 3.20). At low oxygen tension,
deoxyhemoglobin S polymerizes inside the RBC, forming a net-
work of insoluble fibrous polymers that stiffen and distort the cell,
producing rigid, misshapen RBC. Such sickled cells frequently
block the flow of blood in the narrow capillaries. This interruption
in the supply of oxygen leads to localized anoxia (oxygen depriva-
tion) in the tissue, causing pain and eventually death (infarction)
of cells in the vicinity of the blockage. The anoxia also leads to
an increase in deoxygenated HbS. [Note: The mean diameter of
RBC is 7.5 µm, whereas that of the microvasculature is 3–4 µm.
Compared to normal RBC, sickled cells have a decreased ability
36 3. Globular Proteins
Figure 3.18
Amino acid substitutions in
hemoglobin S (HbS) and
Val . His . Leu . Thr . Pro . Glu . Glu . Lys
1 2 3 4 5 6 7 8
C C
H
O
COO-
HbA
HbS
Val . His . Leu . Thr . Pro . Va l . Glu . Lys
CH2
CH2
1 2 3 4 5 6 7 8
Val . His . Leu . Thr . Pro . Lys . Glu . Lys
C C
O
H
HbC
CH2
CH2
CH2
CH2
NH3
+
1 2 3 4 5 6 7 8
C
H
N C
O
CH
CH3
H3C
H
H
N
H
N
that fits into a complementary site on the
globin molecule in the cell (Figure 3.20
deoxyhemoglobin S polymerizes inside
work of insoluble fibrous polymers that
producing rigid, misshapen RBC. Suc
block the flow of blood in the narrow ca
in the supply of oxygen leads to localize
tion) in the tissue, causing pain and ev
of cells in the vicinity of the blockage.
an increase in deoxygenated HbS. [No
RBC is 7.5 µm, whereas that of the mic
Compared to normal RBC, sickled cells
to deform and an increased tendency
and so have difficulty moving through sm
ing microvascular occlusion.]
3. Variables that increas e s ickling: The
therefore, the severity of disease is e
that increases the proportion of HbS
is, reduces the affinity of HbS for O2).
decreased pO2, increased pCO2, decrea
an increased concentration of 2,3-BPG i
4. Treatment: Therapy involves adequa
aggressive antibiotic therapy if infection
sions in patients at high risk for fatal oc
Intermittent transfusions with packed
stroke, but the benefits must be weig
cations of transfusion, which include
erosis), bloodborne infections, and im
Hydroxyurea (hydroxycarbamide), an
peutically useful because it increases
Figure 3.18
Amino acid substitutions in
hemoglobin S (HbS) and
hemoglobin C (HbC).
Val . His . Leu . Thr . Pro . Lys . Glu . Lys
O
HbC
CH2
CH2
CH2
CH2
NH3
+
1 2 3 4 5 6 7 8
Anode
Cathode
Figure 3.19
Diagram of hemoglobins (HbA), (HbS),
and (HbC) after electrophoresis.
Power
s ource
Positions
at the
start of
electro-
phoresis
Gel
ns
s
Gel
Hemoglobins are negatively
charged and migrate toward
the anode.
HbS
HbC
HbA](https://image.slidesharecdn.com/hemoglobinandmyoglobinmay232023-230522231457-1b6ec96b/85/Hemoglobin-and-myoglobin-51-320.jpg)
![⍺-thalassemias
• synthesis of α-globin chains is
decreased or absent, typically as
a result of deletional mutations
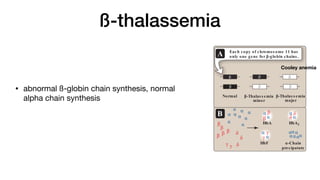
defective β-globin gene or β-thalassemia major (Cooley anemia) if
both genes are defective (Figure 3.22). Because the β-globin gene
is not expressed until late in fetal gestation, the physical manifes-
tations of β-thalassemias appear only several months after birth.
Those individuals with β-thalassemia minor make some β chains,
and usually do not require specific treatment. However, those
infants born with β-thalassemia major are seemingly healthy at
birth but become severely anemic, usually during the first or sec-
ond year of life due to ineffective erythropoiesis. Skeletal changes
as a result of extramedullary hematopoiesis also are seen.These
patients require regular transfusions of blood. [Note: Although this
treatment is lifesaving, the cumulative effect of the transfusions is
iron overload (a syndrome known as hemosiderosis). Use of iron
chelation therapy has improved morbidity and mortality.] The only
curative option available is hematopoietic stem cell transplantation.
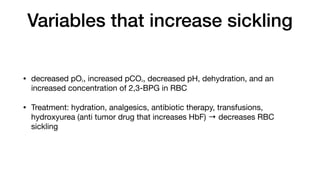
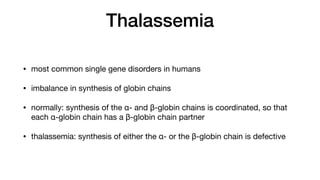
2. α-Thalas s emias : In these disorders, synthesis of α-globin chains
is decreased or absent, typically as a result of deletional muta-
tions. Because each individual’s genome contains four copies
of the α-globin gene (two on each chromosome 16), there are
several levels of α-globin chain deficiencies (Figure 3.23). If one
of the four genes is defective, the individual is termed a silent car-
rier of α-thalassemia, because no physical manifestations of the
disease occur. If two α-globin genes are defective, the individual is
designated as having α-thalassemia trait. If three α-globin genes
are defective, the individual has hemoglobin H (β4) disease, a
hemolytic anemia of variable severity. If all four α-globin genes are
defective, hemoglobin Bart (γ4) disease with hydrops fetalis and
fetal death results, because α-globin chains are required for the
synthesis of HbF.
V. CHAPTER SUMMARY
Hemoglobin A (HbA), the major hemoglobin (Hb) in adults, is com-
posed of four polypeptide chains (two α chains and two β chains, α2β2)
held together by noncovalent interactions (Figure 3.24). The subunits
α-Thalas s emia trait
(heterozygous form)
α-Thalas s emia trait
(heterozygous form)
Hemoglobin H
dis eas e
(variable s everity)
Hemoglobin Bart
dis eas e with hydrops
fetalis (us ually fatal
at birth)
Normal
individuals
"Silent"
carrier
Chromos ome
16 pair
Deleted gene for
α-globin chain
Show s ome
mild s ymptoms
clinically
α1
α1
α2
α2
α1
α1
α2
α2
α1
α1
α1
α1
α2
α2
α1
α1
α2
α2
α2
α2
α1
α1
α2
α2
α1
1 α2 α1 α2
Each copy of chromos ome 16 has
two adjacent genes for α-globin chains .
B β β
β
α
V. CHAPTER SUMMARY
Hemoglobin A (HbA), the major hemoglobin (Hb) in adults, is com-
posed of four polypeptide chains (two α chains and two β chains, α2β2)
held together by noncovalent interactions (Figure 3.24). The subunits
occupy different relative positions in deoxyhemoglobin compared with
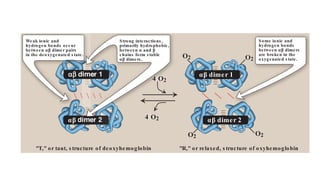
oxyhemoglobin. The deoxy form of Hb is called the “T,” or taut (tens e)
conformation. It has a constrained structure that limits the movement
of the polypeptide chains. The T form is the low-oxygen-affinity form
of Hb. The binding of O2 to Hb causes rupture of some of the ionic and
hydrogen bonds, and movement of the dimers. This leads to a structure
called the “R,” or relaxed conformation. The R form is the high-oxygen-
affinity form of Hb. The oxygen-dis s ociation curve for Hb is s igmoidal
in shape (in contrast to that of myoglobin, which is hyperbolic), indicat-
ing that the subunits cooperate in binding O2. Cooperative binding of
O2 by the four subunits of Hb means that the binding of an O2 molecule
at one heme group increases the oxygen affinity of the remaining heme
groups in the same Hb molecule. Hb’s ability to bind O2 revers ibly is
Figure 3.23
Hemoglobin H
dis eas e
(variable s everity)
Hemoglobin Bart
dis eas e with hydrops
fetalis (us ually fatal
at birth)
α1
α1
α2
α2
α1
α1
α2
α2
HbA
B
α
β β
β
β β
β
β
β β
β β
β β
β β
β β
β β
β β
β
β
γ
γ
γ
δ
δ
α
α
HbH
(precipitates
forming
Heinz
bodies )
α
A. α-Globin gene deletions in the
α-thalassemias. B. Hemoglobin (Hb)
tetramers formed in α-thalassemias.
Hb Bart
γ
γ
γ
γ](https://image.slidesharecdn.com/hemoglobinandmyoglobinmay232023-230522231457-1b6ec96b/85/Hemoglobin-and-myoglobin-56-320.jpg)


![[Brief]Structure and functions of hemoglobin and myglobin (Bio-Inorganic chem...](https://cdn.slidesharecdn.com/ss_thumbnails/briefstructureandfunctionsofhb-mb-180511052541-thumbnail.jpg?width=640&height=640&fit=bounds)


![CTEV [ clubfoot] DR ARUN LAL ,DR MOHAMED ASHRAF travancore medical college k...](https://cdn.slidesharecdn.com/ss_thumbnails/ctevclubfootdrarunlaldrmohamedashraftravancoremedicalcollegekollamkeralaindia-260208063247-18fc466c-thumbnail.jpg?width=640&height=640&fit=bounds)


