HEG Fuel Spreadsheet Dashboard
•
0 likes•19 views
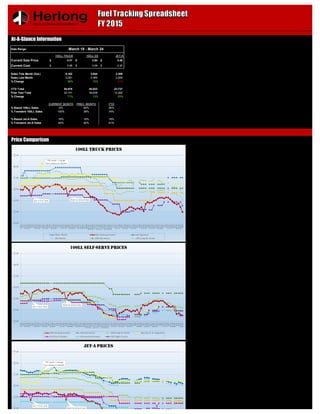
I created a comprehensive spreadsheet for First Coast Flight Center at Herlong Recreational Airport (HEG) that tracked gallons sold, the cost of fuel, transient vs. based sales, etc. This document shows the dashboard of that file.
Report
Share
Report
Share
Download to read offline

Recommended
Si t libenter shares
The document outlines the shareholder structure of a company with shares divided among family members (79% of shares), investors (19% of shares), and partners (2% of shares). The family shareholders include parents, siblings, and children each holding approximately 9.875% of the family shares. The investor shares are divided 80/20 between two investors holding 15.2% and 3.8% respectively. The partner shares are split 80/20, 1%, and 0.9% among three partners.
Okanagan August 2022 Statistics Report
The document provides monthly real estate statistics for the Central Okanagan region. It shows that in August 2022, there were 969 total listings, 428 sales, and $353 million in sales volume. Listings were up 24% from last August while sales were down 27% and sales volume was down 25%. The average days to sell a home was 42 days.
Feb 2021 Central Okangan Monthly Statistics Report
The document provides monthly real estate statistics for the Central Okanagan region of British Columbia for February 2021. It includes information on listings, sales, prices and inventory for residential and commercial properties. Some key details are:
- Total listings increased 15.73% from February 2020 to 905 listings.
- Total unit sales were up 137.78% to 749 sales compared to last February.
- The total sales volume was $526,207,990, an increase of 210.25% from February 2020.
- The average days to sell a property was 90 days.
July 2021 Okanagan Statistics
This document provides monthly real estate statistics for the Central Okanagan region. It includes information on listings, sales, prices and inventory for July 2021 compared to the previous month and July 2020. Some key figures are:
- Total listings in July 2021 were down 32.44% from July 2020.
- Total sales were down 17.64% from the previous year with 621 units sold.
- The average price was $476,777,381 and the median days to sell was 79 days.
Philadelphia Metropolitan Market Conditions Report
- In September 2013, the median home sale price in the Philadelphia metropolitan area was $215,000, a 2% increase from September 2012. Total home sales were up 11% compared to the previous year while active listings decreased by 11%. The months of housing supply was estimated at 7.3 months, down 20% from September 2012.
The Okanagan Real Estate April 2022 Statistics
This document provides monthly statistics for the Central Okanagan region for April 2022. It includes information on listings, sales, prices and inventory across several zones in the region for both the current month and year-to-date. Key figures show a decline in unit sales of 34.9% from last April but prices remained stable. Inventory levels increased 8.32% from the previous year indicating a slower market.
July 2022 - Okanagan Statistics
The document provides monthly real estate statistics for the Central Okanagan region. It shows that in July 2022, there were 976 new listings, 326 sales, and total sales volume of $303 million. Compared to July 2021, new listings were up 19.9% while sales were down 47.2% and total sales volume decreased 35.98%. For the year-to-date period, new listings increased 8.36% from last year to 7,056, while sales fell 31.95% and total sales volume declined 18.39%.
Okanagan Real Estate June 2021 Statistics
The document provides monthly statistics for June 2021 on real estate activity in the Central Okanagan region of British Columbia. Some key details include:
- Total listings were down 9.77% from last June while year-to-date listings were up 20.29%
- 787 units were sold in June, up 52.22% from last June
- Total sales volume in June was $630 million, up 107.41% from last June
- Average days to sell was 70 days, down 51.72% from last June
- Total active listings were down 50.09% from last June
The Okanagan March 2021 Statistics Package
The document provides monthly statistics for the Central Okanagan region for March 2021. It includes information on listings, sales, prices and inventory totals for the month and year-to-date across different property types and sub-regions. Key figures show a 19.5% increase in listings, 153% increase in sales volume, and average days to sell decreasing 33.6% compared to last March. Residential unit sales were up 134.7% while condo/townhouse sales rose 101.4% and lots increased 569%.
Central Okanagan Statistics Package October 2021
This document provides monthly real estate statistics for the Central Okanagan region of British Columbia for October 2021. It includes information on listings, sales, prices and inventory for residential, commercial, and farm properties across several zones in the region for both the month of October and year-to-date. Overall, the number of listings was up slightly while units sold were down nearly 20% compared to the previous October. The average and median sales prices were largely unchanged from the prior year.
Robin Hanson PM Summit SFO 2009
This document discusses combinatorial prediction markets and some of the issues involved in implementing them. It describes a simple prototype implementation using states, prices, and user assets. Experimental results are presented comparing different market mechanisms using 7 and 255 independent prices over time, showing how well prices aggregated information from a group.
April 2023 Okanagan Statistics Graphs.pdf
The document provides monthly statistics for the Central Okanagan region for April 2023. Some key details include:
- Total listings were down 26.94% from last year while units sold were down 26.29%. Sales volume was down 38.16% from April 2022.
- By property type, condo/apartment listings were down 21.18%, sales were down 20.83%, and the average price was $490,683.
- Residential properties made up the largest percentages of listings (33.73%) and sales (20.76%). The average residential price was $1,083,027.
- Overall, the region saw decreases in listings, sales, and
Central Okangan Monthly Statistics - February 2023.pdf
Okanagan Statistics February 2023 with charts and graphs. KELOWNA, B.C. – March 7th, 2023. Residential real estate sales showing positive signs of normalizing compared to the previous years of over stimulated market activity, reports the Association of Interior REALTORS® (the Association). A total of 831 residential unit sales were recorded across the Association region in February representing a 46.1% decrease in sales compared to the hyper market of February 2022, yet up compared to January’s 555
unit sales.
Okanagan Stats June 2022
This document provides monthly real estate statistics for the Central Okanagan region of British Columbia for June 2022. Some key details include:
- Total listings were up 31.14% from last June to 1,373 while sales were down 46.38% to 422.
- The average price was down 44.01% from last June to $353,566,750, with days to sell averaging 34 days.
- By property type, residential unit sales saw the largest decrease of 53.22% to 160 units sold, while apartment sales dropped 50.49% to 102 units.
- Year-to-date totals show listings up 6.86% but sales down 28.63%,
Okanagan Statistics May2023.pdf
The document provides monthly statistics for the Central Okanagan region for May 2023. It includes information on listings, sales, prices and inventory for various property types by zone. A total of 1,151 properties were listed, down 11% from last year. 599 properties were sold, up 2% from last year. The average sales price was $511 million, down slightly from last year. Overall inventory levels were up 26% from the previous year.
Treb Market Watch - January 2016
The document is the Toronto Real Estate Board's January 2016 Market Watch report. It summarizes residential real estate sales activity in the Greater Toronto Area in January 2016. Some key points:
- Residential transactions in January 2016 increased 8.2% compared to January 2015, with 4,672 transactions reported.
- The average home price increased 14.1% year-over-year to $631,092, while the MLS Home Price Index rose 11.2%. Price growth was stronger for detached homes, semis and towns.
- Market conditions were tighter compared to a year ago, with higher sales amid fewer new listings and active listings.
March 2017 - TREB Market
Toronto real estate market conditions remained tight in March 2017, with sales up 17.7% and new listings up 15.2% compared to March 2016. While new listings increased, the rate of growth was lower than the rate of sales growth, contributing to ongoing tight market conditions. The average selling price across the Greater Toronto Area increased 33.2% year-over-year to $916,567. Strong competition between buyers continued to drive high levels of price growth in all major housing segments in the region.
March 2017 market watch
Toronto real estate market conditions remained tight in March 2017, with sales up 17.7% and new listings up 15.2% compared to March 2016. While new listings increased, the rate of growth was lower than the rate of sales growth, contributing to ongoing tight market conditions. The average selling price increased 33.2% year-over-year to $916,567. Price growth continued to accelerate as demand outpaced supply. Policymakers were urged to follow an evidence-based approach to balancing the market through increased listings growth over an extended period.
Central Okanagan April 2021 Statistics Package
The document provides monthly statistics for the Central Okanagan region for April 2021. It includes information such as total listings, sales, sales volume, average/median prices, and days to sell for different property types. Some key figures are that total listings increased 85.94% from last April to 1,177, total unit sales increased 335% to 957, and total sales volume increased 494.37% to $722,293,749. The average days to sell decreased from 41 days last April to 70 days.
December 2021 The Okanagan Real Estate Statistics Package
The document provides monthly real estate statistics for the Central Okanagan region of British Columbia. It includes information on inventory, sales, prices, and days to sell for December 2021 and year-to-date totals. Some key details are:
- Total listings in December were 383, down 18.16% from the previous year.
- 403 properties sold in December for a total of $329 million, declines of 22.2% and 17.82% respectively from the previous year.
- The average days to sell was 76, down 33.05% from the previous year.
Market watch jul 2019 frank yu oakville
- Sales of homes in the Greater Toronto Area increased 24.3% in July 2019 compared to July 2018, with a total of 8,595 homes sold. The average selling price increased 3.2% year-over-year to $806,755.
- New listings increased at a slower annual rate of 3.7% compared to sales, tightening market conditions. Active listings were down 9.1% year-over-year.
- Detached home prices remained lower than last year's levels in some parts of the GTA, while condos, townhouses and semis saw stronger price growth due to high buyer demand.
TORONTO REAL ESTATE BOARD'S -- MARKET WATCH - JULY 2019
Toronto Real Estate Board President Michael Collins announced that Greater Toronto Area REALTORS® reported 8,595 sales through TREB's MLS® System in July 2019. This result was up by 24.3 per cent compared to July 2018. On a month-over-month basis, sales were up by 5.1 per cent, after preliminary seasonal adjustment.
New listings entered into TREB's MLS® System in July 2019 were up compared to July 2018, but by a much lesser annual rate than sales, at 3.7 per cent. With annual growth in sales far outstripping annual growth in new listings, market conditions clearly tightened compared to last year. Active listings at the end of July were down by 9.1 per cent year-over-year, further reflecting tightening market conditions.
As market conditions continued to tighten in July, the average selling price increased by 3.2 per cent on a year-over-year basis to $806,755. The MLS® Home Price Index Composite benchmark was up by 4.4 per cent. Higher density home types continued to drive price growth, whereas detached home prices remained down in many communities throughout the GTA.
Broadly speaking, increased competition between buyers for available properties has resulted in relatively strong price growth above the rate of inflation for semi-detached houses, townhouses and condominium apartments. However, the single-detached market segment, which has arguably been impacted most by the OSFI stress test, has experienced a slower pace of price growth, with average detached prices remaining lower than last year's levels in some parts of the GTA.
Okanagan Monthly Statistics - December 2022
The Okanagan Valley Monthly Statistics for December 2022 with charts and graphs. Residential real estate sales concluded 2022 with softened sales activity for the month of December, reports the Association of Interior REALTORS® (the Association). A total of 572 residential unit sales were recorded across the Association region in December representing a 42.8% decrease in sales compared to the number of units sold during the unusually strong market of
December 2021.
Okanagan Stats May 2022
The document provides monthly statistics for the Central Okanagan region for May 2022. It includes information on listings, sales, prices and inventory for various property types by zone. Key figures show a 13.4% increase in listings but a 29.1% decrease in sales compared to last year. The average and median prices decreased 23.5% and 21.6% respectively from May 2021. Total active listings were up 65.2% from the previous month.
March 2022 Okanagan Statistics
The document provides monthly statistics for the Central Okanagan region for March 2022. It includes information on listings, sales, prices and inventory totals for various property types by zone. Some key figures are:
- Total listings were down 16.4% from last year to 1,277
- Sales were down 33.3% to 692 units
- Total sales volume was down 13% to $665 million
- Average days to sell a property was 52 days
- Active listings finished the month at 1,446, down 12.5% from the previous year.
The Triangle Area, NC Market Conditions Report
This report summarizes housing market statistics for the Triangle area of North Carolina in September 2013. The median home sale price was $199,000, a 4% increase from the previous year. Total home sales were up 14% compared to September 2012, while active housing inventory was down 30%. The average time on market decreased 18% to 96 days.
The Okanagan Valley Real Estate Statistics Package September 2021
The document provides monthly real estate statistics for the Central Okanagan region of British Columbia. Some key details from September 2021 include:
- Total listings were down 13.64% from last year while year-to-date listings were up 4.43%.
- Total unit sales were down 27.45% from last year. The average days to sell a property was 75 days.
- Total sales volume was down 13.09% from last year, reaching $465,721,469 for the month.
06-04-2024 - NYC Tech Week - Discussion on Vector Databases, Unstructured Dat...
06-04-2024 - NYC Tech Week - Discussion on Vector Databases, Unstructured Data and AI
Discussion on Vector Databases, Unstructured Data and AI
https://www.meetup.com/unstructured-data-meetup-new-york/
This meetup is for people working in unstructured data. Speakers will come present about related topics such as vector databases, LLMs, and managing data at scale. The intended audience of this group includes roles like machine learning engineers, data scientists, data engineers, software engineers, and PMs.This meetup was formerly Milvus Meetup, and is sponsored by Zilliz maintainers of Milvus.
Beyond the Basics of A/B Tests: Highly Innovative Experimentation Tactics You...
This webinar will explore cutting-edge, less familiar but powerful experimentation methodologies which address well-known limitations of standard A/B Testing. Designed for data and product leaders, this session aims to inspire the embrace of innovative approaches and provide insights into the frontiers of experimentation!
More Related Content
Similar to HEG Fuel Spreadsheet Dashboard
The Okanagan March 2021 Statistics Package
The document provides monthly statistics for the Central Okanagan region for March 2021. It includes information on listings, sales, prices and inventory totals for the month and year-to-date across different property types and sub-regions. Key figures show a 19.5% increase in listings, 153% increase in sales volume, and average days to sell decreasing 33.6% compared to last March. Residential unit sales were up 134.7% while condo/townhouse sales rose 101.4% and lots increased 569%.
Central Okanagan Statistics Package October 2021
This document provides monthly real estate statistics for the Central Okanagan region of British Columbia for October 2021. It includes information on listings, sales, prices and inventory for residential, commercial, and farm properties across several zones in the region for both the month of October and year-to-date. Overall, the number of listings was up slightly while units sold were down nearly 20% compared to the previous October. The average and median sales prices were largely unchanged from the prior year.
Robin Hanson PM Summit SFO 2009
This document discusses combinatorial prediction markets and some of the issues involved in implementing them. It describes a simple prototype implementation using states, prices, and user assets. Experimental results are presented comparing different market mechanisms using 7 and 255 independent prices over time, showing how well prices aggregated information from a group.
April 2023 Okanagan Statistics Graphs.pdf
The document provides monthly statistics for the Central Okanagan region for April 2023. Some key details include:
- Total listings were down 26.94% from last year while units sold were down 26.29%. Sales volume was down 38.16% from April 2022.
- By property type, condo/apartment listings were down 21.18%, sales were down 20.83%, and the average price was $490,683.
- Residential properties made up the largest percentages of listings (33.73%) and sales (20.76%). The average residential price was $1,083,027.
- Overall, the region saw decreases in listings, sales, and
Central Okangan Monthly Statistics - February 2023.pdf
Okanagan Statistics February 2023 with charts and graphs. KELOWNA, B.C. – March 7th, 2023. Residential real estate sales showing positive signs of normalizing compared to the previous years of over stimulated market activity, reports the Association of Interior REALTORS® (the Association). A total of 831 residential unit sales were recorded across the Association region in February representing a 46.1% decrease in sales compared to the hyper market of February 2022, yet up compared to January’s 555
unit sales.
Okanagan Stats June 2022
This document provides monthly real estate statistics for the Central Okanagan region of British Columbia for June 2022. Some key details include:
- Total listings were up 31.14% from last June to 1,373 while sales were down 46.38% to 422.
- The average price was down 44.01% from last June to $353,566,750, with days to sell averaging 34 days.
- By property type, residential unit sales saw the largest decrease of 53.22% to 160 units sold, while apartment sales dropped 50.49% to 102 units.
- Year-to-date totals show listings up 6.86% but sales down 28.63%,
Okanagan Statistics May2023.pdf
The document provides monthly statistics for the Central Okanagan region for May 2023. It includes information on listings, sales, prices and inventory for various property types by zone. A total of 1,151 properties were listed, down 11% from last year. 599 properties were sold, up 2% from last year. The average sales price was $511 million, down slightly from last year. Overall inventory levels were up 26% from the previous year.
Treb Market Watch - January 2016
The document is the Toronto Real Estate Board's January 2016 Market Watch report. It summarizes residential real estate sales activity in the Greater Toronto Area in January 2016. Some key points:
- Residential transactions in January 2016 increased 8.2% compared to January 2015, with 4,672 transactions reported.
- The average home price increased 14.1% year-over-year to $631,092, while the MLS Home Price Index rose 11.2%. Price growth was stronger for detached homes, semis and towns.
- Market conditions were tighter compared to a year ago, with higher sales amid fewer new listings and active listings.
March 2017 - TREB Market
Toronto real estate market conditions remained tight in March 2017, with sales up 17.7% and new listings up 15.2% compared to March 2016. While new listings increased, the rate of growth was lower than the rate of sales growth, contributing to ongoing tight market conditions. The average selling price across the Greater Toronto Area increased 33.2% year-over-year to $916,567. Strong competition between buyers continued to drive high levels of price growth in all major housing segments in the region.
March 2017 market watch
Toronto real estate market conditions remained tight in March 2017, with sales up 17.7% and new listings up 15.2% compared to March 2016. While new listings increased, the rate of growth was lower than the rate of sales growth, contributing to ongoing tight market conditions. The average selling price increased 33.2% year-over-year to $916,567. Price growth continued to accelerate as demand outpaced supply. Policymakers were urged to follow an evidence-based approach to balancing the market through increased listings growth over an extended period.
Central Okanagan April 2021 Statistics Package
The document provides monthly statistics for the Central Okanagan region for April 2021. It includes information such as total listings, sales, sales volume, average/median prices, and days to sell for different property types. Some key figures are that total listings increased 85.94% from last April to 1,177, total unit sales increased 335% to 957, and total sales volume increased 494.37% to $722,293,749. The average days to sell decreased from 41 days last April to 70 days.
December 2021 The Okanagan Real Estate Statistics Package
The document provides monthly real estate statistics for the Central Okanagan region of British Columbia. It includes information on inventory, sales, prices, and days to sell for December 2021 and year-to-date totals. Some key details are:
- Total listings in December were 383, down 18.16% from the previous year.
- 403 properties sold in December for a total of $329 million, declines of 22.2% and 17.82% respectively from the previous year.
- The average days to sell was 76, down 33.05% from the previous year.
Market watch jul 2019 frank yu oakville
- Sales of homes in the Greater Toronto Area increased 24.3% in July 2019 compared to July 2018, with a total of 8,595 homes sold. The average selling price increased 3.2% year-over-year to $806,755.
- New listings increased at a slower annual rate of 3.7% compared to sales, tightening market conditions. Active listings were down 9.1% year-over-year.
- Detached home prices remained lower than last year's levels in some parts of the GTA, while condos, townhouses and semis saw stronger price growth due to high buyer demand.
Market watch jul 2019 frank yu oakville
- Sales of homes in the Greater Toronto Area increased 24.3% in July 2019 compared to July 2018, with a total of 8,595 homes sold. The average selling price increased 3.2% year-over-year to $806,755.
- New listings increased at a slower annual rate of 3.7% compared to sales, tightening market conditions. Active listings were down 9.1% year-over-year.
- Detached home prices remained lower than last year's levels in some parts of the GTA, while condos, townhouses and semis saw stronger price growth due to high buyer demand.
TORONTO REAL ESTATE BOARD'S -- MARKET WATCH - JULY 2019
Toronto Real Estate Board President Michael Collins announced that Greater Toronto Area REALTORS® reported 8,595 sales through TREB's MLS® System in July 2019. This result was up by 24.3 per cent compared to July 2018. On a month-over-month basis, sales were up by 5.1 per cent, after preliminary seasonal adjustment.
New listings entered into TREB's MLS® System in July 2019 were up compared to July 2018, but by a much lesser annual rate than sales, at 3.7 per cent. With annual growth in sales far outstripping annual growth in new listings, market conditions clearly tightened compared to last year. Active listings at the end of July were down by 9.1 per cent year-over-year, further reflecting tightening market conditions.
As market conditions continued to tighten in July, the average selling price increased by 3.2 per cent on a year-over-year basis to $806,755. The MLS® Home Price Index Composite benchmark was up by 4.4 per cent. Higher density home types continued to drive price growth, whereas detached home prices remained down in many communities throughout the GTA.
Broadly speaking, increased competition between buyers for available properties has resulted in relatively strong price growth above the rate of inflation for semi-detached houses, townhouses and condominium apartments. However, the single-detached market segment, which has arguably been impacted most by the OSFI stress test, has experienced a slower pace of price growth, with average detached prices remaining lower than last year's levels in some parts of the GTA.
Okanagan Monthly Statistics - December 2022
The Okanagan Valley Monthly Statistics for December 2022 with charts and graphs. Residential real estate sales concluded 2022 with softened sales activity for the month of December, reports the Association of Interior REALTORS® (the Association). A total of 572 residential unit sales were recorded across the Association region in December representing a 42.8% decrease in sales compared to the number of units sold during the unusually strong market of
December 2021.
Okanagan Stats May 2022
The document provides monthly statistics for the Central Okanagan region for May 2022. It includes information on listings, sales, prices and inventory for various property types by zone. Key figures show a 13.4% increase in listings but a 29.1% decrease in sales compared to last year. The average and median prices decreased 23.5% and 21.6% respectively from May 2021. Total active listings were up 65.2% from the previous month.
March 2022 Okanagan Statistics
The document provides monthly statistics for the Central Okanagan region for March 2022. It includes information on listings, sales, prices and inventory totals for various property types by zone. Some key figures are:
- Total listings were down 16.4% from last year to 1,277
- Sales were down 33.3% to 692 units
- Total sales volume was down 13% to $665 million
- Average days to sell a property was 52 days
- Active listings finished the month at 1,446, down 12.5% from the previous year.
The Triangle Area, NC Market Conditions Report
This report summarizes housing market statistics for the Triangle area of North Carolina in September 2013. The median home sale price was $199,000, a 4% increase from the previous year. Total home sales were up 14% compared to September 2012, while active housing inventory was down 30%. The average time on market decreased 18% to 96 days.
The Okanagan Valley Real Estate Statistics Package September 2021
The document provides monthly real estate statistics for the Central Okanagan region of British Columbia. Some key details from September 2021 include:
- Total listings were down 13.64% from last year while year-to-date listings were up 4.43%.
- Total unit sales were down 27.45% from last year. The average days to sell a property was 75 days.
- Total sales volume was down 13.09% from last year, reaching $465,721,469 for the month.
Similar to HEG Fuel Spreadsheet Dashboard (20)
Central Okangan Monthly Statistics - February 2023.pdf
Central Okangan Monthly Statistics - February 2023.pdf
December 2021 The Okanagan Real Estate Statistics Package
December 2021 The Okanagan Real Estate Statistics Package
TORONTO REAL ESTATE BOARD'S -- MARKET WATCH - JULY 2019
TORONTO REAL ESTATE BOARD'S -- MARKET WATCH - JULY 2019
The Okanagan Valley Real Estate Statistics Package September 2021
The Okanagan Valley Real Estate Statistics Package September 2021
Recently uploaded
06-04-2024 - NYC Tech Week - Discussion on Vector Databases, Unstructured Dat...
06-04-2024 - NYC Tech Week - Discussion on Vector Databases, Unstructured Data and AI
Discussion on Vector Databases, Unstructured Data and AI
https://www.meetup.com/unstructured-data-meetup-new-york/
This meetup is for people working in unstructured data. Speakers will come present about related topics such as vector databases, LLMs, and managing data at scale. The intended audience of this group includes roles like machine learning engineers, data scientists, data engineers, software engineers, and PMs.This meetup was formerly Milvus Meetup, and is sponsored by Zilliz maintainers of Milvus.
Beyond the Basics of A/B Tests: Highly Innovative Experimentation Tactics You...
This webinar will explore cutting-edge, less familiar but powerful experimentation methodologies which address well-known limitations of standard A/B Testing. Designed for data and product leaders, this session aims to inspire the embrace of innovative approaches and provide insights into the frontiers of experimentation!
一比一原版(Coventry毕业证书)考文垂大学毕业证如何办理
毕业原版【微信:41543339】【(Coventry毕业证书)考文垂大学毕业证】【微信:41543339】成绩单、外壳、offer、留信学历认证(永久存档真实可查)采用学校原版纸张、特殊工艺完全按照原版一比一制作(包括:隐形水印,阴影底纹,钢印LOGO烫金烫银,LOGO烫金烫银复合重叠,文字图案浮雕,激光镭射,紫外荧光,温感,复印防伪)行业标杆!精益求精,诚心合作,真诚制作!多年品质 ,按需精细制作,24小时接单,全套进口原装设备,十五年致力于帮助留学生解决难题,业务范围有加拿大、英国、澳洲、韩国、美国、新加坡,新西兰等学历材料,包您满意。
【我们承诺采用的是学校原版纸张(纸质、底色、纹路),我们拥有全套进口原装设备,特殊工艺都是采用不同机器制作,仿真度基本可以达到100%,所有工艺效果都可提前给客户展示,不满意可以根据客户要求进行调整,直到满意为止!】
【业务选择办理准则】
一、工作未确定,回国需先给父母、亲戚朋友看下文凭的情况,办理一份就读学校的毕业证【微信41543339】文凭即可
二、回国进私企、外企、自己做生意的情况,这些单位是不查询毕业证真伪的,而且国内没有渠道去查询国外文凭的真假,也不需要提供真实教育部认证。鉴于此,办理一份毕业证【微信41543339】即可
三、进国企,银行,事业单位,考公务员等等,这些单位是必需要提供真实教育部认证的,办理教育部认证所需资料众多且烦琐,所有材料您都必须提供原件,我们凭借丰富的经验,快捷的绿色通道帮您快速整合材料,让您少走弯路。
留信网认证的作用:
1:该专业认证可证明留学生真实身份
2:同时对留学生所学专业登记给予评定
3:国家专业人才认证中心颁发入库证书
4:这个认证书并且可以归档倒地方
5:凡事获得留信网入网的信息将会逐步更新到个人身份内,将在公安局网内查询个人身份证信息后,同步读取人才网入库信息
6:个人职称评审加20分
7:个人信誉贷款加10分
8:在国家人才网主办的国家网络招聘大会中纳入资料,供国家高端企业选择人才
留信网服务项目:
1、留学生专业人才库服务(留信分析)
2、国(境)学习人员提供就业推荐信服务
3、留学人员区块链存储服务
→ 【关于价格问题(保证一手价格)】
我们所定的价格是非常合理的,而且我们现在做得单子大多数都是代理和回头客户介绍的所以一般现在有新的单子 我给客户的都是第一手的代理价格,因为我想坦诚对待大家 不想跟大家在价格方面浪费时间
对于老客户或者被老客户介绍过来的朋友,我们都会适当给一些优惠。
选择实体注册公司办理,更放心,更安全!我们的承诺:客户在留信官方认证查询网站查询到认证通过结果后付款,不成功不收费!
一比一原版(Harvard毕业证书)哈佛大学毕业证如何办理
毕业原版【微信:41543339】【(Harvard毕业证书)哈佛大学毕业证】【微信:41543339】成绩单、外壳、offer、留信学历认证(永久存档真实可查)采用学校原版纸张、特殊工艺完全按照原版一比一制作(包括:隐形水印,阴影底纹,钢印LOGO烫金烫银,LOGO烫金烫银复合重叠,文字图案浮雕,激光镭射,紫外荧光,温感,复印防伪)行业标杆!精益求精,诚心合作,真诚制作!多年品质 ,按需精细制作,24小时接单,全套进口原装设备,十五年致力于帮助留学生解决难题,业务范围有加拿大、英国、澳洲、韩国、美国、新加坡,新西兰等学历材料,包您满意。
【我们承诺采用的是学校原版纸张(纸质、底色、纹路),我们拥有全套进口原装设备,特殊工艺都是采用不同机器制作,仿真度基本可以达到100%,所有工艺效果都可提前给客户展示,不满意可以根据客户要求进行调整,直到满意为止!】
【业务选择办理准则】
一、工作未确定,回国需先给父母、亲戚朋友看下文凭的情况,办理一份就读学校的毕业证【微信41543339】文凭即可
二、回国进私企、外企、自己做生意的情况,这些单位是不查询毕业证真伪的,而且国内没有渠道去查询国外文凭的真假,也不需要提供真实教育部认证。鉴于此,办理一份毕业证【微信41543339】即可
三、进国企,银行,事业单位,考公务员等等,这些单位是必需要提供真实教育部认证的,办理教育部认证所需资料众多且烦琐,所有材料您都必须提供原件,我们凭借丰富的经验,快捷的绿色通道帮您快速整合材料,让您少走弯路。
留信网认证的作用:
1:该专业认证可证明留学生真实身份
2:同时对留学生所学专业登记给予评定
3:国家专业人才认证中心颁发入库证书
4:这个认证书并且可以归档倒地方
5:凡事获得留信网入网的信息将会逐步更新到个人身份内,将在公安局网内查询个人身份证信息后,同步读取人才网入库信息
6:个人职称评审加20分
7:个人信誉贷款加10分
8:在国家人才网主办的国家网络招聘大会中纳入资料,供国家高端企业选择人才
留信网服务项目:
1、留学生专业人才库服务(留信分析)
2、国(境)学习人员提供就业推荐信服务
3、留学人员区块链存储服务
→ 【关于价格问题(保证一手价格)】
我们所定的价格是非常合理的,而且我们现在做得单子大多数都是代理和回头客户介绍的所以一般现在有新的单子 我给客户的都是第一手的代理价格,因为我想坦诚对待大家 不想跟大家在价格方面浪费时间
对于老客户或者被老客户介绍过来的朋友,我们都会适当给一些优惠。
选择实体注册公司办理,更放心,更安全!我们的承诺:客户在留信官方认证查询网站查询到认证通过结果后付款,不成功不收费!
在线办理(英国UCA毕业证书)创意艺术大学毕业证在读证明一模一样
学校原件一模一样【微信:741003700 】《(英国UCA毕业证书)创意艺术大学毕业证》【微信:741003700 】学位证,留信认证(真实可查,永久存档)原件一模一样纸张工艺/offer、雅思、外壳等材料/诚信可靠,可直接看成品样本,帮您解决无法毕业带来的各种难题!外壳,原版制作,诚信可靠,可直接看成品样本。行业标杆!精益求精,诚心合作,真诚制作!多年品质 ,按需精细制作,24小时接单,全套进口原装设备。十五年致力于帮助留学生解决难题,包您满意。
本公司拥有海外各大学样板无数,能完美还原。
1:1完美还原海外各大学毕业材料上的工艺:水印,阴影底纹,钢印LOGO烫金烫银,LOGO烫金烫银复合重叠。文字图案浮雕、激光镭射、紫外荧光、温感、复印防伪等防伪工艺。材料咨询办理、认证咨询办理请加学历顾问Q/微741003700
【主营项目】
一.毕业证【q微741003700】成绩单、使馆认证、教育部认证、雅思托福成绩单、学生卡等!
二.真实使馆公证(即留学回国人员证明,不成功不收费)
三.真实教育部学历学位认证(教育部存档!教育部留服网站永久可查)
四.办理各国各大学文凭(一对一专业服务,可全程监控跟踪进度)
如果您处于以下几种情况:
◇在校期间,因各种原因未能顺利毕业……拿不到官方毕业证【q/微741003700】
◇面对父母的压力,希望尽快拿到;
◇不清楚认证流程以及材料该如何准备;
◇回国时间很长,忘记办理;
◇回国马上就要找工作,办给用人单位看;
◇企事业单位必须要求办理的
◇需要报考公务员、购买免税车、落转户口
◇申请留学生创业基金
留信网认证的作用:
1:该专业认证可证明留学生真实身份
2:同时对留学生所学专业登记给予评定
3:国家专业人才认证中心颁发入库证书
4:这个认证书并且可以归档倒地方
5:凡事获得留信网入网的信息将会逐步更新到个人身份内,将在公安局网内查询个人身份证信息后,同步读取人才网入库信息
6:个人职称评审加20分
7:个人信誉贷款加10分
8:在国家人才网主办的国家网络招聘大会中纳入资料,供国家高端企业选择人才
06-12-2024-BudapestDataForum-BuildingReal-timePipelineswithFLaNK AIM
06-12-2024-BudapestDataForum-BuildingReal-timePipelineswithFLaNK AIM
by
Timothy Spann
Principal Developer Advocate
https://budapestdata.hu/2024/en/
https://budapestml.hu/2024/en/
tim.spann@zilliz.com
https://www.linkedin.com/in/timothyspann/
https://x.com/paasdev
https://github.com/tspannhw
https://www.youtube.com/@flank-stack
milvus
vector database
gen ai
generative ai
deep learning
machine learning
apache nifi
apache pulsar
apache kafka
apache flink
一比一原版(UMN文凭证书)明尼苏达大学毕业证如何办理
毕业原版【微信:176555708】【(UMN毕业证书)明尼苏达大学毕业证】【微信:176555708】成绩单、外壳、offer、留信学历认证(永久存档真实可查)采用学校原版纸张、特殊工艺完全按照原版一比一制作(包括:隐形水印,阴影底纹,钢印LOGO烫金烫银,LOGO烫金烫银复合重叠,文字图案浮雕,激光镭射,紫外荧光,温感,复印防伪)行业标杆!精益求精,诚心合作,真诚制作!多年品质 ,按需精细制作,24小时接单,全套进口原装设备,十五年致力于帮助留学生解决难题,业务范围有加拿大、英国、澳洲、韩国、美国、新加坡,新西兰等学历材料,包您满意。
【我们承诺采用的是学校原版纸张(纸质、底色、纹路),我们拥有全套进口原装设备,特殊工艺都是采用不同机器制作,仿真度基本可以达到100%,所有工艺效果都可提前给客户展示,不满意可以根据客户要求进行调整,直到满意为止!】
【业务选择办理准则】
一、工作未确定,回国需先给父母、亲戚朋友看下文凭的情况,办理一份就读学校的毕业证【微信176555708】文凭即可
二、回国进私企、外企、自己做生意的情况,这些单位是不查询毕业证真伪的,而且国内没有渠道去查询国外文凭的真假,也不需要提供真实教育部认证。鉴于此,办理一份毕业证【微信176555708】即可
三、进国企,银行,事业单位,考公务员等等,这些单位是必需要提供真实教育部认证的,办理教育部认证所需资料众多且烦琐,所有材料您都必须提供原件,我们凭借丰富的经验,快捷的绿色通道帮您快速整合材料,让您少走弯路。
留信网认证的作用:
1:该专业认证可证明留学生真实身份
2:同时对留学生所学专业登记给予评定
3:国家专业人才认证中心颁发入库证书
4:这个认证书并且可以归档倒地方
5:凡事获得留信网入网的信息将会逐步更新到个人身份内,将在公安局网内查询个人身份证信息后,同步读取人才网入库信息
6:个人职称评审加20分
7:个人信誉贷款加10分
8:在国家人才网主办的国家网络招聘大会中纳入资料,供国家高端企业选择人才
留信网服务项目:
1、留学生专业人才库服务(留信分析)
2、国(境)学习人员提供就业推荐信服务
3、留学人员区块链存储服务
→ 【关于价格问题(保证一手价格)】
我们所定的价格是非常合理的,而且我们现在做得单子大多数都是代理和回头客户介绍的所以一般现在有新的单子 我给客户的都是第一手的代理价格,因为我想坦诚对待大家 不想跟大家在价格方面浪费时间
对于老客户或者被老客户介绍过来的朋友,我们都会适当给一些优惠。
选择实体注册公司办理,更放心,更安全!我们的承诺:客户在留信官方认证查询网站查询到认证通过结果后付款,不成功不收费!
Intelligence supported media monitoring in veterinary medicine
Media monitoring in veterinary medicien
University of New South Wales degree offer diploma Transcript
澳洲UNSW毕业证书制作新南威尔士大学假文凭定制Q微168899991做UNSW留信网教留服认证海牙认证改UNSW成绩单GPA做UNSW假学位证假文凭高仿毕业证申请新南威尔士大学University of New South Wales degree offer diploma Transcript
The Ipsos - AI - Monitor 2024 Report.pdf
According to Ipsos AI Monitor's 2024 report, 65% Indians said that products and services using AI have profoundly changed their daily life in the past 3-5 years.
一比一原版(爱大毕业证书)爱丁堡大学毕业证如何办理
毕业原版【微信:41543339】【(爱大毕业证书)爱丁堡大学毕业证】【微信:41543339】成绩单、外壳、offer、留信学历认证(永久存档真实可查)采用学校原版纸张、特殊工艺完全按照原版一比一制作(包括:隐形水印,阴影底纹,钢印LOGO烫金烫银,LOGO烫金烫银复合重叠,文字图案浮雕,激光镭射,紫外荧光,温感,复印防伪)行业标杆!精益求精,诚心合作,真诚制作!多年品质 ,按需精细制作,24小时接单,全套进口原装设备,十五年致力于帮助留学生解决难题,业务范围有加拿大、英国、澳洲、韩国、美国、新加坡,新西兰等学历材料,包您满意。
【我们承诺采用的是学校原版纸张(纸质、底色、纹路),我们拥有全套进口原装设备,特殊工艺都是采用不同机器制作,仿真度基本可以达到100%,所有工艺效果都可提前给客户展示,不满意可以根据客户要求进行调整,直到满意为止!】
【业务选择办理准则】
一、工作未确定,回国需先给父母、亲戚朋友看下文凭的情况,办理一份就读学校的毕业证【微信41543339】文凭即可
二、回国进私企、外企、自己做生意的情况,这些单位是不查询毕业证真伪的,而且国内没有渠道去查询国外文凭的真假,也不需要提供真实教育部认证。鉴于此,办理一份毕业证【微信41543339】即可
三、进国企,银行,事业单位,考公务员等等,这些单位是必需要提供真实教育部认证的,办理教育部认证所需资料众多且烦琐,所有材料您都必须提供原件,我们凭借丰富的经验,快捷的绿色通道帮您快速整合材料,让您少走弯路。
留信网认证的作用:
1:该专业认证可证明留学生真实身份
2:同时对留学生所学专业登记给予评定
3:国家专业人才认证中心颁发入库证书
4:这个认证书并且可以归档倒地方
5:凡事获得留信网入网的信息将会逐步更新到个人身份内,将在公安局网内查询个人身份证信息后,同步读取人才网入库信息
6:个人职称评审加20分
7:个人信誉贷款加10分
8:在国家人才网主办的国家网络招聘大会中纳入资料,供国家高端企业选择人才
留信网服务项目:
1、留学生专业人才库服务(留信分析)
2、国(境)学习人员提供就业推荐信服务
3、留学人员区块链存储服务
→ 【关于价格问题(保证一手价格)】
我们所定的价格是非常合理的,而且我们现在做得单子大多数都是代理和回头客户介绍的所以一般现在有新的单子 我给客户的都是第一手的代理价格,因为我想坦诚对待大家 不想跟大家在价格方面浪费时间
对于老客户或者被老客户介绍过来的朋友,我们都会适当给一些优惠。
选择实体注册公司办理,更放心,更安全!我们的承诺:客户在留信官方认证查询网站查询到认证通过结果后付款,不成功不收费!
办(uts毕业证书)悉尼科技大学毕业证学历证书原版一模一样
原版一模一样【微信:741003700 】【(uts毕业证书)悉尼科技大学毕业证学历证书】【微信:741003700 】学位证,留信认证(真实可查,永久存档)offer、雅思、外壳等材料/诚信可靠,可直接看成品样本,帮您解决无法毕业带来的各种难题!外壳,原版制作,诚信可靠,可直接看成品样本。行业标杆!精益求精,诚心合作,真诚制作!多年品质 ,按需精细制作,24小时接单,全套进口原装设备。十五年致力于帮助留学生解决难题,包您满意。
本公司拥有海外各大学样板无数,能完美还原海外各大学 Bachelor Diploma degree, Master Degree Diploma
1:1完美还原海外各大学毕业材料上的工艺:水印,阴影底纹,钢印LOGO烫金烫银,LOGO烫金烫银复合重叠。文字图案浮雕、激光镭射、紫外荧光、温感、复印防伪等防伪工艺。材料咨询办理、认证咨询办理请加学历顾问Q/微741003700
留信网认证的作用:
1:该专业认证可证明留学生真实身份
2:同时对留学生所学专业登记给予评定
3:国家专业人才认证中心颁发入库证书
4:这个认证书并且可以归档倒地方
5:凡事获得留信网入网的信息将会逐步更新到个人身份内,将在公安局网内查询个人身份证信息后,同步读取人才网入库信息
6:个人职称评审加20分
7:个人信誉贷款加10分
8:在国家人才网主办的国家网络招聘大会中纳入资料,供国家高端企业选择人才
Global Situational Awareness of A.I. and where its headed
You can see the future first in San Francisco.
Over the past year, the talk of the town has shifted from $10 billion compute clusters to $100 billion clusters to trillion-dollar clusters. Every six months another zero is added to the boardroom plans. Behind the scenes, there’s a fierce scramble to secure every power contract still available for the rest of the decade, every voltage transformer that can possibly be procured. American big business is gearing up to pour trillions of dollars into a long-unseen mobilization of American industrial might. By the end of the decade, American electricity production will have grown tens of percent; from the shale fields of Pennsylvania to the solar farms of Nevada, hundreds of millions of GPUs will hum.
The AGI race has begun. We are building machines that can think and reason. By 2025/26, these machines will outpace college graduates. By the end of the decade, they will be smarter than you or I; we will have superintelligence, in the true sense of the word. Along the way, national security forces not seen in half a century will be un-leashed, and before long, The Project will be on. If we’re lucky, we’ll be in an all-out race with the CCP; if we’re unlucky, an all-out war.
Everyone is now talking about AI, but few have the faintest glimmer of what is about to hit them. Nvidia analysts still think 2024 might be close to the peak. Mainstream pundits are stuck on the wilful blindness of “it’s just predicting the next word”. They see only hype and business-as-usual; at most they entertain another internet-scale technological change.
Before long, the world will wake up. But right now, there are perhaps a few hundred people, most of them in San Francisco and the AI labs, that have situational awareness. Through whatever peculiar forces of fate, I have found myself amongst them. A few years ago, these people were derided as crazy—but they trusted the trendlines, which allowed them to correctly predict the AI advances of the past few years. Whether these people are also right about the next few years remains to be seen. But these are very smart people—the smartest people I have ever met—and they are the ones building this technology. Perhaps they will be an odd footnote in history, or perhaps they will go down in history like Szilard and Oppenheimer and Teller. If they are seeing the future even close to correctly, we are in for a wild ride.
Let me tell you what we see.
State of Artificial intelligence Report 2023
Artificial intelligence (AI) is a multidisciplinary field of science and engineering whose goal is to create intelligent machines.
We believe that AI will be a force multiplier on technological progress in our increasingly digital, data-driven world. This is because everything around us today, ranging from culture to consumer products, is a product of intelligence.
The State of AI Report is now in its sixth year. Consider this report as a compilation of the most interesting things we’ve seen with a goal of triggering an informed conversation about the state of AI and its implication for the future.
We consider the following key dimensions in our report:
Research: Technology breakthroughs and their capabilities.
Industry: Areas of commercial application for AI and its business impact.
Politics: Regulation of AI, its economic implications and the evolving geopolitics of AI.
Safety: Identifying and mitigating catastrophic risks that highly-capable future AI systems could pose to us.
Predictions: What we believe will happen in the next 12 months and a 2022 performance review to keep us honest.
STATATHON: Unleashing the Power of Statistics in a 48-Hour Knowledge Extravag...
"Join us for STATATHON, a dynamic 2-day event dedicated to exploring statistical knowledge and its real-world applications. From theory to practice, participants engage in intensive learning sessions, workshops, and challenges, fostering a deeper understanding of statistical methodologies and their significance in various fields."
一比一原版(Glasgow毕业证书)格拉斯哥大学毕业证如何办理
毕业原版【微信:41543339】【(Glasgow毕业证书)格拉斯哥大学毕业证】【微信:41543339】成绩单、外壳、offer、留信学历认证(永久存档真实可查)采用学校原版纸张、特殊工艺完全按照原版一比一制作(包括:隐形水印,阴影底纹,钢印LOGO烫金烫银,LOGO烫金烫银复合重叠,文字图案浮雕,激光镭射,紫外荧光,温感,复印防伪)行业标杆!精益求精,诚心合作,真诚制作!多年品质 ,按需精细制作,24小时接单,全套进口原装设备,十五年致力于帮助留学生解决难题,业务范围有加拿大、英国、澳洲、韩国、美国、新加坡,新西兰等学历材料,包您满意。
【我们承诺采用的是学校原版纸张(纸质、底色、纹路),我们拥有全套进口原装设备,特殊工艺都是采用不同机器制作,仿真度基本可以达到100%,所有工艺效果都可提前给客户展示,不满意可以根据客户要求进行调整,直到满意为止!】
【业务选择办理准则】
一、工作未确定,回国需先给父母、亲戚朋友看下文凭的情况,办理一份就读学校的毕业证【微信41543339】文凭即可
二、回国进私企、外企、自己做生意的情况,这些单位是不查询毕业证真伪的,而且国内没有渠道去查询国外文凭的真假,也不需要提供真实教育部认证。鉴于此,办理一份毕业证【微信41543339】即可
三、进国企,银行,事业单位,考公务员等等,这些单位是必需要提供真实教育部认证的,办理教育部认证所需资料众多且烦琐,所有材料您都必须提供原件,我们凭借丰富的经验,快捷的绿色通道帮您快速整合材料,让您少走弯路。
留信网认证的作用:
1:该专业认证可证明留学生真实身份
2:同时对留学生所学专业登记给予评定
3:国家专业人才认证中心颁发入库证书
4:这个认证书并且可以归档倒地方
5:凡事获得留信网入网的信息将会逐步更新到个人身份内,将在公安局网内查询个人身份证信息后,同步读取人才网入库信息
6:个人职称评审加20分
7:个人信誉贷款加10分
8:在国家人才网主办的国家网络招聘大会中纳入资料,供国家高端企业选择人才
留信网服务项目:
1、留学生专业人才库服务(留信分析)
2、国(境)学习人员提供就业推荐信服务
3、留学人员区块链存储服务
→ 【关于价格问题(保证一手价格)】
我们所定的价格是非常合理的,而且我们现在做得单子大多数都是代理和回头客户介绍的所以一般现在有新的单子 我给客户的都是第一手的代理价格,因为我想坦诚对待大家 不想跟大家在价格方面浪费时间
对于老客户或者被老客户介绍过来的朋友,我们都会适当给一些优惠。
选择实体注册公司办理,更放心,更安全!我们的承诺:客户在留信官方认证查询网站查询到认证通过结果后付款,不成功不收费!
Learn SQL from basic queries to Advance queries
Dive into the world of data analysis with our comprehensive guide on mastering SQL! This presentation offers a practical approach to learning SQL, focusing on real-world applications and hands-on practice. Whether you're a beginner or looking to sharpen your skills, this guide provides the tools you need to extract, analyze, and interpret data effectively.
Key Highlights:
Foundations of SQL: Understand the basics of SQL, including data retrieval, filtering, and aggregation.
Advanced Queries: Learn to craft complex queries to uncover deep insights from your data.
Data Trends and Patterns: Discover how to identify and interpret trends and patterns in your datasets.
Practical Examples: Follow step-by-step examples to apply SQL techniques in real-world scenarios.
Actionable Insights: Gain the skills to derive actionable insights that drive informed decision-making.
Join us on this journey to enhance your data analysis capabilities and unlock the full potential of SQL. Perfect for data enthusiasts, analysts, and anyone eager to harness the power of data!
#DataAnalysis #SQL #LearningSQL #DataInsights #DataScience #Analytics
Recently uploaded (20)
06-04-2024 - NYC Tech Week - Discussion on Vector Databases, Unstructured Dat...
06-04-2024 - NYC Tech Week - Discussion on Vector Databases, Unstructured Dat...
Beyond the Basics of A/B Tests: Highly Innovative Experimentation Tactics You...
Beyond the Basics of A/B Tests: Highly Innovative Experimentation Tactics You...
06-12-2024-BudapestDataForum-BuildingReal-timePipelineswithFLaNK AIM
06-12-2024-BudapestDataForum-BuildingReal-timePipelineswithFLaNK AIM
Intelligence supported media monitoring in veterinary medicine
Intelligence supported media monitoring in veterinary medicine
A presentation that explain the Power BI Licensing
A presentation that explain the Power BI Licensing
University of New South Wales degree offer diploma Transcript
University of New South Wales degree offer diploma Transcript
Global Situational Awareness of A.I. and where its headed
Global Situational Awareness of A.I. and where its headed
STATATHON: Unleashing the Power of Statistics in a 48-Hour Knowledge Extravag...
STATATHON: Unleashing the Power of Statistics in a 48-Hour Knowledge Extravag...
HEG Fuel Spreadsheet Dashboard
- 1. Sales This Month (Gal.) Sales Last Month % Change YTD Total Prior Year Total % Change % Based 100LL Sales % Transient 100LL Sales % Based Jet-A Sales % Transient Jet-A Sales JET-A 5,162 3.45$ 3,261 3,485 2,929 23,737 2.30$ 100LL SS 3.94$ 3.08$ 4.31$ 100LL TRUCK 93%71% 13% 54,976 44,833 58% 10% -21% Date Range: At-A-Glance Information 3.08$ 3,844 2,309 Current Sale Price Current Cost CURRENT MONTH 0% 100% 16% 84% 18% 82% 19% 81% PREV. MONTH YTD 64% 26% 36% 74% 32,141 39,838 12,292 March 18 - March 24 Price Comparison Sun‐'n‐Fun Sale Back‐to‐School Sale TPC week + change from Galaxy to Atlantic $3.00 $4.00 $5.00 $6.00 $7.00 $8.00 $9.00 2/26 3/5 3/12 3/19 3/26 4/2 4/9 4/16 4/23 4/30 5/7 5/14 5/21 5/28 6/4 6/11 6/18 6/25 7/2 7/9 7/16 7/23 7/30 8/6 8/13 8/20 8/27 9/3 9/10 9/17 9/24 10/1 10/8 10/15 10/22 10/29 11/5 11/12 11/19 11/26 12/3 12/10 12/17 12/24 12/31 1/7 1/14 1/21 1/28 2/4 2/11 2/18 2/25 3/4 3/11 3/18 3/25 4/1 4/8 4/15 4/22 4/29 5/6 5/13 5/20 5/27 6/3 6/10 6/17 6/24 7/1 7/8 7/15 7/22 7/29 8/5 8/12 8/19 8/26 9/2 100LL TRUCK PRICES 100LL TRUCK HEG Herlong Aviation JAX Signature JAX Sheltair CRG Sky Harbor CRG Craig Air Center Sun‐'n‐Fun Sale Back‐to‐School Sale $3.00 $4.00 $5.00 $6.00 $7.00 $8.00 $9.00 2/26 3/5 3/12 3/19 3/26 4/2 4/9 4/16 4/23 4/30 5/7 5/14 5/21 5/28 6/4 6/11 6/18 6/25 7/2 7/9 7/16 7/23 7/30 8/6 8/13 8/20 8/27 9/3 9/10 9/17 9/24 10/1 10/8 10/15 10/22 10/29 11/5 11/12 11/19 11/26 12/3 12/10 12/17 12/24 12/31 1/7 1/14 1/21 1/28 2/4 2/11 2/18 2/25 3/4 3/11 3/18 3/25 4/1 4/8 4/15 4/22 4/29 5/6 5/13 5/20 5/27 6/3 6/10 6/17 6/24 7/1 7/8 7/15 7/22 7/29 8/5 8/12 8/19 8/26 9/2 9/9 9/16 9/23 100LL SELF-SERVE PRICES HEG Herlong Aviation CRG Sky Harbor CRG Craig Air Center SGJ City of St. Augustine 28J City of Palatka 42J Keystone Airpark FIN Flagler County Sun‐'n‐Fun Sale Back‐to‐School Sale TPC week + change from Galaxy to Atlantic $4.00 $5.00 $6.00 $7.00 $8.00 $9.00 JET-A PRICES
- 2. Based v. Transient Fuel Sales Fuel Cost Tracking $3.00 $4.00 2/26 3/5 3/12 3/19 3/26 4/2 4/9 4/16 4/23 4/30 5/7 5/14 5/21 5/28 6/4 6/11 6/18 6/25 7/2 7/9 7/16 7/23 7/30 8/6 8/13 8/20 8/27 9/3 9/10 9/17 9/24 10/1 10/8 10/15 10/22 10/29 11/5 11/12 11/19 11/26 12/3 12/10 12/17 12/24 12/31 1/7 1/14 1/21 1/28 2/4 2/11 2/18 2/25 3/4 3/11 3/18 3/25 4/1 4/8 4/15 4/22 4/29 5/6 5/13 5/20 5/27 6/3 6/10 6/17 6/24 7/1 7/8 7/15 7/22 7/29 8/5 8/12 8/19 8/26 9/2 9/9 9/16 9/23 HEG Herlong Aviation JAX Signature JAX Sheltair CRG Sky Harbor CRG Craig Air Center VQQ Jacksonville Jet Port SGJ Atlantic Aviation 28J City of Palatka 5,747 5,610 5,179 5,022 4,333 ‐ 1,607 1,981 2,703 2,273 2,413 9,006 $‐ $1.00 $2.00 $3.00 $4.00 $5.00 $6.00 ‐ 1,000 2,000 3,000 4,000 5,000 6,000 7,000 8,000 9,000 10,000 October November December January February March Gallons 100LLSales,Basedv. Transient Tenant Gal. Sold Trans. Gal. Sold Avg. Sale Price ‐ 190 500 91 516 376 2,667 1,032 1,189 1,114 2,413 1,933 $‐ $1.00 $2.00 $3.00 $4.00 $5.00 $6.00 ‐ 500 1,000 1,500 2,000 2,500 3,000 3,500 October November December January February March Gallons Jet-ASales,Basedv. Transient Tenant Gal. Sold Trans. Gal. Sold Avg. Sale Price $1.50 $2.00 $2.50 $3.00 $3.50 $4.00 $4.50 $5.00 $5.50 1/4/14 1/18/14 2/1/14 2/15/14 3/1/14 3/15/14 3/29/14 4/12/14 4/26/14 5/10/14 5/24/14 6/7/14 6/21/14 7/5/14 7/19/14 8/2/14 8/16/14 8/30/14 9/13/14 9/27/14 10/11/14 10/25/14 11/8/14 11/22/14 12/6/14 12/20/14 1/3/15 1/17/15 1/31/15 2/14/15 2/28/15 3/14/15 FUEL COST 100LL Jet‐A
- 3. FY Jet‐A Total Total FY TOTAL Truck SS Truck SS Truck SS Truck SS Truck 41,870 SS 49,832 Truck 30,499 SS 53,176 Truck 24,270 SS 50,598 Truck 28,139 SS 42,121 Truck 32,141 SS 39,838 Truck 54,976 SS 44,833 2013 33,584 121,853 2015 99,809 23,737 123,546 70,260 26,285 96,545 2014 71,979 12,292 84,271 2011 83,675 28,894 2007 106,915 60,580 167,495 2008 93,197 47,718 TOTAL FUEL SALES (GALLONS), FY06-15 140,915 106,536 2009 100LL 59,956 190,077130,1212006 74,868 31,668 35,692 127,394 112,569 Total Fuel Sales 2012 88,269 2010 91,702 0 2,000 4,000 6,000 8,000 10,000 12,000 October November December January February March April May June July August September 100LLSalesby Month(Gallons) 2011 2012 2013 2014 2015 0 1,000 2,000 3,000 4,000 5,000 6,000 October November December January February March April May June July August September Jet-ASalesby Month(Gallons) 2011 2012 2013 2014 2015