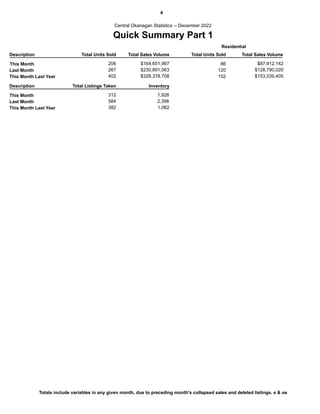
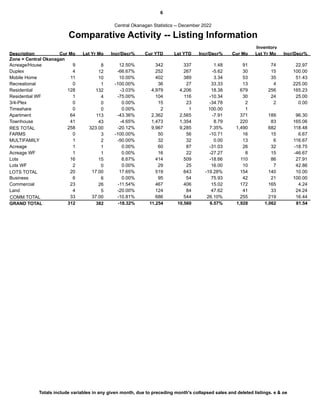
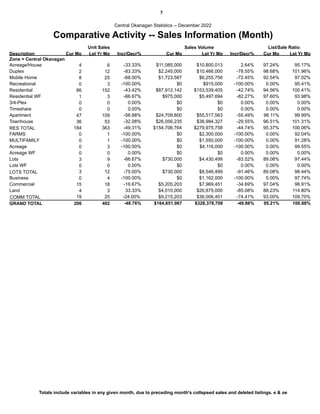
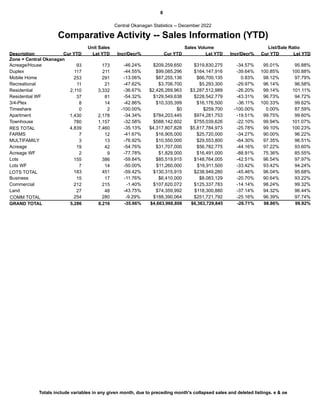
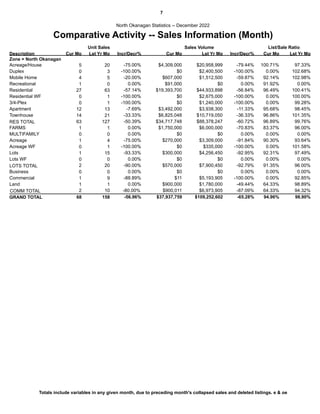
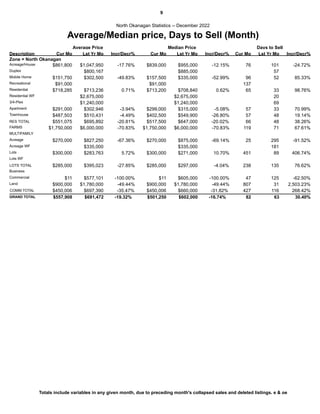
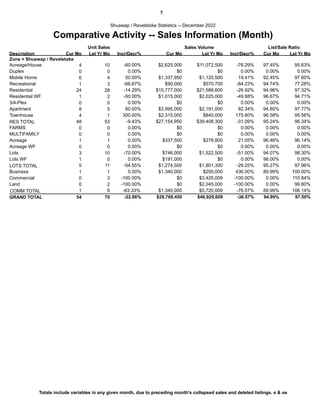
Central Okanagan Monthly Statistics
December 2022
2
Table of Contents
Table of Contents 2
Zone Totals 3
Quick Summary Part 1 4
Quick Summary Part 2 5
Listing Information 6
Sales Information (Month) 7
Sales Information (YTD) 8
Average/Median Price, Days to Sell (Month) 9
Average/Median Price, Days to Sell (YTD) 10
Totals include variables in any given month, due to preceding month's collapsed sales and deleted listings. e & oe
3
Zone Totals
Central Okanagan Statistics -- December 2022
Description CM This Year CM Last Year Increase Increase
This YTD Last YTD
Area = Central Okanaga
1 Units Listed 312 382 -18.32% 10,560
11,254 6.57%
2 Units Sold
3 Sales Volume
4 List/Sell Ratio
5 Days to Sell
6 Active Listings
206 402 8,216
5,286
-48.76% -35.66%
$164,651,967 $328,378,708 $6,363,729,845
$4,663,968,808
-49.86% -26.71%
100.88%
95.21% 99.92%
98.86%
52
67 47
41
28.88% -11.56%
1,928 1,062 81.54%
Area = North Okanagan
1 Units Listed 101 119 -15.13% 3,697
3,713 0.43%
2 Units Sold
3 Sales Volume
4 List/Sell Ratio
5 Days to Sell
6 Active Listings
68 158 3,006
2,075
-56.96% -30.97%
$37,937,759 $109,252,602 $1,864,408,587
$1,443,768,290
-65.28% -22.56%
98.90%
94.96% 99.36%
98.69%
63
82 64
49
30.40% -23.09%
815 532 53.20%
Area = Shuswap / Revel
1 Units Listed 59 74 -20.27% 2,102
2,263 7.66%
2 Units Sold
3 Sales Volume
4 List/Sell Ratio
5 Days to Sell
6 Active Listings
54 70 1,704
1,196
-22.86% -29.81%
$29,769,450 $46,929,609 $900,767,462
$726,627,522
-36.57% -19.33%
97.50%
94.99% 97.82%
97.36%
70
79 80
63
12.81% -21.11%
510 332 53.61%
Area = South Okanagan
1 Units Listed 81 66 22.73% 3,990
2,708 -32.13%
2 Units Sold
3 Sales Volume
4 List/Sell Ratio
5 Days to Sell
6 Active Listings
91 98 3,270
2,026
-7.14% -38.04%
$56,937,765 $63,773,128 $1,998,599,076
$1,372,142,332
-10.72% -31.34%
97.17%
89.17% 98.44%
97.47%
74
89 78
59
19.91% -23.95%
1,096 671 63.34%
Area = South Peace Riv
1 Units Listed 10 12 -16.67% 945
212 -77.57%
2 Units Sold
3 Sales Volume
4 List/Sell Ratio
5 Days to Sell
6 Active Listings
29 28 619
603
3.57% -2.58%
$7,345,650 $8,573,597 $171,116,685
$176,412,217
-14.32% 3.09%
96.14%
96.91% 95.94%
94.92%
113
69 123
105
-38.66% -15.00%
389 429 -9.32%
563 653 -13.78%
Area = Grand Total
1 Units Listed 21,294
20,150 -5.37%
2 Units Sold
3 Sales Volume
4 List/Sell Ratio
5 Days to Sell
6 Active Listings
16,815
11,186
756
448 -40.74% -33.48%
$296,642,591 $556,907,644 $11,298,621,655
$8,382,919,169
-46.73% -25.81%
99.69%
93.97% 99.33%
98.38%
61 62
75 52
23.34% -16.56%
4,738 3,026 56.58%
Totals include variables in any given month, due to preceding month's collapsed sales and deleted listings. e & oe
4
Quick Summary Part 1
Central Okanagan Statistics -- December 2022
This Month
Last Month
This Month Last Year
206 $164,651,967
267 $230,891,063
402 $328,378,708
86
120
152
$87,912,142
$128,790,020
$153,539,405
Description Total Units Sold Total Sales Volume Total Units Sold Total Sales Volume
Description Inventory
Total Listings Taken
This Month Last Year
Last Month
This Month
382
584
312 1,928
2,396
1,062
Residential
Totals include variables in any given month, due to preceding month's collapsed sales and deleted listings. e & oe
5
Quick Summary Part 2
Central Okanagan Statistics -- December 2022
Condo/Apt
47
Sales
New Listings 64
Current Inventory
Sell/Inv. Ratio
Days to Sell 57
12.67%
Average Price
Median Price
$525,740
$471,675
371
Condo/Townhouse
36
Sales
New Listings 41
Current Inventory
Sell/Inv. Ratio
Days to Sell 62
16.36%
Average Price
Median Price
$723,784
$637,500
220
Lots
3
Sales
New Listings 20
Current Inventory
Sell/Inv. Ratio
Days to Sell 105
1.95%
Average Price
Median Price
$243,333
$125,000
154
Residential
86
Sales
New Listings 128
Current Inventory
Sell/Inv. Ratio
Days to Sell 64
12.67%
Average Price
Median Price
$1,022,234
$887,000
679
Ratio of Sales vs Inventory 12.46%
Totals include variables in any given month, due to preceding month's collapsed sales and deleted listings. e & oe
6
Comparative Activity -- Listing Information
Central Okanagan Statistics -- December 2022
Description Cur Mo Lst Yr Mo Incr/Decr% Cur YTD Lst YTD Incr/Decr% Cur Mo Lst Yr Mo Incr/Decr%
Inventory
Zone = Central Okanagan
Acreage/House 9 8 12.50% 342 337 1.48 91 74 22.97
Duplex 4 12 -66.67% 252 267 -5.62 30 15 100.00
Mobile Home 11 10 10.00% 402 389 3.34 53 35 51.43
Recreational 0 1 -100.00% 36 27 33.33 13 4 225.00
Residential 128 132 -3.03% 4,979 4,206 18.38 679 256 165.23
Residential WF 1 4 -75.00% 104 116 -10.34 30 24 25.00
3/4-Plex 0 0 0.00% 15 23 -34.78 2 2 0.00
Timeshare 0 0 0.00% 2 1 100.00 1
Apartment 64 113 -43.36% 2,362 2,565 -7.91 371 189 96.30
Townhouse 41 43 -4.65% 1,473 1,354 8.79 220 83 165.06
RES TOTAL 258 323.00 -20.12% 9,967 9,285 7.35% 1,490 682 118.48
FARMS 0 3 -100.00% 50 56 -10.71 16 15 6.67
MULTIFAMILY 1 2 -50.00% 32 32 0.00 13 6 116.67
Acreage 1 1 0.00% 60 87 -31.03 26 32 -18.75
Acreage WF 1 1 0.00% 16 22 -27.27 8 15 -46.67
Lots 16 15 6.67% 414 509 -18.66 110 86 27.91
Lots WF 2 0 0.00% 29 25 16.00 10 7 42.86
LOTS TOTAL 154
20 17.00 17.65% 519 643 -19.28% 140 10.00
Business 6 6 0.00% 95 54 75.93 42 21 100.00
Commercial 23 26 -11.54% 467 406 15.02 172 165 4.24
Land 4 5 -20.00% 124 84 47.62 41 33 24.24
COMM TOTAL 255
33 37.00 -10.81% 686 544 26.10% 219 16.44
312
GRAND TOTAL 382 11,254 10,560
-18.32% 6.57% 1,928 1,062 81.54
Totals include variables in any given month, due to preceding month's collapsed sales and deleted listings. e & oe
7
Comparative Activity -- Sales Information (Month)
Central Okanagan Statistics -- December 2022
Description Cur Mo Lst Yr Mo Incr/Decr% Cur Mo Lst Yr Mo Incr/Decr% Cur Mo Lst Yr Mo
Zone = Central Okanagan
Unit Sales Sales Volume List/Sale Ratio
Acreage/House 4 6 -33.33% $10,800,013
$11,085,000 2.64% 97.24% 95.17%
Duplex 2 12 -83.33% $10,466,000
$2,245,000 -78.55% 98.68% 101.96%
Mobile Home 8 25 -68.00% $6,255,756
$1,723,587 -72.45% 92.54% 97.02%
Recreational 0 3 -100.00% $915,000
$0 -100.00% 0.00% 95.41%
Residential 86 152 -43.42% $153,539,405
$87,912,142 -42.74% 94.56% 100.41%
Residential WF 1 3 -66.67% $5,497,694
$975,000 -82.27% 97.60% 93.98%
3/4-Plex 0 0 0.00% $0
$0 0.00% 0.00% 0.00%
Timeshare 0 0 0.00% $0
$0 0.00% 0.00% 0.00%
Apartment 47 109 -56.88% $55,517,563
$24,709,800 -55.49% 96.11% 99.99%
Townhouse 36 53 -32.08% $36,984,327
$26,056,235 -29.55% 96.51% 101.31%
RES TOTAL 184 363 -49.31% -44.74%
$154,706,764 $279,975,758 95.37% 100.06%
FARMS 0 1 -100.00% $2,300,000
$0 -100.00% 0.00% 92.04%
MULTIFAMILY 0 1 -100.00% $1,550,000
$0 -100.00% 0.00% 91.28%
Acreage 0 3 -100.00% $4,116,000
$0 -100.00% 0.00% 99.55%
Acreage WF 0 0 0.00% $0
$0 0.00% 0.00% 0.00%
Lots 3 9 -66.67% $4,430,499
$730,000 -83.52% 89.08% 97.44%
Lots WF 0 0 0.00% $0
$0 0.00% 0.00% 0.00%
LOTS TOTAL 3 12 -75.00% -91.46%
$730,000 $8,546,499 89.08% 98.44%
Business 0 4 -100.00% $1,162,000
$0 -100.00% 0.00% 97.74%
Commercial 15 18 -16.67% $7,969,451
$5,205,203 -34.69% 97.04% 96.91%
Land 4 3 33.33% $26,875,000
$4,010,000 -85.08% 88.23% 114.80%
COMM TOTAL 19 25 -24.00% -74.41%
$9,215,203 $36,006,451 93.00% 109.70%
206
GRAND TOTAL 402 -48.76% $164,651,967 $328,378,708 -49.86% 95.21% 100.88%
Totals include variables in any given month, due to preceding month's collapsed sales and deleted listings. e & oe
8
Comparative Activity -- Sales Information (YTD)
Central Okanagan Statistics -- December 2022
Description Cur YTD Lst YTD Incr/Decr% Cur YTD Lst YTD Incr/Decr% Cur YTD Lst YTD
Zone = Central Okanagan
Unit Sales Sales Volume List/Sale Ratio
Acreage/House 93 173 -46.24% $319,830,275
$209,259,650 -34.57% 95.01% 95.88%
Duplex 117 211 -44.55% $164,147,916
$99,085,296 -39.64% 100.85% 100.88%
Mobile Home 253 291 -13.06% $66,700,135
$67,255,136 0.83% 98.12% 97.79%
Recreational 11 21 -47.62% $5,293,300
$3,706,700 -29.97% 96.14% 96.58%
Residential 2,110 3,332 -36.67% $3,287,512,989
$2,426,269,963 -26.20% 99.14% 101.11%
Residential WF 37 81 -54.32% $228,542,779
$129,549,638 -43.31% 96.73% 94.72%
3/4-Plex 8 14 -42.86% $16,176,500
$10,335,399 -36.11% 100.33% 99.62%
Timeshare 0 2 -100.00% $259,700
$0 -100.00% 0.00% 87.59%
Apartment 1,430 2,178 -34.34% $974,281,753
$784,203,445 -19.51% 99.75% 99.60%
Townhouse 780 1,157 -32.58% $755,039,626
$588,142,602 -22.10% 99.94% 101.07%
RES TOTAL 4,839 7,460 -35.13% -25.78%
$4,317,807,828 $5,817,784,973 99.10% 100.23%
FARMS 7 12 -41.67% $25,720,000
$16,905,000 -34.27% 90.00% 96.22%
MULTIFAMILY 3 13 -76.92% $29,553,800
$10,550,000 -64.30% 97.35% 96.51%
Acreage 19 42 -54.76% $56,782,775
$31,707,000 -44.16% 97.22% 93.60%
Acreage WF 2 9 -77.78% $16,491,000
$1,829,000 -88.91% 75.36% 85.55%
Lots 155 386 -59.84% $148,764,005
$85,519,915 -42.51% 96.54% 97.97%
Lots WF 7 14 -50.00% $16,911,500
$11,260,000 -33.42% 93.42% 94.24%
LOTS TOTAL 183 451 -59.42% -45.46%
$130,315,915 $238,949,280 96.04% 95.68%
Business 15 17 -11.76% $8,083,129
$6,410,000 -20.70% 90.64% 93.22%
Commercial 212 215 -1.40% $125,337,783
$107,620,072 -14.14% 98.24% 99.32%
Land 27 48 -43.75% $118,300,880
$74,359,992 -37.14% 94.32% 96.44%
COMM TOTAL 254 280 -9.29% -25.16%
$188,390,064 $251,721,792 96.39% 97.74%
5,286
GRAND TOTAL 8,216 -35.66% $4,663,968,808 $6,363,729,845 -26.71% 98.86% 99.92%
Totals include variables in any given month, due to preceding month's collapsed sales and deleted listings. e & oe
9
Average/Median price, Days to Sell (Month)
Central Okanagan Statistics -- December 2022
Description Cur Mo Lst Yr Mo Incr/Decr% Cur Mo Lst Yr Mo Incr/Decr% Cur Mo Lst Yr Mo
Zone = Central Okanagan
Average Price Median Price Days to Sell
Incr/Decr%
Acreage/House $2,771,250 $1,800,002 $2,477,500 $1,887,500 38 71
53.96% 31.26% -46.13%
Duplex $1,122,500 $872,167 $1,122,500 $747,000 30 37
28.70% 50.27% -20.81%
Mobile Home $215,448 $250,230 $212,500 $248,000 56 59
-13.90% -14.31% -5.40%
Recreational $305,000 $290,000 97
Residential $1,022,234 $1,010,128 $887,000 $919,500 64 38
1.20% -3.53% 65.81%
Residential WF $975,000 $1,832,565 $975,000 $2,060,194 62 83
-46.80% -52.67% -25.00%
3/4-Plex
Timeshare
Apartment $525,740 $509,335 $471,675 $444,900 57 31
3.22% 6.02% 85.42%
Townhouse $723,784 $697,817 $637,500 $662,025 62 40
3.72% -3.70% 54.92%
RES TOTAL $840,798 $771,283 $735,613 $700,000 60 39
9.01% 5.09% 54.40%
FARMS $2,300,000 $2,300,000 92
MULTIFAMILY $1,550,000 $1,550,000 138
Acreage $1,372,000 $395,000 221
Acreage WF
Lots $243,333 $492,278 $125,000 $482,500 105 72
-50.57% -74.09% 47.20%
Lots WF
LOTS TOTAL $243,333 $712,208 $125,000 $438,750 105 109
-65.83% -71.51% -3.36%
Business $290,500 $205,000 119
Commercial $347,014 $442,747 $22 $28 126 223
-21.62% -21.43% -43.33%
Land $1,002,500 $8,958,333 $1,012,500 $2,400,000 94 174
-88.81% -57.81% -45.94%
COMM TOTAL $485,011 $1,440,258 $22 $110,000 119 200
-66.32% -99.98% -40.36%
GRAND TOTAL $799,281 $715,000
$816,862 $693,000 67 52
-2.15% 3.17% 28.88%
Totals include variables in any given month, due to preceding month's collapsed sales and deleted listings. e & oe
10
Average/Median price, Days to Sell (YTD)
Central Okanagan Statistics -- December 2022
Description Cur YTD Lst YTD Incr/Decr% Cur YTD Lst YTD Incr/Decr% Cur YTD Lst YTD
Zone = Central Okanagan
Average Price Median Price Days to Sell
Incr/Decr%
Acreage/House $2,250,104 $1,848,730 $1,680,000 $1,540,000 87 81
21.71% 9.09% 7.93%
Duplex $846,883 $777,952 $750,000 $689,900 25 38
8.86% 8.71% -34.12%
Mobile Home $265,831 $229,210 $261,900 $217,500 40 51
15.98% 20.41% -21.80%
Recreational $336,973 $252,062 $239,500 $266,000 41 60
33.69% -9.96% -31.36%
Residential $1,149,891 $986,649 $1,030,000 $886,000 34 32
16.55% 16.25% 6.24%
Residential WF $3,501,342 $2,821,516 $3,600,000 $2,350,000 88 92
24.09% 53.19% -3.98%
3/4-Plex $1,291,925 $1,155,464 $1,264,500 $740,000 64 49
11.81% 70.88% 30.74%
Timeshare $129,850 $129,850 145
Apartment $548,394 $447,329 $482,250 $415,000 36 40
22.59% 16.20% -9.34%
Townhouse $754,029 $652,584 $715,000 $619,900 34 39
15.55% 15.34% -11.59%
RES TOTAL $892,293 $779,864 $780,000 $690,000 36 38
14.42% 13.04% -4.99%
FARMS $2,415,000 $2,143,333 $2,175,000 $2,045,000 117 101
12.67% 6.36% 16.46%
MULTIFAMILY $3,516,667 $2,273,369 $3,250,000 $1,575,000 102 96
54.69% 106.35% 6.76%
Acreage $1,668,789 $1,351,971 $970,000 $750,000 120 132
23.43% 29.33% -8.71%
Acreage WF $914,500 $1,832,333 $914,500 $1,565,000 206 209
-50.09% -41.57% -1.57%
Lots $551,741 $385,399 $440,000 $324,950 71 102
43.16% 35.41% -30.63%
Lots WF $1,608,571 $1,207,964 $1,300,000 $959,500 70 120
33.16% 35.49% -41.82%
LOTS TOTAL $712,109 $529,821 $457,000 $356,000 77 108
34.41% 28.37% -28.04%
Business $427,333 $475,478 $135,000 $185,000 92 141
-10.13% -27.03% -34.52%
Commercial $507,642 $582,966 $20 $24 105 153
-12.92% -14.89% -31.28%
Land $2,754,074 $2,464,602 $1,750,000 $1,194,106 131 251
11.75% 46.55% -47.77%
COMM TOTAL $741,693 $899,006 $23 $65,000 107 169
-17.50% -99.97% -36.64%
GRAND TOTAL $882,325 $755,000
$774,553 $665,000 41 47
13.91% 13.53% -11.56%
Totals include variables in any given month, due to preceding month's collapsed sales and deleted listings. e & oe
North Okanagan Monthly Statistics
December 2022
2
Table of Contents
Table of Contents 2
Zone Totals 3
Quick Summary Part 1 4
Quick Summary Part 2 5
Listing Information 6
Sales Information (Month) 7
Sales Information (YTD) 8
Average/Median Price, Days to Sell (Month) 9
Average/Median Price, Days to Sell (YTD) 10
Totals include variables in any given month, due to preceding month's collapsed sales and deleted listings. e & oe
3
Zone Totals
Central Okanagan Statistics -- December 2022
Description CM This Year CM Last Year Increase Increase
This YTD Last YTD
Area = Central Okanaga
1 Units Listed 312 382 -18.32% 10,560
11,254 6.57%
2 Units Sold
3 Sales Volume
4 List/Sell Ratio
5 Days to Sell
6 Active Listings
206 402 8,216
5,286
-48.76% -35.66%
$164,651,967 $328,378,708 $6,363,729,845
$4,663,968,808
-49.86% -26.71%
100.88%
95.21% 99.92%
98.86%
52
67 47
41
28.88% -11.56%
1,928 1,062 81.54%
Area = North Okanagan
1 Units Listed 101 119 -15.13% 3,697
3,713 0.43%
2 Units Sold
3 Sales Volume
4 List/Sell Ratio
5 Days to Sell
6 Active Listings
68 158 3,006
2,075
-56.96% -30.97%
$37,937,759 $109,252,602 $1,864,408,587
$1,443,768,290
-65.28% -22.56%
98.90%
94.96% 99.36%
98.69%
63
82 64
49
30.40% -23.09%
815 532 53.20%
Area = Shuswap / Revel
1 Units Listed 59 74 -20.27% 2,102
2,263 7.66%
2 Units Sold
3 Sales Volume
4 List/Sell Ratio
5 Days to Sell
6 Active Listings
54 70 1,704
1,196
-22.86% -29.81%
$29,769,450 $46,929,609 $900,767,462
$726,627,522
-36.57% -19.33%
97.50%
94.99% 97.82%
97.36%
70
79 80
63
12.81% -21.11%
510 332 53.61%
Area = South Okanagan
1 Units Listed 81 66 22.73% 3,990
2,708 -32.13%
2 Units Sold
3 Sales Volume
4 List/Sell Ratio
5 Days to Sell
6 Active Listings
91 98 3,270
2,026
-7.14% -38.04%
$56,937,765 $63,773,128 $1,998,599,076
$1,372,142,332
-10.72% -31.34%
97.17%
89.17% 98.44%
97.47%
74
89 78
59
19.91% -23.95%
1,096 671 63.34%
Area = South Peace Riv
1 Units Listed 10 12 -16.67% 945
212 -77.57%
2 Units Sold
3 Sales Volume
4 List/Sell Ratio
5 Days to Sell
6 Active Listings
29 28 619
603
3.57% -2.58%
$7,345,650 $8,573,597 $171,116,685
$176,412,217
-14.32% 3.09%
96.14%
96.91% 95.94%
94.92%
113
69 123
105
-38.66% -15.00%
389 429 -9.32%
563 653 -13.78%
Area = Grand Total
1 Units Listed 21,294
20,150 -5.37%
2 Units Sold
3 Sales Volume
4 List/Sell Ratio
5 Days to Sell
6 Active Listings
16,815
11,186
756
448 -40.74% -33.48%
$296,642,591 $556,907,644 $11,298,621,655
$8,382,919,169
-46.73% -25.81%
99.69%
93.97% 99.33%
98.38%
61 62
75 52
23.34% -16.56%
4,738 3,026 56.58%
Totals include variables in any given month, due to preceding month's collapsed sales and deleted listings. e & oe
4
Quick Summary Part 1
North Okanagan Statistics -- December 2022
This Month
Last Month
This Month Last Year
68 $37,937,759
107 $67,276,833
158 $109,252,602
27
53
63
$19,393,700
$36,713,346
$44,933,898
Description Total Units Sold Total Sales Volume Total Units Sold Total Sales Volume
Description Inventory
Total Listings Taken
This Month Last Year
Last Month
This Month
119
207
101 815
912
532
Residential
Totals include variables in any given month, due to preceding month's collapsed sales and deleted listings. e & oe
5
Quick Summary Part 2
North Okanagan Statistics -- December 2022
Condo/Apt
12
Sales
New Listings 8
Current Inventory
Sell/Inv. Ratio
Days to Sell 57
31.58%
Average Price
Median Price
$291,000
$299,000
38
Condo/Townhouse
14
Sales
New Listings 19
Current Inventory
Sell/Inv. Ratio
Days to Sell 57
22.22%
Average Price
Median Price
$487,503
$402,500
63
Lots
2
Sales
New Listings 14
Current Inventory
Sell/Inv. Ratio
Days to Sell 238
Average Price
Median Price
$285,000
$285,000
Residential
27
Sales
New Listings 29
Current Inventory
Sell/Inv. Ratio
Days to Sell 65
12.80%
Average Price
Median Price
$718,285
$713,200
211
Ratio of Sales vs Inventory 15.54%
Totals include variables in any given month, due to preceding month's collapsed sales and deleted listings. e & oe
6
Comparative Activity -- Listing Information
North Okanagan Statistics -- December 2022
Description Cur Mo Lst Yr Mo Incr/Decr% Cur YTD Lst YTD Incr/Decr% Cur Mo Lst Yr Mo Incr/Decr%
Inventory
Zone = North Okanagan
Acreage/House 7 14 -50.00% 387 375 3.20 81 70 15.71
Duplex 3 2 50.00% 120 103 16.50 27 14 92.86
Mobile Home 3 6 -50.00% 140 141 -0.71 27 15 80.00
Recreational 1 0 0.00% 29 21 38.10 10 6 66.67
Residential 29 44 -34.09% 1,546 1,471 5.10 211 92 129.35
Residential WF 2 1 100.00% 52 47 10.64 14 8 75.00
3/4-Plex 0 0 0.00% 14 16 -12.50 5 3 66.67
Apartment 8 18 -55.56% 291 322 -9.63 38 40 -5.00
Townhouse 19 13 46.15% 430 473 -9.09 63 30 110.00
RES TOTAL 72 98.00 -26.53% 3,009 2,969 1.35% 476 278 71.22
FARMS 0 4 -100.00% 62 65 -4.62 27 26 3.85
MULTIFAMILY 0 0 0.00% 29 14 107.14 19 3 533.33
Acreage 3 1 200.00% 94 96 -2.08 42 33 27.27
Acreage WF 0 0 0.00% 4 13 -69.23 3
Lots 11 7 57.14% 252 229 10.04 104 61 70.49
Lots WF 0 0 0.00% 7 19 -63.16 2 1 100.00
LOTS TOTAL 148
14 8.00 75.00% 357 357 0.00% 98 51.02
Business 0 1 -100.00% 37 37 0.00 18 16 12.50
Commercial 13 2 550.00% 161 183 -12.02 74 72 2.78
Land 2 6 -66.67% 58 72 -19.44 53 39 35.90
COMM TOTAL 145
15 9.00 66.67% 256 292 -12.33% 127 14.17
101
GRAND TOTAL 119 3,713 3,697
-15.13% 0.43% 815 532 53.20
Totals include variables in any given month, due to preceding month's collapsed sales and deleted listings. e & oe
7
Comparative Activity -- Sales Information (Month)
North Okanagan Statistics -- December 2022
Description Cur Mo Lst Yr Mo Incr/Decr% Cur Mo Lst Yr Mo Incr/Decr% Cur Mo Lst Yr Mo
Zone = North Okanagan
Unit Sales Sales Volume List/Sale Ratio
Acreage/House 5 20 -75.00% $20,958,999
$4,309,000 -79.44% 100.71% 97.33%
Duplex 0 3 -100.00% $2,400,500
$0 -100.00% 0.00% 102.68%
Mobile Home 4 5 -20.00% $1,512,500
$607,000 -59.87% 92.14% 102.98%
Recreational 1 0 0.00% $0
$91,000 0.00% 91.92% 0.00%
Residential 27 63 -57.14% $44,933,898
$19,393,700 -56.84% 96.49% 100.41%
Residential WF 0 1 -100.00% $2,675,000
$0 -100.00% 0.00% 100.00%
3/4-Plex 0 1 -100.00% $1,240,000
$0 -100.00% 0.00% 99.28%
Apartment 12 13 -7.69% $3,938,300
$3,492,000 -11.33% 95.68% 98.45%
Townhouse 14 21 -33.33% $10,719,050
$6,825,048 -36.33% 96.86% 101.35%
RES TOTAL 63 127 -50.39% -60.72%
$34,717,748 $88,378,247 96.89% 99.76%
FARMS 1 1 0.00% $6,000,000
$1,750,000 -70.83% 83.37% 96.00%
MULTIFAMILY 0 0 0.00% $0
$0 0.00% 0.00% 0.00%
Acreage 1 4 -75.00% $3,309,000
$270,000 -91.84% 90.30% 93.64%
Acreage WF 0 1 -100.00% $335,000
$0 -100.00% 0.00% 101.58%
Lots 1 15 -93.33% $4,256,450
$300,000 -92.95% 92.31% 97.49%
Lots WF 0 0 0.00% $0
$0 0.00% 0.00% 0.00%
LOTS TOTAL 2 20 -90.00% -92.79%
$570,000 $7,900,450 91.35% 96.00%
Business 0 0 0.00% $0
$0 0.00% 0.00% 0.00%
Commercial 1 9 -88.89% $5,193,905
$11 -100.00% 0.00% 92.85%
Land 1 1 0.00% $1,780,000
$900,000 -49.44% 64.33% 98.89%
COMM TOTAL 2 10 -80.00% -87.09%
$900,011 $6,973,905 64.33% 94.32%
68
GRAND TOTAL 158 -56.96% $37,937,759 $109,252,602 -65.28% 94.96% 98.90%
Totals include variables in any given month, due to preceding month's collapsed sales and deleted listings. e & oe
8
Comparative Activity -- Sales Information (YTD)
North Okanagan Statistics -- December 2022
Description Cur YTD Lst YTD Incr/Decr% Cur YTD Lst YTD Incr/Decr% Cur YTD Lst YTD
Zone = North Okanagan
Unit Sales Sales Volume List/Sale Ratio
Acreage/House 171 252 -32.14% $269,532,451
$211,467,533 -21.54% 95.73% 98.49%
Duplex 60 83 -27.71% $55,923,925
$48,602,600 -13.09% 99.90% 100.37%
Mobile Home 101 132 -23.48% $31,485,244
$26,984,073 -14.30% 98.43% 98.67%
Recreational 14 15 -6.67% $2,914,400
$2,245,100 -22.97% 93.85% 96.41%
Residential 923 1,289 -28.39% $884,867,904
$740,443,611 -16.32% 99.80% 100.91%
Residential WF 17 44 -61.36% $70,817,615
$27,108,150 -61.72% 94.06% 96.85%
3/4-Plex 4 14 -71.43% $10,299,090
$4,403,200 -57.25% 98.20% 98.44%
Apartment 226 299 -24.41% $85,881,415
$75,363,656 -12.25% 99.40% 98.01%
Townhouse 310 436 -28.90% $192,738,997
$157,941,530 -18.05% 100.76% 100.43%
RES TOTAL 1,826 2,564 -28.78% -19.31%
$1,294,559,453 $1,604,461,041 99.04% 100.01%
FARMS 10 7 42.86% $14,378,000
$22,462,000 56.22% 97.49% 94.79%
MULTIFAMILY 4 8 -50.00% $7,798,000
$6,578,000 -15.65% 97.34% 95.07%
Acreage 38 77 -50.65% $50,553,300
$23,045,700 -54.41% 97.01% 94.23%
Acreage WF 3 15 -80.00% $10,074,100
$3,010,000 -70.12% 92.08% 96.21%
Lots 114 186 -38.71% $54,943,125
$44,129,151 -19.68% 96.15% 98.19%
Lots WF 3 13 -76.92% $10,517,500
$3,229,999 -69.29% 98.09% 95.82%
LOTS TOTAL 158 291 -45.70% -41.77%
$73,414,850 $126,088,025 96.32% 96.21%
Business 10 8 25.00% $16,643,000
$6,312,000 -62.07% 89.12% 92.14%
Commercial 61 103 -40.78% $59,291,218
$34,274,487 -42.19% 96.60% 96.26%
Land 6 25 -76.00% $35,749,304
$6,167,500 -82.75% 84.89% 94.09%
COMM TOTAL 77 136 -43.38% -58.14%
$46,753,987 $111,683,521 93.83% 94.93%
2,075
GRAND TOTAL 3,006 -30.97% $1,443,768,290 $1,864,408,587 -22.56% 98.69% 99.36%
Totals include variables in any given month, due to preceding month's collapsed sales and deleted listings. e & oe
9
Average/Median price, Days to Sell (Month)
North Okanagan Statistics -- December 2022
Description Cur Mo Lst Yr Mo Incr/Decr% Cur Mo Lst Yr Mo Incr/Decr% Cur Mo Lst Yr Mo
Zone = North Okanagan
Average Price Median Price Days to Sell
Incr/Decr%
Acreage/House $861,800 $1,047,950 $839,000 $955,000 76 101
-17.76% -12.15% -24.72%
Duplex $800,167 $885,000 57
Mobile Home $151,750 $302,500 $157,500 $335,000 96 52
-49.83% -52.99% 85.33%
Recreational $91,000 $91,000 137
Residential $718,285 $713,236 $713,200 $708,840 65 33
0.71% 0.62% 98.76%
Residential WF $2,675,000 $2,675,000 20
3/4-Plex $1,240,000 $1,240,000 69
Apartment $291,000 $302,946 $299,000 $315,000 57 33
-3.94% -5.08% 70.99%
Townhouse $487,503 $510,431 $402,500 $549,900 57 48
-4.49% -26.80% 19.14%
RES TOTAL $551,075 $695,892 $517,500 $647,000 66 48
-20.81% -20.02% 38.26%
FARMS $1,750,000 $6,000,000 $1,750,000 $6,000,000 119 71
-70.83% -70.83% 67.61%
MULTIFAMILY
Acreage $270,000 $827,250 $270,000 $875,000 25 295
-67.36% -69.14% -91.52%
Acreage WF $335,000 $335,000 181
Lots $300,000 $283,763 $300,000 $271,000 451 89
5.72% 10.70% 406.74%
Lots WF
LOTS TOTAL $285,000 $395,023 $285,000 $297,000 238 135
-27.85% -4.04% 76.62%
Business
Commercial $11 $577,101 $11 $605,000 47 125
-100.00% -100.00% -62.50%
Land $900,000 $1,780,000 $900,000 $1,780,000 807 31
-49.44% -49.44% 2,503.23%
COMM TOTAL $450,006 $697,390 $450,006 $660,000 427 116
-35.47% -31.82% 268.42%
GRAND TOTAL $557,908 $501,250
$691,472 $602,000 82 63
-19.32% -16.74% 30.40%
Totals include variables in any given month, due to preceding month's collapsed sales and deleted listings. e & oe
10
Average/Median price, Days to Sell (YTD)
North Okanagan Statistics -- December 2022
Description Cur YTD Lst YTD Incr/Decr% Cur YTD Lst YTD Incr/Decr% Cur YTD Lst YTD
Zone = North Okanagan
Average Price Median Price Days to Sell
Incr/Decr%
Acreage/House $1,236,652 $1,069,573 $1,100,000 $934,000 68 69
15.62% 17.77% -1.19%
Duplex $810,043 $673,782 $747,500 $650,000 45 43
20.22% 15.00% 4.25%
Mobile Home $267,169 $238,525 $250,000 $237,450 44 61
12.01% 5.29% -27.55%
Recreational $160,364 $194,293 $138,050 $150,000 48 120
-17.46% -7.97% -59.93%
Residential $802,214 $686,476 $725,000 $625,000 37 38
16.86% 16.00% -0.88%
Residential WF $1,594,597 $1,609,491 $1,285,000 $1,350,000 88 75
-0.93% -4.81% 18.08%
3/4-Plex $1,100,800 $735,649 $1,135,000 $749,950 57 83
49.64% 51.34% -31.27%
Apartment $333,468 $287,229 $310,000 $267,000 39 67
16.10% 16.10% -41.59%
Townhouse $509,489 $442,062 $496,300 $430,000 33 41
15.25% 15.42% -19.35%
RES TOTAL $708,959 $625,765 $625,000 $550,000 41 47
13.29% 13.64% -13.72%
FARMS $2,246,200 $2,054,000 $1,895,000 $1,500,000 128 130
9.36% 26.33% -1.29%
MULTIFAMILY $1,644,500 $974,750 $1,374,000 $747,000 235 89
68.71% 83.94% 164.70%
Acreage $606,466 $656,536 $449,950 $490,000 128 227
-7.63% -8.17% -43.78%
Acreage WF $1,003,333 $671,607 $875,000 $656,000 227 214
49.39% 33.38% 5.85%
Lots $387,098 $295,393 $325,000 $269,450 81 138
31.04% 20.62% -41.35%
Lots WF $1,076,666 $809,038 $1,230,000 $660,000 52 85
33.08% 86.36% -39.27%
LOTS TOTAL $464,651 $433,292 $352,975 $310,000 94 163
7.24% 13.86% -42.15%
Business $631,200 $2,080,375 $285,000 $752,500 243 148
-69.66% -62.13% 63.92%
Commercial $561,877 $575,643 $179,000 $325,000 114 137
-2.39% -44.92% -17.08%
Land $1,027,917 $1,429,972 $782,500 $980,000 250 300
-28.12% -20.15% -16.51%
COMM TOTAL $607,195 $821,202 $199,900 $430,250 141 168
-26.06% -53.54% -15.86%
GRAND TOTAL $695,792 $610,000
$620,229 $534,948 49 64
12.18% 14.03% -23.09%
Totals include variables in any given month, due to preceding month's collapsed sales and deleted listings. e & oe
Shuswap / Revelstoke Monthly Statistics
December 2022
2
Table of Contents
Table of Contents 2
Zone Totals 3
Quick Summary Part 1 4
Quick Summary Part 2 5
Listing Information 6
Sales Information (Month) 7
Sales Information (YTD) 8
Average/Median Price, Days to Sell (Month) 9
Average/Median Price, Days to Sell (YTD) 10
Totals include variables in any given month, due to preceding month's collapsed sales and deleted listings. e & oe
3
Zone Totals
Central Okanagan Statistics -- December 2022
Description CM This Year CM Last Year Increase Increase
This YTD Last YTD
Area = Central Okanaga
1 Units Listed 312 382 -18.32% 10,560
11,254 6.57%
2 Units Sold
3 Sales Volume
4 List/Sell Ratio
5 Days to Sell
6 Active Listings
206 402 8,216
5,286
-48.76% -35.66%
$164,651,967 $328,378,708 $6,363,729,845
$4,663,968,808
-49.86% -26.71%
100.88%
95.21% 99.92%
98.86%
52
67 47
41
28.88% -11.56%
1,928 1,062 81.54%
Area = North Okanagan
1 Units Listed 101 119 -15.13% 3,697
3,713 0.43%
2 Units Sold
3 Sales Volume
4 List/Sell Ratio
5 Days to Sell
6 Active Listings
68 158 3,006
2,075
-56.96% -30.97%
$37,937,759 $109,252,602 $1,864,408,587
$1,443,768,290
-65.28% -22.56%
98.90%
94.96% 99.36%
98.69%
63
82 64
49
30.40% -23.09%
815 532 53.20%
Area = Shuswap / Revel
1 Units Listed 59 74 -20.27% 2,102
2,263 7.66%
2 Units Sold
3 Sales Volume
4 List/Sell Ratio
5 Days to Sell
6 Active Listings
54 70 1,704
1,196
-22.86% -29.81%
$29,769,450 $46,929,609 $900,767,462
$726,627,522
-36.57% -19.33%
97.50%
94.99% 97.82%
97.36%
70
79 80
63
12.81% -21.11%
510 332 53.61%
Area = South Okanagan
1 Units Listed 81 66 22.73% 3,990
2,708 -32.13%
2 Units Sold
3 Sales Volume
4 List/Sell Ratio
5 Days to Sell
6 Active Listings
91 98 3,270
2,026
-7.14% -38.04%
$56,937,765 $63,773,128 $1,998,599,076
$1,372,142,332
-10.72% -31.34%
97.17%
89.17% 98.44%
97.47%
74
89 78
59
19.91% -23.95%
1,096 671 63.34%
Area = South Peace Riv
1 Units Listed 10 12 -16.67% 945
212 -77.57%
2 Units Sold
3 Sales Volume
4 List/Sell Ratio
5 Days to Sell
6 Active Listings
29 28 619
603
3.57% -2.58%
$7,345,650 $8,573,597 $171,116,685
$176,412,217
-14.32% 3.09%
96.14%
96.91% 95.94%
94.92%
113
69 123
105
-38.66% -15.00%
389 429 -9.32%
563 653 -13.78%
Area = Grand Total
1 Units Listed 21,294
20,150 -5.37%
2 Units Sold
3 Sales Volume
4 List/Sell Ratio
5 Days to Sell
6 Active Listings
16,815
11,186
756
448 -40.74% -33.48%
$296,642,591 $556,907,644 $11,298,621,655
$8,382,919,169
-46.73% -25.81%
99.69%
93.97% 99.33%
98.38%
61 62
75 52
23.34% -16.56%
4,738 3,026 56.58%
Totals include variables in any given month, due to preceding month's collapsed sales and deleted listings. e & oe
4
Quick Summary Part 1
Shuswap / Revelstoke Statistics -- December 2022
This Month
Last Month
This Month Last Year
54 $29,769,450
65 $38,324,399
70 $46,929,609
24
36
28
$15,777,000
$24,226,000
$21,588,600
Description Total Units Sold Total Sales Volume Total Units Sold Total Sales Volume
Description Inventory
Total Listings Taken
This Month Last Year
Last Month
This Month
74
109
59 510
629
332
Residential
Totals include variables in any given month, due to preceding month's collapsed sales and deleted listings. e & oe
5
Quick Summary Part 2
Shuswap / Revelstoke Statistics -- December 2022
Condo/Apt
8
Sales
New Listings 5
Current Inventory
Sell/Inv. Ratio
Days to Sell 65
25.00%
Average Price
Median Price
$499,375
$487,500
32
Condo/Townhouse
4
Sales
New Listings 5
Current Inventory
Sell/Inv. Ratio
Days to Sell 100
22.22%
Average Price
Median Price
$578,750
$523,000
18
Lots
5
Sales
New Listings 13
Current Inventory
Sell/Inv. Ratio
Days to Sell 90
3.68%
Average Price
Median Price
$254,900
$228,000
136
Residential
24
Sales
New Listings 18
Current Inventory
Sell/Inv. Ratio
Days to Sell 74
15.58%
Average Price
Median Price
$657,375
$625,000
154
Ratio of Sales vs Inventory 18.39%
Totals include variables in any given month, due to preceding month's collapsed sales and deleted listings. e & oe
6
Comparative Activity -- Listing Information
Shuswap / Revelstoke Statistics -- December 2022
Description Cur Mo Lst Yr Mo Incr/Decr% Cur YTD Lst YTD Incr/Decr% Cur Mo Lst Yr Mo Incr/Decr%
Inventory
Zone = Shuswap / Revelstoke
Acreage/House 3 4 -25.00% 197 193 2.07 52 31 67.74
Duplex 0 0 0.00% 20 11 81.82 5 1 400.00
Mobile Home 5 8 -37.50% 136 130 4.62 23 20 15.00
Recreational 1 2 -50.00% 80 78 2.56 10 17 -41.18
Residential 18 23 -21.74% 940 752 25.00 154 74 108.11
Residential WF 1 3 -66.67% 96 98 -2.04 12 14 -14.29
3/4-Plex 0 0 0.00% 0 2 -100.00
Apartment 5 13 -61.54% 123 134 -8.21 32 26 23.08
Townhouse 5 2 150.00% 119 121 -1.65 18 9 100.00
RES TOTAL 38 55.00 -30.91% 1,711 1,519 12.64% 306 192 59.38
FARMS 0 0 0.00% 14 15 -6.67 3 5 -40.00
MULTIFAMILY 0 0 0.00% 3 5 -40.00 1
Acreage 3 1 200.00% 68 82 -17.07 19 17 11.76
Acreage WF 0 0 0.00% 9 25 -64.00 3 4 -25.00
Lots 10 11 -9.09% 310 314 -1.27 108 54 100.00
Lots WF 0 0 0.00% 26 24 8.33 6 5 20.00
LOTS TOTAL 136
13 12.00 8.33% 413 445 -7.19% 80 70.00
Business 1 1 0.00% 25 21 19.05 12 9 33.33
Commercial 4 5 -20.00% 62 72 -13.89 30 36 -16.67
Land 3 1 200.00% 35 25 40.00 22 10 120.00
COMM TOTAL 64
8 7.00 14.29% 122 118 3.39% 55 16.36
59
GRAND TOTAL 74 2,263 2,102
-20.27% 7.66% 510 332 53.61
Totals include variables in any given month, due to preceding month's collapsed sales and deleted listings. e & oe
7
Comparative Activity -- Sales Information (Month)
Shuswap / Revelstoke Statistics -- December 2022
Description Cur Mo Lst Yr Mo Incr/Decr% Cur Mo Lst Yr Mo Incr/Decr% Cur Mo Lst Yr Mo
Zone = Shuswap / Revelstoke
Unit Sales Sales Volume List/Sale Ratio
Acreage/House 4 10 -60.00% $11,072,500
$2,625,000 -76.29% 97.45% 95.63%
Duplex 0 0 0.00% $0
$0 0.00% 0.00% 0.00%
Mobile Home 6 4 50.00% $1,120,500
$1,337,950 19.41% 92.45% 97.60%
Recreational 1 3 -66.67% $570,700
$90,000 -84.23% 94.74% 77.28%
Residential 24 28 -14.29% $21,588,600
$15,777,000 -26.92% 94.96% 97.32%
Residential WF 1 2 -50.00% $2,025,000
$1,015,000 -49.88% 96.67% 94.71%
3/4-Plex 0 0 0.00% $0
$0 0.00% 0.00% 0.00%
Apartment 8 5 60.00% $2,191,000
$3,995,000 82.34% 94.80% 97.77%
Townhouse 4 1 300.00% $840,000
$2,315,000 175.60% 96.58% 95.56%
RES TOTAL 48 53 -9.43% -31.09%
$27,154,950 $39,408,300 95.24% 96.34%
FARMS 0 0 0.00% $0
$0 0.00% 0.00% 0.00%
MULTIFAMILY 0 0 0.00% $0
$0 0.00% 0.00% 0.00%
Acreage 1 1 0.00% $278,800
$337,500 21.05% 96.46% 96.14%
Acreage WF 0 0 0.00% $0
$0 0.00% 0.00% 0.00%
Lots 3 10 -70.00% $1,522,500
$746,000 -51.00% 94.07% 98.30%
Lots WF 1 0 0.00% $0
$191,000 0.00% 98.00% 0.00%
LOTS TOTAL 5 11 -54.55% -29.25%
$1,274,500 $1,801,300 95.27% 97.96%
Business 1 1 0.00% $250,000
$1,340,000 436.00% 89.99% 100.00%
Commercial 0 3 -100.00% $3,425,009
$0 -100.00% 0.00% 110.84%
Land 0 2 -100.00% $2,045,000
$0 -100.00% 0.00% 99.80%
COMM TOTAL 1 6 -83.33% -76.57%
$1,340,000 $5,720,009 89.99% 106.14%
54
GRAND TOTAL 70 -22.86% $29,769,450 $46,929,609 -36.57% 94.99% 97.50%
Totals include variables in any given month, due to preceding month's collapsed sales and deleted listings. e & oe
8
Comparative Activity -- Sales Information (YTD)
Shuswap / Revelstoke Statistics -- December 2022
Description Cur YTD Lst YTD Incr/Decr% Cur YTD Lst YTD Incr/Decr% Cur YTD Lst YTD
Zone = Shuswap / Revelstoke
Unit Sales Sales Volume List/Sale Ratio
Acreage/House 82 142 -42.25% $125,718,862
$86,923,200 -30.86% 97.28% 97.32%
Duplex 10 11 -9.09% $6,026,000
$6,988,999 15.98% 97.01% 98.86%
Mobile Home 99 105 -5.71% $20,794,243
$24,510,535 17.87% 95.67% 97.94%
Recreational 46 56 -17.86% $9,932,676
$8,047,462 -18.98% 96.73% 95.02%
Residential 512 631 -18.86% $416,424,633
$375,462,403 -9.84% 98.19% 99.06%
Residential WF 52 70 -25.71% $80,075,250
$67,869,923 -15.24% 95.34% 95.46%
3/4-Plex 0 2 -100.00% $1,797,000
$0 -100.00% 0.00% 101.30%
Apartment 77 117 -34.19% $49,957,780
$38,627,948 -22.68% 97.90% 98.35%
Townhouse 81 120 -32.50% $55,929,239
$42,631,472 -23.78% 98.68% 98.74%
RES TOTAL 959 1,254 -23.52% -15.08%
$651,061,942 $766,655,684 97.65% 98.23%
FARMS 1 3 -66.67% $2,011,500
$2,400,000 19.31% 92.31% 101.09%
MULTIFAMILY 1 5 -80.00% $6,370,000
$675,000 -89.40% 68.18% 93.42%
Acreage 37 71 -47.89% $23,122,300
$15,703,561 -32.08% 93.05% 95.59%
Acreage WF 5 12 -58.33% $8,224,000
$3,769,000 -54.17% 91.66% 96.35%
Lots 163 293 -44.37% $43,595,200
$33,419,988 -23.34% 97.57% 96.87%
Lots WF 11 14 -21.43% $5,250,000
$4,375,000 -16.67% 92.50% 94.39%
LOTS TOTAL 216 390 -44.62% -28.59%
$57,267,549 $80,191,500 95.49% 96.28%
Business 5 5 0.00% $6,324,000
$4,542,000 -28.18% 95.99% 95.15%
Commercial 11 31 -64.52% $25,332,978
$7,246,326 -71.40% 94.51% 93.84%
Land 3 16 -81.25% $13,881,800
$3,434,705 -75.26% 95.07% 94.79%
COMM TOTAL 19 52 -63.46% -66.57%
$15,223,031 $45,538,778 95.07% 94.31%
1,196
GRAND TOTAL 1,704 -29.81% $726,627,522 $900,767,462 -19.33% 97.36% 97.82%
Totals include variables in any given month, due to preceding month's collapsed sales and deleted listings. e & oe
9
Average/Median price, Days to Sell (Month)
Shuswap / Revelstoke Statistics -- December 2022
Description Cur Mo Lst Yr Mo Incr/Decr% Cur Mo Lst Yr Mo Incr/Decr% Cur Mo Lst Yr Mo
Zone = Shuswap / Revelstoke
Average Price Median Price Days to Sell
Incr/Decr%
Acreage/House $656,250 $1,107,250 $660,000 $1,005,000 54 92
-40.73% -34.33% -41.38%
Duplex
Mobile Home $222,992 $280,125 $193,225 $280,750 68 49
-20.40% -31.18% 40.89%
Recreational $90,000 $190,233 $90,000 $103,000 118 97
-52.69% -12.62% 21.23%
Residential $657,375 $771,021 $625,000 $712,250 74 72
-14.74% -12.25% 2.93%
Residential WF $1,015,000 $1,012,500 $1,015,000 $1,012,500 109 96
0.25% 0.25% 13.54%
3/4-Plex
Apartment $499,375 $438,200 $487,500 $285,000 65 27
13.96% 71.05% 135.40%
Townhouse $578,750 $840,000 $523,000 $840,000 100 14
-31.10% -37.74% 610.71%
RES TOTAL $565,728 $743,553 $565,000 $697,500 74 71
-23.92% -19.00% 4.06%
FARMS
MULTIFAMILY
Acreage $337,500 $278,800 $337,500 $278,800 25 105
21.05% 21.05% -76.19%
Acreage WF
Lots $248,667 $152,250 $228,000 $107,500 121 58
63.33% 112.09% 109.34%
Lots WF $191,000 $191,000 63
LOTS TOTAL $254,900 $163,755 $228,000 $150,000 90 62
55.66% 52.00% 45.27%
Business $1,340,000 $250,000 $1,340,000 $250,000 254 81
436.00% 436.00% 213.58%
Commercial $1,141,670 $1,525,000 94
Land $1,022,500 $1,022,500 38
COMM TOTAL $1,340,000 $953,335 $1,340,000 $947,500 254 73
40.56% 41.42% 247.95%
GRAND TOTAL $551,286 $555,000
$670,423 $576,200 79 70
-17.77% -3.68% 12.81%
Totals include variables in any given month, due to preceding month's collapsed sales and deleted listings. e & oe
10
Average/Median price, Days to Sell (YTD)
Shuswap / Revelstoke Statistics -- December 2022
Description Cur YTD Lst YTD Incr/Decr% Cur YTD Lst YTD Incr/Decr% Cur YTD Lst YTD
Zone = Shuswap / Revelstoke
Average Price Median Price Days to Sell
Incr/Decr%
Acreage/House $1,060,039 $885,344 $949,500 $832,500 76 79
19.73% 14.05% -3.79%
Duplex $698,900 $547,818 $717,500 $510,000 87 150
27.58% 40.69% -42.06%
Mobile Home $247,581 $198,040 $230,000 $192,000 56 51
25.02% 19.79% 10.02%
Recreational $174,945 $177,369 $147,500 $131,200 87 78
-1.37% 12.42% 11.45%
Residential $733,325 $659,944 $695,000 $624,000 52 49
11.12% 11.38% 6.50%
Residential WF $1,305,191 $1,143,932 $1,148,500 $1,064,500 71 78
14.10% 7.89% -9.56%
3/4-Plex $898,500 $898,500 28
Apartment $501,662 $426,990 $450,000 $350,000 51 73
17.49% 28.57% -29.95%
Townhouse $526,314 $466,077 $481,250 $435,000 45 66
12.92% 10.63% -31.50%
RES TOTAL $678,897 $611,368 $625,000 $560,000 57 60
11.05% 11.61% -5.36%
FARMS $2,400,000 $670,500 $2,400,000 $826,500 528 62
257.94% 190.38% 756.22%
MULTIFAMILY $675,000 $1,274,000 $675,000 $1,250,000 84 72
-47.02% -46.00% 16.67%
Acreage $424,421 $325,666 $275,000 $252,000 97 142
30.32% 9.13% -32.13%
Acreage WF $753,800 $685,333 $640,000 $372,500 84 172
9.99% 71.81% -51.21%
Lots $205,031 $148,789 $149,000 $120,000 73 122
37.80% 24.17% -39.97%
Lots WF $397,727 $375,000 $214,500 $244,500 69 106
6.06% -12.27% -34.95%
LOTS TOTAL $265,128 $205,619 $169,500 $139,000 77 127
28.94% 21.94% -39.00%
Business $908,400 $1,264,800 $900,000 $1,875,000 153 245
-28.18% -52.00% -37.71%
Commercial $658,757 $817,193 $460,000 $560,000 117 183
-19.39% -17.86% -35.70%
Land $1,144,902 $867,613 $1,559,705 $593,500 417 221
31.96% 162.80% 88.53%
COMM TOTAL $801,212 $875,746 $750,000 $592,000 174 201
-8.51% 26.69% -13.23%
GRAND TOTAL $607,548 $560,000
$528,619 $467,000 63 80
14.93% 19.91% -21.11%
Totals include variables in any given month, due to preceding month's collapsed sales and deleted listings. e & oe

Okanagan Monthly Statistics - December 2022

  • 1.
    Central Okanagan MonthlyStatistics December 2022
  • 2.
    2 Table of Contents Tableof Contents 2 Zone Totals 3 Quick Summary Part 1 4 Quick Summary Part 2 5 Listing Information 6 Sales Information (Month) 7 Sales Information (YTD) 8 Average/Median Price, Days to Sell (Month) 9 Average/Median Price, Days to Sell (YTD) 10 Totals include variables in any given month, due to preceding month's collapsed sales and deleted listings. e & oe
  • 3.
    3 Zone Totals Central OkanaganStatistics -- December 2022 Description CM This Year CM Last Year Increase Increase This YTD Last YTD Area = Central Okanaga 1 Units Listed 312 382 -18.32% 10,560 11,254 6.57% 2 Units Sold 3 Sales Volume 4 List/Sell Ratio 5 Days to Sell 6 Active Listings 206 402 8,216 5,286 -48.76% -35.66% $164,651,967 $328,378,708 $6,363,729,845 $4,663,968,808 -49.86% -26.71% 100.88% 95.21% 99.92% 98.86% 52 67 47 41 28.88% -11.56% 1,928 1,062 81.54% Area = North Okanagan 1 Units Listed 101 119 -15.13% 3,697 3,713 0.43% 2 Units Sold 3 Sales Volume 4 List/Sell Ratio 5 Days to Sell 6 Active Listings 68 158 3,006 2,075 -56.96% -30.97% $37,937,759 $109,252,602 $1,864,408,587 $1,443,768,290 -65.28% -22.56% 98.90% 94.96% 99.36% 98.69% 63 82 64 49 30.40% -23.09% 815 532 53.20% Area = Shuswap / Revel 1 Units Listed 59 74 -20.27% 2,102 2,263 7.66% 2 Units Sold 3 Sales Volume 4 List/Sell Ratio 5 Days to Sell 6 Active Listings 54 70 1,704 1,196 -22.86% -29.81% $29,769,450 $46,929,609 $900,767,462 $726,627,522 -36.57% -19.33% 97.50% 94.99% 97.82% 97.36% 70 79 80 63 12.81% -21.11% 510 332 53.61% Area = South Okanagan 1 Units Listed 81 66 22.73% 3,990 2,708 -32.13% 2 Units Sold 3 Sales Volume 4 List/Sell Ratio 5 Days to Sell 6 Active Listings 91 98 3,270 2,026 -7.14% -38.04% $56,937,765 $63,773,128 $1,998,599,076 $1,372,142,332 -10.72% -31.34% 97.17% 89.17% 98.44% 97.47% 74 89 78 59 19.91% -23.95% 1,096 671 63.34% Area = South Peace Riv 1 Units Listed 10 12 -16.67% 945 212 -77.57% 2 Units Sold 3 Sales Volume 4 List/Sell Ratio 5 Days to Sell 6 Active Listings 29 28 619 603 3.57% -2.58% $7,345,650 $8,573,597 $171,116,685 $176,412,217 -14.32% 3.09% 96.14% 96.91% 95.94% 94.92% 113 69 123 105 -38.66% -15.00% 389 429 -9.32% 563 653 -13.78% Area = Grand Total 1 Units Listed 21,294 20,150 -5.37% 2 Units Sold 3 Sales Volume 4 List/Sell Ratio 5 Days to Sell 6 Active Listings 16,815 11,186 756 448 -40.74% -33.48% $296,642,591 $556,907,644 $11,298,621,655 $8,382,919,169 -46.73% -25.81% 99.69% 93.97% 99.33% 98.38% 61 62 75 52 23.34% -16.56% 4,738 3,026 56.58% Totals include variables in any given month, due to preceding month's collapsed sales and deleted listings. e & oe
  • 4.
    4 Quick Summary Part1 Central Okanagan Statistics -- December 2022 This Month Last Month This Month Last Year 206 $164,651,967 267 $230,891,063 402 $328,378,708 86 120 152 $87,912,142 $128,790,020 $153,539,405 Description Total Units Sold Total Sales Volume Total Units Sold Total Sales Volume Description Inventory Total Listings Taken This Month Last Year Last Month This Month 382 584 312 1,928 2,396 1,062 Residential Totals include variables in any given month, due to preceding month's collapsed sales and deleted listings. e & oe
  • 5.
    5 Quick Summary Part2 Central Okanagan Statistics -- December 2022 Condo/Apt 47 Sales New Listings 64 Current Inventory Sell/Inv. Ratio Days to Sell 57 12.67% Average Price Median Price $525,740 $471,675 371 Condo/Townhouse 36 Sales New Listings 41 Current Inventory Sell/Inv. Ratio Days to Sell 62 16.36% Average Price Median Price $723,784 $637,500 220 Lots 3 Sales New Listings 20 Current Inventory Sell/Inv. Ratio Days to Sell 105 1.95% Average Price Median Price $243,333 $125,000 154 Residential 86 Sales New Listings 128 Current Inventory Sell/Inv. Ratio Days to Sell 64 12.67% Average Price Median Price $1,022,234 $887,000 679 Ratio of Sales vs Inventory 12.46% Totals include variables in any given month, due to preceding month's collapsed sales and deleted listings. e & oe
  • 6.
    6 Comparative Activity --Listing Information Central Okanagan Statistics -- December 2022 Description Cur Mo Lst Yr Mo Incr/Decr% Cur YTD Lst YTD Incr/Decr% Cur Mo Lst Yr Mo Incr/Decr% Inventory Zone = Central Okanagan Acreage/House 9 8 12.50% 342 337 1.48 91 74 22.97 Duplex 4 12 -66.67% 252 267 -5.62 30 15 100.00 Mobile Home 11 10 10.00% 402 389 3.34 53 35 51.43 Recreational 0 1 -100.00% 36 27 33.33 13 4 225.00 Residential 128 132 -3.03% 4,979 4,206 18.38 679 256 165.23 Residential WF 1 4 -75.00% 104 116 -10.34 30 24 25.00 3/4-Plex 0 0 0.00% 15 23 -34.78 2 2 0.00 Timeshare 0 0 0.00% 2 1 100.00 1 Apartment 64 113 -43.36% 2,362 2,565 -7.91 371 189 96.30 Townhouse 41 43 -4.65% 1,473 1,354 8.79 220 83 165.06 RES TOTAL 258 323.00 -20.12% 9,967 9,285 7.35% 1,490 682 118.48 FARMS 0 3 -100.00% 50 56 -10.71 16 15 6.67 MULTIFAMILY 1 2 -50.00% 32 32 0.00 13 6 116.67 Acreage 1 1 0.00% 60 87 -31.03 26 32 -18.75 Acreage WF 1 1 0.00% 16 22 -27.27 8 15 -46.67 Lots 16 15 6.67% 414 509 -18.66 110 86 27.91 Lots WF 2 0 0.00% 29 25 16.00 10 7 42.86 LOTS TOTAL 154 20 17.00 17.65% 519 643 -19.28% 140 10.00 Business 6 6 0.00% 95 54 75.93 42 21 100.00 Commercial 23 26 -11.54% 467 406 15.02 172 165 4.24 Land 4 5 -20.00% 124 84 47.62 41 33 24.24 COMM TOTAL 255 33 37.00 -10.81% 686 544 26.10% 219 16.44 312 GRAND TOTAL 382 11,254 10,560 -18.32% 6.57% 1,928 1,062 81.54 Totals include variables in any given month, due to preceding month's collapsed sales and deleted listings. e & oe
  • 7.
    7 Comparative Activity --Sales Information (Month) Central Okanagan Statistics -- December 2022 Description Cur Mo Lst Yr Mo Incr/Decr% Cur Mo Lst Yr Mo Incr/Decr% Cur Mo Lst Yr Mo Zone = Central Okanagan Unit Sales Sales Volume List/Sale Ratio Acreage/House 4 6 -33.33% $10,800,013 $11,085,000 2.64% 97.24% 95.17% Duplex 2 12 -83.33% $10,466,000 $2,245,000 -78.55% 98.68% 101.96% Mobile Home 8 25 -68.00% $6,255,756 $1,723,587 -72.45% 92.54% 97.02% Recreational 0 3 -100.00% $915,000 $0 -100.00% 0.00% 95.41% Residential 86 152 -43.42% $153,539,405 $87,912,142 -42.74% 94.56% 100.41% Residential WF 1 3 -66.67% $5,497,694 $975,000 -82.27% 97.60% 93.98% 3/4-Plex 0 0 0.00% $0 $0 0.00% 0.00% 0.00% Timeshare 0 0 0.00% $0 $0 0.00% 0.00% 0.00% Apartment 47 109 -56.88% $55,517,563 $24,709,800 -55.49% 96.11% 99.99% Townhouse 36 53 -32.08% $36,984,327 $26,056,235 -29.55% 96.51% 101.31% RES TOTAL 184 363 -49.31% -44.74% $154,706,764 $279,975,758 95.37% 100.06% FARMS 0 1 -100.00% $2,300,000 $0 -100.00% 0.00% 92.04% MULTIFAMILY 0 1 -100.00% $1,550,000 $0 -100.00% 0.00% 91.28% Acreage 0 3 -100.00% $4,116,000 $0 -100.00% 0.00% 99.55% Acreage WF 0 0 0.00% $0 $0 0.00% 0.00% 0.00% Lots 3 9 -66.67% $4,430,499 $730,000 -83.52% 89.08% 97.44% Lots WF 0 0 0.00% $0 $0 0.00% 0.00% 0.00% LOTS TOTAL 3 12 -75.00% -91.46% $730,000 $8,546,499 89.08% 98.44% Business 0 4 -100.00% $1,162,000 $0 -100.00% 0.00% 97.74% Commercial 15 18 -16.67% $7,969,451 $5,205,203 -34.69% 97.04% 96.91% Land 4 3 33.33% $26,875,000 $4,010,000 -85.08% 88.23% 114.80% COMM TOTAL 19 25 -24.00% -74.41% $9,215,203 $36,006,451 93.00% 109.70% 206 GRAND TOTAL 402 -48.76% $164,651,967 $328,378,708 -49.86% 95.21% 100.88% Totals include variables in any given month, due to preceding month's collapsed sales and deleted listings. e & oe
  • 8.
    8 Comparative Activity --Sales Information (YTD) Central Okanagan Statistics -- December 2022 Description Cur YTD Lst YTD Incr/Decr% Cur YTD Lst YTD Incr/Decr% Cur YTD Lst YTD Zone = Central Okanagan Unit Sales Sales Volume List/Sale Ratio Acreage/House 93 173 -46.24% $319,830,275 $209,259,650 -34.57% 95.01% 95.88% Duplex 117 211 -44.55% $164,147,916 $99,085,296 -39.64% 100.85% 100.88% Mobile Home 253 291 -13.06% $66,700,135 $67,255,136 0.83% 98.12% 97.79% Recreational 11 21 -47.62% $5,293,300 $3,706,700 -29.97% 96.14% 96.58% Residential 2,110 3,332 -36.67% $3,287,512,989 $2,426,269,963 -26.20% 99.14% 101.11% Residential WF 37 81 -54.32% $228,542,779 $129,549,638 -43.31% 96.73% 94.72% 3/4-Plex 8 14 -42.86% $16,176,500 $10,335,399 -36.11% 100.33% 99.62% Timeshare 0 2 -100.00% $259,700 $0 -100.00% 0.00% 87.59% Apartment 1,430 2,178 -34.34% $974,281,753 $784,203,445 -19.51% 99.75% 99.60% Townhouse 780 1,157 -32.58% $755,039,626 $588,142,602 -22.10% 99.94% 101.07% RES TOTAL 4,839 7,460 -35.13% -25.78% $4,317,807,828 $5,817,784,973 99.10% 100.23% FARMS 7 12 -41.67% $25,720,000 $16,905,000 -34.27% 90.00% 96.22% MULTIFAMILY 3 13 -76.92% $29,553,800 $10,550,000 -64.30% 97.35% 96.51% Acreage 19 42 -54.76% $56,782,775 $31,707,000 -44.16% 97.22% 93.60% Acreage WF 2 9 -77.78% $16,491,000 $1,829,000 -88.91% 75.36% 85.55% Lots 155 386 -59.84% $148,764,005 $85,519,915 -42.51% 96.54% 97.97% Lots WF 7 14 -50.00% $16,911,500 $11,260,000 -33.42% 93.42% 94.24% LOTS TOTAL 183 451 -59.42% -45.46% $130,315,915 $238,949,280 96.04% 95.68% Business 15 17 -11.76% $8,083,129 $6,410,000 -20.70% 90.64% 93.22% Commercial 212 215 -1.40% $125,337,783 $107,620,072 -14.14% 98.24% 99.32% Land 27 48 -43.75% $118,300,880 $74,359,992 -37.14% 94.32% 96.44% COMM TOTAL 254 280 -9.29% -25.16% $188,390,064 $251,721,792 96.39% 97.74% 5,286 GRAND TOTAL 8,216 -35.66% $4,663,968,808 $6,363,729,845 -26.71% 98.86% 99.92% Totals include variables in any given month, due to preceding month's collapsed sales and deleted listings. e & oe
  • 9.
    9 Average/Median price, Daysto Sell (Month) Central Okanagan Statistics -- December 2022 Description Cur Mo Lst Yr Mo Incr/Decr% Cur Mo Lst Yr Mo Incr/Decr% Cur Mo Lst Yr Mo Zone = Central Okanagan Average Price Median Price Days to Sell Incr/Decr% Acreage/House $2,771,250 $1,800,002 $2,477,500 $1,887,500 38 71 53.96% 31.26% -46.13% Duplex $1,122,500 $872,167 $1,122,500 $747,000 30 37 28.70% 50.27% -20.81% Mobile Home $215,448 $250,230 $212,500 $248,000 56 59 -13.90% -14.31% -5.40% Recreational $305,000 $290,000 97 Residential $1,022,234 $1,010,128 $887,000 $919,500 64 38 1.20% -3.53% 65.81% Residential WF $975,000 $1,832,565 $975,000 $2,060,194 62 83 -46.80% -52.67% -25.00% 3/4-Plex Timeshare Apartment $525,740 $509,335 $471,675 $444,900 57 31 3.22% 6.02% 85.42% Townhouse $723,784 $697,817 $637,500 $662,025 62 40 3.72% -3.70% 54.92% RES TOTAL $840,798 $771,283 $735,613 $700,000 60 39 9.01% 5.09% 54.40% FARMS $2,300,000 $2,300,000 92 MULTIFAMILY $1,550,000 $1,550,000 138 Acreage $1,372,000 $395,000 221 Acreage WF Lots $243,333 $492,278 $125,000 $482,500 105 72 -50.57% -74.09% 47.20% Lots WF LOTS TOTAL $243,333 $712,208 $125,000 $438,750 105 109 -65.83% -71.51% -3.36% Business $290,500 $205,000 119 Commercial $347,014 $442,747 $22 $28 126 223 -21.62% -21.43% -43.33% Land $1,002,500 $8,958,333 $1,012,500 $2,400,000 94 174 -88.81% -57.81% -45.94% COMM TOTAL $485,011 $1,440,258 $22 $110,000 119 200 -66.32% -99.98% -40.36% GRAND TOTAL $799,281 $715,000 $816,862 $693,000 67 52 -2.15% 3.17% 28.88% Totals include variables in any given month, due to preceding month's collapsed sales and deleted listings. e & oe
  • 10.
    10 Average/Median price, Daysto Sell (YTD) Central Okanagan Statistics -- December 2022 Description Cur YTD Lst YTD Incr/Decr% Cur YTD Lst YTD Incr/Decr% Cur YTD Lst YTD Zone = Central Okanagan Average Price Median Price Days to Sell Incr/Decr% Acreage/House $2,250,104 $1,848,730 $1,680,000 $1,540,000 87 81 21.71% 9.09% 7.93% Duplex $846,883 $777,952 $750,000 $689,900 25 38 8.86% 8.71% -34.12% Mobile Home $265,831 $229,210 $261,900 $217,500 40 51 15.98% 20.41% -21.80% Recreational $336,973 $252,062 $239,500 $266,000 41 60 33.69% -9.96% -31.36% Residential $1,149,891 $986,649 $1,030,000 $886,000 34 32 16.55% 16.25% 6.24% Residential WF $3,501,342 $2,821,516 $3,600,000 $2,350,000 88 92 24.09% 53.19% -3.98% 3/4-Plex $1,291,925 $1,155,464 $1,264,500 $740,000 64 49 11.81% 70.88% 30.74% Timeshare $129,850 $129,850 145 Apartment $548,394 $447,329 $482,250 $415,000 36 40 22.59% 16.20% -9.34% Townhouse $754,029 $652,584 $715,000 $619,900 34 39 15.55% 15.34% -11.59% RES TOTAL $892,293 $779,864 $780,000 $690,000 36 38 14.42% 13.04% -4.99% FARMS $2,415,000 $2,143,333 $2,175,000 $2,045,000 117 101 12.67% 6.36% 16.46% MULTIFAMILY $3,516,667 $2,273,369 $3,250,000 $1,575,000 102 96 54.69% 106.35% 6.76% Acreage $1,668,789 $1,351,971 $970,000 $750,000 120 132 23.43% 29.33% -8.71% Acreage WF $914,500 $1,832,333 $914,500 $1,565,000 206 209 -50.09% -41.57% -1.57% Lots $551,741 $385,399 $440,000 $324,950 71 102 43.16% 35.41% -30.63% Lots WF $1,608,571 $1,207,964 $1,300,000 $959,500 70 120 33.16% 35.49% -41.82% LOTS TOTAL $712,109 $529,821 $457,000 $356,000 77 108 34.41% 28.37% -28.04% Business $427,333 $475,478 $135,000 $185,000 92 141 -10.13% -27.03% -34.52% Commercial $507,642 $582,966 $20 $24 105 153 -12.92% -14.89% -31.28% Land $2,754,074 $2,464,602 $1,750,000 $1,194,106 131 251 11.75% 46.55% -47.77% COMM TOTAL $741,693 $899,006 $23 $65,000 107 169 -17.50% -99.97% -36.64% GRAND TOTAL $882,325 $755,000 $774,553 $665,000 41 47 13.91% 13.53% -11.56% Totals include variables in any given month, due to preceding month's collapsed sales and deleted listings. e & oe
  • 11.
    North Okanagan MonthlyStatistics December 2022
  • 12.
    2 Table of Contents Tableof Contents 2 Zone Totals 3 Quick Summary Part 1 4 Quick Summary Part 2 5 Listing Information 6 Sales Information (Month) 7 Sales Information (YTD) 8 Average/Median Price, Days to Sell (Month) 9 Average/Median Price, Days to Sell (YTD) 10 Totals include variables in any given month, due to preceding month's collapsed sales and deleted listings. e & oe
  • 13.
    3 Zone Totals Central OkanaganStatistics -- December 2022 Description CM This Year CM Last Year Increase Increase This YTD Last YTD Area = Central Okanaga 1 Units Listed 312 382 -18.32% 10,560 11,254 6.57% 2 Units Sold 3 Sales Volume 4 List/Sell Ratio 5 Days to Sell 6 Active Listings 206 402 8,216 5,286 -48.76% -35.66% $164,651,967 $328,378,708 $6,363,729,845 $4,663,968,808 -49.86% -26.71% 100.88% 95.21% 99.92% 98.86% 52 67 47 41 28.88% -11.56% 1,928 1,062 81.54% Area = North Okanagan 1 Units Listed 101 119 -15.13% 3,697 3,713 0.43% 2 Units Sold 3 Sales Volume 4 List/Sell Ratio 5 Days to Sell 6 Active Listings 68 158 3,006 2,075 -56.96% -30.97% $37,937,759 $109,252,602 $1,864,408,587 $1,443,768,290 -65.28% -22.56% 98.90% 94.96% 99.36% 98.69% 63 82 64 49 30.40% -23.09% 815 532 53.20% Area = Shuswap / Revel 1 Units Listed 59 74 -20.27% 2,102 2,263 7.66% 2 Units Sold 3 Sales Volume 4 List/Sell Ratio 5 Days to Sell 6 Active Listings 54 70 1,704 1,196 -22.86% -29.81% $29,769,450 $46,929,609 $900,767,462 $726,627,522 -36.57% -19.33% 97.50% 94.99% 97.82% 97.36% 70 79 80 63 12.81% -21.11% 510 332 53.61% Area = South Okanagan 1 Units Listed 81 66 22.73% 3,990 2,708 -32.13% 2 Units Sold 3 Sales Volume 4 List/Sell Ratio 5 Days to Sell 6 Active Listings 91 98 3,270 2,026 -7.14% -38.04% $56,937,765 $63,773,128 $1,998,599,076 $1,372,142,332 -10.72% -31.34% 97.17% 89.17% 98.44% 97.47% 74 89 78 59 19.91% -23.95% 1,096 671 63.34% Area = South Peace Riv 1 Units Listed 10 12 -16.67% 945 212 -77.57% 2 Units Sold 3 Sales Volume 4 List/Sell Ratio 5 Days to Sell 6 Active Listings 29 28 619 603 3.57% -2.58% $7,345,650 $8,573,597 $171,116,685 $176,412,217 -14.32% 3.09% 96.14% 96.91% 95.94% 94.92% 113 69 123 105 -38.66% -15.00% 389 429 -9.32% 563 653 -13.78% Area = Grand Total 1 Units Listed 21,294 20,150 -5.37% 2 Units Sold 3 Sales Volume 4 List/Sell Ratio 5 Days to Sell 6 Active Listings 16,815 11,186 756 448 -40.74% -33.48% $296,642,591 $556,907,644 $11,298,621,655 $8,382,919,169 -46.73% -25.81% 99.69% 93.97% 99.33% 98.38% 61 62 75 52 23.34% -16.56% 4,738 3,026 56.58% Totals include variables in any given month, due to preceding month's collapsed sales and deleted listings. e & oe
  • 14.
    4 Quick Summary Part1 North Okanagan Statistics -- December 2022 This Month Last Month This Month Last Year 68 $37,937,759 107 $67,276,833 158 $109,252,602 27 53 63 $19,393,700 $36,713,346 $44,933,898 Description Total Units Sold Total Sales Volume Total Units Sold Total Sales Volume Description Inventory Total Listings Taken This Month Last Year Last Month This Month 119 207 101 815 912 532 Residential Totals include variables in any given month, due to preceding month's collapsed sales and deleted listings. e & oe
  • 15.
    5 Quick Summary Part2 North Okanagan Statistics -- December 2022 Condo/Apt 12 Sales New Listings 8 Current Inventory Sell/Inv. Ratio Days to Sell 57 31.58% Average Price Median Price $291,000 $299,000 38 Condo/Townhouse 14 Sales New Listings 19 Current Inventory Sell/Inv. Ratio Days to Sell 57 22.22% Average Price Median Price $487,503 $402,500 63 Lots 2 Sales New Listings 14 Current Inventory Sell/Inv. Ratio Days to Sell 238 Average Price Median Price $285,000 $285,000 Residential 27 Sales New Listings 29 Current Inventory Sell/Inv. Ratio Days to Sell 65 12.80% Average Price Median Price $718,285 $713,200 211 Ratio of Sales vs Inventory 15.54% Totals include variables in any given month, due to preceding month's collapsed sales and deleted listings. e & oe
  • 16.
    6 Comparative Activity --Listing Information North Okanagan Statistics -- December 2022 Description Cur Mo Lst Yr Mo Incr/Decr% Cur YTD Lst YTD Incr/Decr% Cur Mo Lst Yr Mo Incr/Decr% Inventory Zone = North Okanagan Acreage/House 7 14 -50.00% 387 375 3.20 81 70 15.71 Duplex 3 2 50.00% 120 103 16.50 27 14 92.86 Mobile Home 3 6 -50.00% 140 141 -0.71 27 15 80.00 Recreational 1 0 0.00% 29 21 38.10 10 6 66.67 Residential 29 44 -34.09% 1,546 1,471 5.10 211 92 129.35 Residential WF 2 1 100.00% 52 47 10.64 14 8 75.00 3/4-Plex 0 0 0.00% 14 16 -12.50 5 3 66.67 Apartment 8 18 -55.56% 291 322 -9.63 38 40 -5.00 Townhouse 19 13 46.15% 430 473 -9.09 63 30 110.00 RES TOTAL 72 98.00 -26.53% 3,009 2,969 1.35% 476 278 71.22 FARMS 0 4 -100.00% 62 65 -4.62 27 26 3.85 MULTIFAMILY 0 0 0.00% 29 14 107.14 19 3 533.33 Acreage 3 1 200.00% 94 96 -2.08 42 33 27.27 Acreage WF 0 0 0.00% 4 13 -69.23 3 Lots 11 7 57.14% 252 229 10.04 104 61 70.49 Lots WF 0 0 0.00% 7 19 -63.16 2 1 100.00 LOTS TOTAL 148 14 8.00 75.00% 357 357 0.00% 98 51.02 Business 0 1 -100.00% 37 37 0.00 18 16 12.50 Commercial 13 2 550.00% 161 183 -12.02 74 72 2.78 Land 2 6 -66.67% 58 72 -19.44 53 39 35.90 COMM TOTAL 145 15 9.00 66.67% 256 292 -12.33% 127 14.17 101 GRAND TOTAL 119 3,713 3,697 -15.13% 0.43% 815 532 53.20 Totals include variables in any given month, due to preceding month's collapsed sales and deleted listings. e & oe
  • 17.
    7 Comparative Activity --Sales Information (Month) North Okanagan Statistics -- December 2022 Description Cur Mo Lst Yr Mo Incr/Decr% Cur Mo Lst Yr Mo Incr/Decr% Cur Mo Lst Yr Mo Zone = North Okanagan Unit Sales Sales Volume List/Sale Ratio Acreage/House 5 20 -75.00% $20,958,999 $4,309,000 -79.44% 100.71% 97.33% Duplex 0 3 -100.00% $2,400,500 $0 -100.00% 0.00% 102.68% Mobile Home 4 5 -20.00% $1,512,500 $607,000 -59.87% 92.14% 102.98% Recreational 1 0 0.00% $0 $91,000 0.00% 91.92% 0.00% Residential 27 63 -57.14% $44,933,898 $19,393,700 -56.84% 96.49% 100.41% Residential WF 0 1 -100.00% $2,675,000 $0 -100.00% 0.00% 100.00% 3/4-Plex 0 1 -100.00% $1,240,000 $0 -100.00% 0.00% 99.28% Apartment 12 13 -7.69% $3,938,300 $3,492,000 -11.33% 95.68% 98.45% Townhouse 14 21 -33.33% $10,719,050 $6,825,048 -36.33% 96.86% 101.35% RES TOTAL 63 127 -50.39% -60.72% $34,717,748 $88,378,247 96.89% 99.76% FARMS 1 1 0.00% $6,000,000 $1,750,000 -70.83% 83.37% 96.00% MULTIFAMILY 0 0 0.00% $0 $0 0.00% 0.00% 0.00% Acreage 1 4 -75.00% $3,309,000 $270,000 -91.84% 90.30% 93.64% Acreage WF 0 1 -100.00% $335,000 $0 -100.00% 0.00% 101.58% Lots 1 15 -93.33% $4,256,450 $300,000 -92.95% 92.31% 97.49% Lots WF 0 0 0.00% $0 $0 0.00% 0.00% 0.00% LOTS TOTAL 2 20 -90.00% -92.79% $570,000 $7,900,450 91.35% 96.00% Business 0 0 0.00% $0 $0 0.00% 0.00% 0.00% Commercial 1 9 -88.89% $5,193,905 $11 -100.00% 0.00% 92.85% Land 1 1 0.00% $1,780,000 $900,000 -49.44% 64.33% 98.89% COMM TOTAL 2 10 -80.00% -87.09% $900,011 $6,973,905 64.33% 94.32% 68 GRAND TOTAL 158 -56.96% $37,937,759 $109,252,602 -65.28% 94.96% 98.90% Totals include variables in any given month, due to preceding month's collapsed sales and deleted listings. e & oe
  • 18.
    8 Comparative Activity --Sales Information (YTD) North Okanagan Statistics -- December 2022 Description Cur YTD Lst YTD Incr/Decr% Cur YTD Lst YTD Incr/Decr% Cur YTD Lst YTD Zone = North Okanagan Unit Sales Sales Volume List/Sale Ratio Acreage/House 171 252 -32.14% $269,532,451 $211,467,533 -21.54% 95.73% 98.49% Duplex 60 83 -27.71% $55,923,925 $48,602,600 -13.09% 99.90% 100.37% Mobile Home 101 132 -23.48% $31,485,244 $26,984,073 -14.30% 98.43% 98.67% Recreational 14 15 -6.67% $2,914,400 $2,245,100 -22.97% 93.85% 96.41% Residential 923 1,289 -28.39% $884,867,904 $740,443,611 -16.32% 99.80% 100.91% Residential WF 17 44 -61.36% $70,817,615 $27,108,150 -61.72% 94.06% 96.85% 3/4-Plex 4 14 -71.43% $10,299,090 $4,403,200 -57.25% 98.20% 98.44% Apartment 226 299 -24.41% $85,881,415 $75,363,656 -12.25% 99.40% 98.01% Townhouse 310 436 -28.90% $192,738,997 $157,941,530 -18.05% 100.76% 100.43% RES TOTAL 1,826 2,564 -28.78% -19.31% $1,294,559,453 $1,604,461,041 99.04% 100.01% FARMS 10 7 42.86% $14,378,000 $22,462,000 56.22% 97.49% 94.79% MULTIFAMILY 4 8 -50.00% $7,798,000 $6,578,000 -15.65% 97.34% 95.07% Acreage 38 77 -50.65% $50,553,300 $23,045,700 -54.41% 97.01% 94.23% Acreage WF 3 15 -80.00% $10,074,100 $3,010,000 -70.12% 92.08% 96.21% Lots 114 186 -38.71% $54,943,125 $44,129,151 -19.68% 96.15% 98.19% Lots WF 3 13 -76.92% $10,517,500 $3,229,999 -69.29% 98.09% 95.82% LOTS TOTAL 158 291 -45.70% -41.77% $73,414,850 $126,088,025 96.32% 96.21% Business 10 8 25.00% $16,643,000 $6,312,000 -62.07% 89.12% 92.14% Commercial 61 103 -40.78% $59,291,218 $34,274,487 -42.19% 96.60% 96.26% Land 6 25 -76.00% $35,749,304 $6,167,500 -82.75% 84.89% 94.09% COMM TOTAL 77 136 -43.38% -58.14% $46,753,987 $111,683,521 93.83% 94.93% 2,075 GRAND TOTAL 3,006 -30.97% $1,443,768,290 $1,864,408,587 -22.56% 98.69% 99.36% Totals include variables in any given month, due to preceding month's collapsed sales and deleted listings. e & oe
  • 19.
    9 Average/Median price, Daysto Sell (Month) North Okanagan Statistics -- December 2022 Description Cur Mo Lst Yr Mo Incr/Decr% Cur Mo Lst Yr Mo Incr/Decr% Cur Mo Lst Yr Mo Zone = North Okanagan Average Price Median Price Days to Sell Incr/Decr% Acreage/House $861,800 $1,047,950 $839,000 $955,000 76 101 -17.76% -12.15% -24.72% Duplex $800,167 $885,000 57 Mobile Home $151,750 $302,500 $157,500 $335,000 96 52 -49.83% -52.99% 85.33% Recreational $91,000 $91,000 137 Residential $718,285 $713,236 $713,200 $708,840 65 33 0.71% 0.62% 98.76% Residential WF $2,675,000 $2,675,000 20 3/4-Plex $1,240,000 $1,240,000 69 Apartment $291,000 $302,946 $299,000 $315,000 57 33 -3.94% -5.08% 70.99% Townhouse $487,503 $510,431 $402,500 $549,900 57 48 -4.49% -26.80% 19.14% RES TOTAL $551,075 $695,892 $517,500 $647,000 66 48 -20.81% -20.02% 38.26% FARMS $1,750,000 $6,000,000 $1,750,000 $6,000,000 119 71 -70.83% -70.83% 67.61% MULTIFAMILY Acreage $270,000 $827,250 $270,000 $875,000 25 295 -67.36% -69.14% -91.52% Acreage WF $335,000 $335,000 181 Lots $300,000 $283,763 $300,000 $271,000 451 89 5.72% 10.70% 406.74% Lots WF LOTS TOTAL $285,000 $395,023 $285,000 $297,000 238 135 -27.85% -4.04% 76.62% Business Commercial $11 $577,101 $11 $605,000 47 125 -100.00% -100.00% -62.50% Land $900,000 $1,780,000 $900,000 $1,780,000 807 31 -49.44% -49.44% 2,503.23% COMM TOTAL $450,006 $697,390 $450,006 $660,000 427 116 -35.47% -31.82% 268.42% GRAND TOTAL $557,908 $501,250 $691,472 $602,000 82 63 -19.32% -16.74% 30.40% Totals include variables in any given month, due to preceding month's collapsed sales and deleted listings. e & oe
  • 20.
    10 Average/Median price, Daysto Sell (YTD) North Okanagan Statistics -- December 2022 Description Cur YTD Lst YTD Incr/Decr% Cur YTD Lst YTD Incr/Decr% Cur YTD Lst YTD Zone = North Okanagan Average Price Median Price Days to Sell Incr/Decr% Acreage/House $1,236,652 $1,069,573 $1,100,000 $934,000 68 69 15.62% 17.77% -1.19% Duplex $810,043 $673,782 $747,500 $650,000 45 43 20.22% 15.00% 4.25% Mobile Home $267,169 $238,525 $250,000 $237,450 44 61 12.01% 5.29% -27.55% Recreational $160,364 $194,293 $138,050 $150,000 48 120 -17.46% -7.97% -59.93% Residential $802,214 $686,476 $725,000 $625,000 37 38 16.86% 16.00% -0.88% Residential WF $1,594,597 $1,609,491 $1,285,000 $1,350,000 88 75 -0.93% -4.81% 18.08% 3/4-Plex $1,100,800 $735,649 $1,135,000 $749,950 57 83 49.64% 51.34% -31.27% Apartment $333,468 $287,229 $310,000 $267,000 39 67 16.10% 16.10% -41.59% Townhouse $509,489 $442,062 $496,300 $430,000 33 41 15.25% 15.42% -19.35% RES TOTAL $708,959 $625,765 $625,000 $550,000 41 47 13.29% 13.64% -13.72% FARMS $2,246,200 $2,054,000 $1,895,000 $1,500,000 128 130 9.36% 26.33% -1.29% MULTIFAMILY $1,644,500 $974,750 $1,374,000 $747,000 235 89 68.71% 83.94% 164.70% Acreage $606,466 $656,536 $449,950 $490,000 128 227 -7.63% -8.17% -43.78% Acreage WF $1,003,333 $671,607 $875,000 $656,000 227 214 49.39% 33.38% 5.85% Lots $387,098 $295,393 $325,000 $269,450 81 138 31.04% 20.62% -41.35% Lots WF $1,076,666 $809,038 $1,230,000 $660,000 52 85 33.08% 86.36% -39.27% LOTS TOTAL $464,651 $433,292 $352,975 $310,000 94 163 7.24% 13.86% -42.15% Business $631,200 $2,080,375 $285,000 $752,500 243 148 -69.66% -62.13% 63.92% Commercial $561,877 $575,643 $179,000 $325,000 114 137 -2.39% -44.92% -17.08% Land $1,027,917 $1,429,972 $782,500 $980,000 250 300 -28.12% -20.15% -16.51% COMM TOTAL $607,195 $821,202 $199,900 $430,250 141 168 -26.06% -53.54% -15.86% GRAND TOTAL $695,792 $610,000 $620,229 $534,948 49 64 12.18% 14.03% -23.09% Totals include variables in any given month, due to preceding month's collapsed sales and deleted listings. e & oe
  • 21.
    Shuswap / RevelstokeMonthly Statistics December 2022
  • 22.
    2 Table of Contents Tableof Contents 2 Zone Totals 3 Quick Summary Part 1 4 Quick Summary Part 2 5 Listing Information 6 Sales Information (Month) 7 Sales Information (YTD) 8 Average/Median Price, Days to Sell (Month) 9 Average/Median Price, Days to Sell (YTD) 10 Totals include variables in any given month, due to preceding month's collapsed sales and deleted listings. e & oe
  • 23.
    3 Zone Totals Central OkanaganStatistics -- December 2022 Description CM This Year CM Last Year Increase Increase This YTD Last YTD Area = Central Okanaga 1 Units Listed 312 382 -18.32% 10,560 11,254 6.57% 2 Units Sold 3 Sales Volume 4 List/Sell Ratio 5 Days to Sell 6 Active Listings 206 402 8,216 5,286 -48.76% -35.66% $164,651,967 $328,378,708 $6,363,729,845 $4,663,968,808 -49.86% -26.71% 100.88% 95.21% 99.92% 98.86% 52 67 47 41 28.88% -11.56% 1,928 1,062 81.54% Area = North Okanagan 1 Units Listed 101 119 -15.13% 3,697 3,713 0.43% 2 Units Sold 3 Sales Volume 4 List/Sell Ratio 5 Days to Sell 6 Active Listings 68 158 3,006 2,075 -56.96% -30.97% $37,937,759 $109,252,602 $1,864,408,587 $1,443,768,290 -65.28% -22.56% 98.90% 94.96% 99.36% 98.69% 63 82 64 49 30.40% -23.09% 815 532 53.20% Area = Shuswap / Revel 1 Units Listed 59 74 -20.27% 2,102 2,263 7.66% 2 Units Sold 3 Sales Volume 4 List/Sell Ratio 5 Days to Sell 6 Active Listings 54 70 1,704 1,196 -22.86% -29.81% $29,769,450 $46,929,609 $900,767,462 $726,627,522 -36.57% -19.33% 97.50% 94.99% 97.82% 97.36% 70 79 80 63 12.81% -21.11% 510 332 53.61% Area = South Okanagan 1 Units Listed 81 66 22.73% 3,990 2,708 -32.13% 2 Units Sold 3 Sales Volume 4 List/Sell Ratio 5 Days to Sell 6 Active Listings 91 98 3,270 2,026 -7.14% -38.04% $56,937,765 $63,773,128 $1,998,599,076 $1,372,142,332 -10.72% -31.34% 97.17% 89.17% 98.44% 97.47% 74 89 78 59 19.91% -23.95% 1,096 671 63.34% Area = South Peace Riv 1 Units Listed 10 12 -16.67% 945 212 -77.57% 2 Units Sold 3 Sales Volume 4 List/Sell Ratio 5 Days to Sell 6 Active Listings 29 28 619 603 3.57% -2.58% $7,345,650 $8,573,597 $171,116,685 $176,412,217 -14.32% 3.09% 96.14% 96.91% 95.94% 94.92% 113 69 123 105 -38.66% -15.00% 389 429 -9.32% 563 653 -13.78% Area = Grand Total 1 Units Listed 21,294 20,150 -5.37% 2 Units Sold 3 Sales Volume 4 List/Sell Ratio 5 Days to Sell 6 Active Listings 16,815 11,186 756 448 -40.74% -33.48% $296,642,591 $556,907,644 $11,298,621,655 $8,382,919,169 -46.73% -25.81% 99.69% 93.97% 99.33% 98.38% 61 62 75 52 23.34% -16.56% 4,738 3,026 56.58% Totals include variables in any given month, due to preceding month's collapsed sales and deleted listings. e & oe
  • 24.
    4 Quick Summary Part1 Shuswap / Revelstoke Statistics -- December 2022 This Month Last Month This Month Last Year 54 $29,769,450 65 $38,324,399 70 $46,929,609 24 36 28 $15,777,000 $24,226,000 $21,588,600 Description Total Units Sold Total Sales Volume Total Units Sold Total Sales Volume Description Inventory Total Listings Taken This Month Last Year Last Month This Month 74 109 59 510 629 332 Residential Totals include variables in any given month, due to preceding month's collapsed sales and deleted listings. e & oe
  • 25.
    5 Quick Summary Part2 Shuswap / Revelstoke Statistics -- December 2022 Condo/Apt 8 Sales New Listings 5 Current Inventory Sell/Inv. Ratio Days to Sell 65 25.00% Average Price Median Price $499,375 $487,500 32 Condo/Townhouse 4 Sales New Listings 5 Current Inventory Sell/Inv. Ratio Days to Sell 100 22.22% Average Price Median Price $578,750 $523,000 18 Lots 5 Sales New Listings 13 Current Inventory Sell/Inv. Ratio Days to Sell 90 3.68% Average Price Median Price $254,900 $228,000 136 Residential 24 Sales New Listings 18 Current Inventory Sell/Inv. Ratio Days to Sell 74 15.58% Average Price Median Price $657,375 $625,000 154 Ratio of Sales vs Inventory 18.39% Totals include variables in any given month, due to preceding month's collapsed sales and deleted listings. e & oe
  • 26.
    6 Comparative Activity --Listing Information Shuswap / Revelstoke Statistics -- December 2022 Description Cur Mo Lst Yr Mo Incr/Decr% Cur YTD Lst YTD Incr/Decr% Cur Mo Lst Yr Mo Incr/Decr% Inventory Zone = Shuswap / Revelstoke Acreage/House 3 4 -25.00% 197 193 2.07 52 31 67.74 Duplex 0 0 0.00% 20 11 81.82 5 1 400.00 Mobile Home 5 8 -37.50% 136 130 4.62 23 20 15.00 Recreational 1 2 -50.00% 80 78 2.56 10 17 -41.18 Residential 18 23 -21.74% 940 752 25.00 154 74 108.11 Residential WF 1 3 -66.67% 96 98 -2.04 12 14 -14.29 3/4-Plex 0 0 0.00% 0 2 -100.00 Apartment 5 13 -61.54% 123 134 -8.21 32 26 23.08 Townhouse 5 2 150.00% 119 121 -1.65 18 9 100.00 RES TOTAL 38 55.00 -30.91% 1,711 1,519 12.64% 306 192 59.38 FARMS 0 0 0.00% 14 15 -6.67 3 5 -40.00 MULTIFAMILY 0 0 0.00% 3 5 -40.00 1 Acreage 3 1 200.00% 68 82 -17.07 19 17 11.76 Acreage WF 0 0 0.00% 9 25 -64.00 3 4 -25.00 Lots 10 11 -9.09% 310 314 -1.27 108 54 100.00 Lots WF 0 0 0.00% 26 24 8.33 6 5 20.00 LOTS TOTAL 136 13 12.00 8.33% 413 445 -7.19% 80 70.00 Business 1 1 0.00% 25 21 19.05 12 9 33.33 Commercial 4 5 -20.00% 62 72 -13.89 30 36 -16.67 Land 3 1 200.00% 35 25 40.00 22 10 120.00 COMM TOTAL 64 8 7.00 14.29% 122 118 3.39% 55 16.36 59 GRAND TOTAL 74 2,263 2,102 -20.27% 7.66% 510 332 53.61 Totals include variables in any given month, due to preceding month's collapsed sales and deleted listings. e & oe
  • 27.
    7 Comparative Activity --Sales Information (Month) Shuswap / Revelstoke Statistics -- December 2022 Description Cur Mo Lst Yr Mo Incr/Decr% Cur Mo Lst Yr Mo Incr/Decr% Cur Mo Lst Yr Mo Zone = Shuswap / Revelstoke Unit Sales Sales Volume List/Sale Ratio Acreage/House 4 10 -60.00% $11,072,500 $2,625,000 -76.29% 97.45% 95.63% Duplex 0 0 0.00% $0 $0 0.00% 0.00% 0.00% Mobile Home 6 4 50.00% $1,120,500 $1,337,950 19.41% 92.45% 97.60% Recreational 1 3 -66.67% $570,700 $90,000 -84.23% 94.74% 77.28% Residential 24 28 -14.29% $21,588,600 $15,777,000 -26.92% 94.96% 97.32% Residential WF 1 2 -50.00% $2,025,000 $1,015,000 -49.88% 96.67% 94.71% 3/4-Plex 0 0 0.00% $0 $0 0.00% 0.00% 0.00% Apartment 8 5 60.00% $2,191,000 $3,995,000 82.34% 94.80% 97.77% Townhouse 4 1 300.00% $840,000 $2,315,000 175.60% 96.58% 95.56% RES TOTAL 48 53 -9.43% -31.09% $27,154,950 $39,408,300 95.24% 96.34% FARMS 0 0 0.00% $0 $0 0.00% 0.00% 0.00% MULTIFAMILY 0 0 0.00% $0 $0 0.00% 0.00% 0.00% Acreage 1 1 0.00% $278,800 $337,500 21.05% 96.46% 96.14% Acreage WF 0 0 0.00% $0 $0 0.00% 0.00% 0.00% Lots 3 10 -70.00% $1,522,500 $746,000 -51.00% 94.07% 98.30% Lots WF 1 0 0.00% $0 $191,000 0.00% 98.00% 0.00% LOTS TOTAL 5 11 -54.55% -29.25% $1,274,500 $1,801,300 95.27% 97.96% Business 1 1 0.00% $250,000 $1,340,000 436.00% 89.99% 100.00% Commercial 0 3 -100.00% $3,425,009 $0 -100.00% 0.00% 110.84% Land 0 2 -100.00% $2,045,000 $0 -100.00% 0.00% 99.80% COMM TOTAL 1 6 -83.33% -76.57% $1,340,000 $5,720,009 89.99% 106.14% 54 GRAND TOTAL 70 -22.86% $29,769,450 $46,929,609 -36.57% 94.99% 97.50% Totals include variables in any given month, due to preceding month's collapsed sales and deleted listings. e & oe
  • 28.
    8 Comparative Activity --Sales Information (YTD) Shuswap / Revelstoke Statistics -- December 2022 Description Cur YTD Lst YTD Incr/Decr% Cur YTD Lst YTD Incr/Decr% Cur YTD Lst YTD Zone = Shuswap / Revelstoke Unit Sales Sales Volume List/Sale Ratio Acreage/House 82 142 -42.25% $125,718,862 $86,923,200 -30.86% 97.28% 97.32% Duplex 10 11 -9.09% $6,026,000 $6,988,999 15.98% 97.01% 98.86% Mobile Home 99 105 -5.71% $20,794,243 $24,510,535 17.87% 95.67% 97.94% Recreational 46 56 -17.86% $9,932,676 $8,047,462 -18.98% 96.73% 95.02% Residential 512 631 -18.86% $416,424,633 $375,462,403 -9.84% 98.19% 99.06% Residential WF 52 70 -25.71% $80,075,250 $67,869,923 -15.24% 95.34% 95.46% 3/4-Plex 0 2 -100.00% $1,797,000 $0 -100.00% 0.00% 101.30% Apartment 77 117 -34.19% $49,957,780 $38,627,948 -22.68% 97.90% 98.35% Townhouse 81 120 -32.50% $55,929,239 $42,631,472 -23.78% 98.68% 98.74% RES TOTAL 959 1,254 -23.52% -15.08% $651,061,942 $766,655,684 97.65% 98.23% FARMS 1 3 -66.67% $2,011,500 $2,400,000 19.31% 92.31% 101.09% MULTIFAMILY 1 5 -80.00% $6,370,000 $675,000 -89.40% 68.18% 93.42% Acreage 37 71 -47.89% $23,122,300 $15,703,561 -32.08% 93.05% 95.59% Acreage WF 5 12 -58.33% $8,224,000 $3,769,000 -54.17% 91.66% 96.35% Lots 163 293 -44.37% $43,595,200 $33,419,988 -23.34% 97.57% 96.87% Lots WF 11 14 -21.43% $5,250,000 $4,375,000 -16.67% 92.50% 94.39% LOTS TOTAL 216 390 -44.62% -28.59% $57,267,549 $80,191,500 95.49% 96.28% Business 5 5 0.00% $6,324,000 $4,542,000 -28.18% 95.99% 95.15% Commercial 11 31 -64.52% $25,332,978 $7,246,326 -71.40% 94.51% 93.84% Land 3 16 -81.25% $13,881,800 $3,434,705 -75.26% 95.07% 94.79% COMM TOTAL 19 52 -63.46% -66.57% $15,223,031 $45,538,778 95.07% 94.31% 1,196 GRAND TOTAL 1,704 -29.81% $726,627,522 $900,767,462 -19.33% 97.36% 97.82% Totals include variables in any given month, due to preceding month's collapsed sales and deleted listings. e & oe
  • 29.
    9 Average/Median price, Daysto Sell (Month) Shuswap / Revelstoke Statistics -- December 2022 Description Cur Mo Lst Yr Mo Incr/Decr% Cur Mo Lst Yr Mo Incr/Decr% Cur Mo Lst Yr Mo Zone = Shuswap / Revelstoke Average Price Median Price Days to Sell Incr/Decr% Acreage/House $656,250 $1,107,250 $660,000 $1,005,000 54 92 -40.73% -34.33% -41.38% Duplex Mobile Home $222,992 $280,125 $193,225 $280,750 68 49 -20.40% -31.18% 40.89% Recreational $90,000 $190,233 $90,000 $103,000 118 97 -52.69% -12.62% 21.23% Residential $657,375 $771,021 $625,000 $712,250 74 72 -14.74% -12.25% 2.93% Residential WF $1,015,000 $1,012,500 $1,015,000 $1,012,500 109 96 0.25% 0.25% 13.54% 3/4-Plex Apartment $499,375 $438,200 $487,500 $285,000 65 27 13.96% 71.05% 135.40% Townhouse $578,750 $840,000 $523,000 $840,000 100 14 -31.10% -37.74% 610.71% RES TOTAL $565,728 $743,553 $565,000 $697,500 74 71 -23.92% -19.00% 4.06% FARMS MULTIFAMILY Acreage $337,500 $278,800 $337,500 $278,800 25 105 21.05% 21.05% -76.19% Acreage WF Lots $248,667 $152,250 $228,000 $107,500 121 58 63.33% 112.09% 109.34% Lots WF $191,000 $191,000 63 LOTS TOTAL $254,900 $163,755 $228,000 $150,000 90 62 55.66% 52.00% 45.27% Business $1,340,000 $250,000 $1,340,000 $250,000 254 81 436.00% 436.00% 213.58% Commercial $1,141,670 $1,525,000 94 Land $1,022,500 $1,022,500 38 COMM TOTAL $1,340,000 $953,335 $1,340,000 $947,500 254 73 40.56% 41.42% 247.95% GRAND TOTAL $551,286 $555,000 $670,423 $576,200 79 70 -17.77% -3.68% 12.81% Totals include variables in any given month, due to preceding month's collapsed sales and deleted listings. e & oe
  • 30.
    10 Average/Median price, Daysto Sell (YTD) Shuswap / Revelstoke Statistics -- December 2022 Description Cur YTD Lst YTD Incr/Decr% Cur YTD Lst YTD Incr/Decr% Cur YTD Lst YTD Zone = Shuswap / Revelstoke Average Price Median Price Days to Sell Incr/Decr% Acreage/House $1,060,039 $885,344 $949,500 $832,500 76 79 19.73% 14.05% -3.79% Duplex $698,900 $547,818 $717,500 $510,000 87 150 27.58% 40.69% -42.06% Mobile Home $247,581 $198,040 $230,000 $192,000 56 51 25.02% 19.79% 10.02% Recreational $174,945 $177,369 $147,500 $131,200 87 78 -1.37% 12.42% 11.45% Residential $733,325 $659,944 $695,000 $624,000 52 49 11.12% 11.38% 6.50% Residential WF $1,305,191 $1,143,932 $1,148,500 $1,064,500 71 78 14.10% 7.89% -9.56% 3/4-Plex $898,500 $898,500 28 Apartment $501,662 $426,990 $450,000 $350,000 51 73 17.49% 28.57% -29.95% Townhouse $526,314 $466,077 $481,250 $435,000 45 66 12.92% 10.63% -31.50% RES TOTAL $678,897 $611,368 $625,000 $560,000 57 60 11.05% 11.61% -5.36% FARMS $2,400,000 $670,500 $2,400,000 $826,500 528 62 257.94% 190.38% 756.22% MULTIFAMILY $675,000 $1,274,000 $675,000 $1,250,000 84 72 -47.02% -46.00% 16.67% Acreage $424,421 $325,666 $275,000 $252,000 97 142 30.32% 9.13% -32.13% Acreage WF $753,800 $685,333 $640,000 $372,500 84 172 9.99% 71.81% -51.21% Lots $205,031 $148,789 $149,000 $120,000 73 122 37.80% 24.17% -39.97% Lots WF $397,727 $375,000 $214,500 $244,500 69 106 6.06% -12.27% -34.95% LOTS TOTAL $265,128 $205,619 $169,500 $139,000 77 127 28.94% 21.94% -39.00% Business $908,400 $1,264,800 $900,000 $1,875,000 153 245 -28.18% -52.00% -37.71% Commercial $658,757 $817,193 $460,000 $560,000 117 183 -19.39% -17.86% -35.70% Land $1,144,902 $867,613 $1,559,705 $593,500 417 221 31.96% 162.80% 88.53% COMM TOTAL $801,212 $875,746 $750,000 $592,000 174 201 -8.51% 26.69% -13.23% GRAND TOTAL $607,548 $560,000 $528,619 $467,000 63 80 14.93% 19.91% -21.11% Totals include variables in any given month, due to preceding month's collapsed sales and deleted listings. e & oe