Download as PDF, PPTX


![Contact
• yubin [at] accordionhealth [dot] com
32](https://image.slidesharecdn.com/treeshealthcare-160411195903/85/Healthcare-Data-Analytics-with-Extreme-Tree-Models-32-320.jpg)

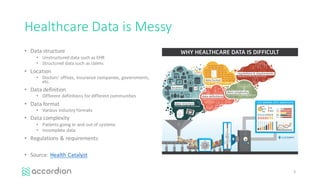
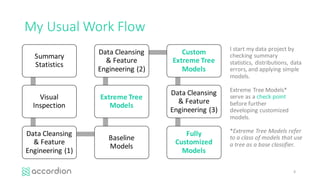
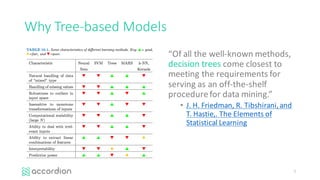
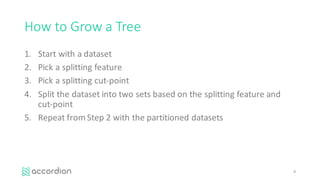
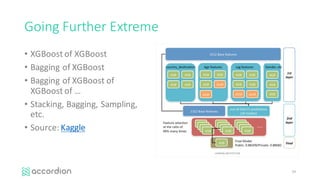
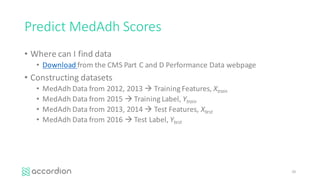
This document introduces healthcare data analytics using extreme tree models, authored by Yubin Park, CTO of Accordion Health, which specializes in lowering healthcare costs and improving quality. It discusses the workflow of data analysis, the significance of tree-based models in data mining, and various techniques including boosting and gradient boosting specifically with XGBoost for predicting healthcare outcomes like medication adherence scores. Furthermore, it emphasizes the challenges of messy healthcare data and presents practical examples of model performance and comparisons.


