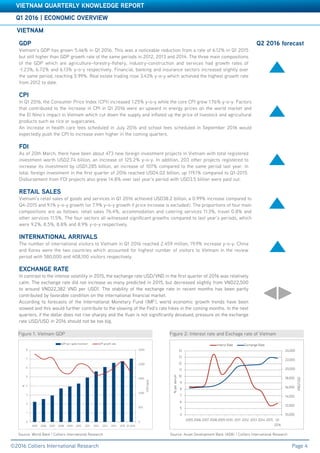
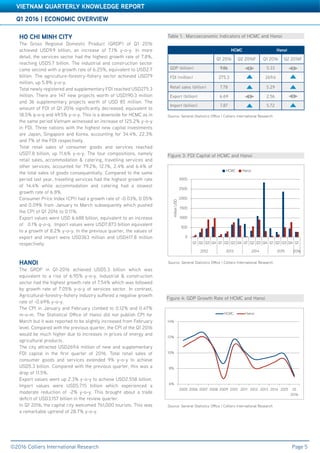
SlideShare a Scribd company logo
Accelerating success
www.colliers.com/vietnam
HO CHI MINH CITY
QUARTERLY KNOWLEDGE REPORT
Q1 2016
TABLE OF CONTENTS			
											
ECONOMIC OVERVIEW...............................................................................................................	
	 VIETNAM ....................................................................................................................................
	 HO CHI MINH CITY ......................................................................................................................
	 HA NOI ........................................................................................................................................
	
HO CHI MINH CITY MARKET OVERVIEW ........................................................................
	 OFFICE ........................................................................................................................................
	RETAIL ........................................................................................................................................
	CONDOMINIUM ............................................................................................................................
	 VILLA & TOWNHOUSE .................................................................................................................
	 SERVICED APARTMENT ..............................................................................................................	
	INDUSTRIAL ................................................................................................................................
Cover Page: Saigon Skyline
4-5
4
5
5
6-18
6
9
11
13
15
17
Page
LIST OF FIGURES										
	 Figure 1: Vietnam GDP .....................................................................................................................
	 Figure 2: Interest Rate and Exchange Rate of Vietnam ......................................................................
	 Figure 3: FDI Capital of HCMC and Hanoi ..........................................................................................
	 Figure 4: GDP Growth Rate of HCMC and Hanoi ................................................................................
HO CHI MINH CITY MARKET OVERVIEW
	 Figure 5: Office, Net Absorption .........................................................................................................
	 Figure 6: Office, Occupancy Rate .......................................................................................................
	 Figure 7: Retail, Market Performance...................................................................................................
	 Figure 8: Retail, Average Asking Rent ................................................................................................
	 Figure 9: Retail, Supply by District ...................................................................................................
	 Figure 10: Condominium, Sold Units...................................................................................................
	 Figure 11: Condominium, Average Asking Rent by Segment ................................................................
	 Figure 12: Condominium, Q-o-Q and Y-o-Y Changes in Asking Price ..................................................
	 Figure 13: Villa and Townhouse, Supply by Year .................................................................................
	 Figure 14: Villa and Townhouse, Current Supply by District ................................................................
	 Figure 15 Villa and Townhouse, Changes in Asking Price.....................................................................
	 Figure 16: Serviced Apartment, Current Grade A&B Supply ................................................................
	 Figure 17: Serviced Apartment, Average Asking Rent by Grade ...........................................................
	 Figure 18: Industrial, Net Absorption ..................................................................................................
	 Figure 19: Industrial, Supply by District ..............................................................................................
LIST OF TABLES
	 Table 1: Macroeconomic Indicators of HCMC and Hanoi ......................................................................
	 Table 2: Office, Future Supply ............................................................................................................
	 Table 3: Significant Office Projects ....................................................................................................
	 Table 4: Significant Retail Projects ....................................................................................................
	 Table 5: Condominium, Significant new Projects launched in Q1 2016 ................................................
	 Table 6: Villa and Townhouse, Significant new Projects launched in Q1 2016 ......................................
	 Table 7: Serviced Apartment, Significant Future Projects under construction ......................................
	 Table 8: Significant Serviced Apartment Projects ...............................................................................
	 Table 9: Industrial, Future Supply .......................................................................................................
	 Table 10: Industrial, Market Overview ................................................................................................
4
4
5
5
6
6
9
9
9
11
11
11
13
13
13
15
15
17
17
5
6
7
10
12
14
15
16
17
18
Page
GDP
Vietnam’s GDP has grown 5.46% in Q1 2016. This was a noticeable reduction from a rate of 6.12% in Q1 2015
but still higher than GDP growth rate of the same periods in 2012, 2013 and 2014. The three main compositions
of the GDP which are agriculture–forestry-fishery, industry-construction and services had growth rates of
-1.23%, 6.72% and 6.13% y-o-y respectively. Financial, banking and insurance sectors increased slightly over
the same period, reaching 5.99%. Real estate trading rose 3.43% y-o-y which achieved the highest growth rate
from 2012 to date.
CPI
In Q1 2016, the Consumer Price Index (CPI) increased 1.25% y-o-y while the core CPI grew 1.76% y-o-y. Factors
that contributed to the increase in CPI in Q1 2016 were an upward in energy prices on the world market and
the El Nino’s impact in Vietnam which cut down the supply and inflated up the price of livestock and agricultural
products such as rice or sugarcanes.
An increase in health care fees scheduled in July 2016 and school fees scheduled in September 2016 would
expectedly push the CPI to increase even higher in the coming quarters.
FDI
As of 20th March, there have been about 473 new foreign investment projects in Vietnam with total registered
investment worth USD2.74 billion, an increase of 125.2% y-o-y. In addition, 203 other projects registered to
increase its investment by USD1.285 billion, an increase of 107% compared to the same period last year. In
total, foreign investment in the first quarter of 2016 reached USD4.02 billion, up 119.1% compared to Q1-2015.
Disbursement from FDI projects also grew 14.8% over last year’s period with USD3.5 billion were paid out.
RETAIL SALES
Vietnam’s retail sales of goods and services in Q1 2016 achieved USD38.2 billion, a 0.99% increase compared to
Q4-2015 and 9.1% y-o-y growth (or 7.9% y-o-y growth if price increase is excluded). The proportions of four main
compositions are as follows: retail sales 76.4%, accommodation and catering services 11.3%, travel 0.8% and
other services 11.5%. The four sectors all witnessed significant growths compared to last year’s periods, which
were 9.2%, 8.5%, 8.8% and 8.9% y-o-y respectively.
INTERNATIONAL ARRIVALS
The number of international visitors to Vietnam in Q1 2016 reached 2.459 million, 19.9% increase y-o-y. China
and Korea were the two countries which accounted for highest number of visitors to Vietnam in the review
period with 580,000 and 408,100 visitors respectively.
EXCHANGE RATE
In contrast to the intense volatility in 2015, the exchange rate USD/VND in the first quarter of 2016 was relatively
calm. The exchange rate did not increase as many predicted in 2015, but decreased slightly from VND22,500
to around VND22,382 VND per USD1. The stability of the exchange rate in recent months has been partly
contributed by favorable condition on the international financial market.
According to forecasts of the International Monetary Fund (IMF), world economic growth trends have been
slowed and this would further contribute to the slowing of the Fed’s rate hikes in the coming months. In the next
quarters, if the dollar does not rise sharply and the Yuan is not significantly devalued, pressure on the exchange
rate USD/USD in 2016 should not be too big.
Q1 2016 | ECONOMIC OVERVIEW
©2016 Colliers International Research
VIETNAM QUARTERLY KNOWLEDGE REPORT
Page 4
Q2 2016 forecast
Figure 1: Vietnam GDP
Source: World Bank | Colliers International Research
Figure 2: Interest rate and Exchage rate of Vietnam
Source: Asian Development Bank (ADB) | Colliers International Research
VIETNAM
0
500
1,000
1,500
2,000
2,500
0
1
2
3
4
5
6
7
8
2005 2006 2007 2008 2009 2010 2011 2012 2013 2014 2015 Q1 2016
USD/capita
%
GDP per capita (nominal) GDP growth rate
10,000
12,000
14,000
16,000
18,000
20,000
22,000
24,000
4
5
6
7
8
9
10
11
12
13
14
2005 2006 2007 2008 2009 2010 2011 2012 2013 2014 2015 Q1
2016
VND/USD
%perannum
Interst Rate Exchange Rate
Q1 2016 | ECONOMIC OVERVIEW
©2016 Colliers International Research
VIETNAM QUARTERLY KNOWLEDGE REPORT
Page 5
Figure 4: GDP Growth Rate of HCMC and Hanoi
Source: General Statistics Office | Colliers International Research
Table 1: Marcoeconomic Indicators of HCMC and Hanoi
HCMC Hanoi
Q1 2016 Q2 2016F Q1 2016 Q2 2016F
GDP (billion) 9.86 5.33
FDI (million) 275.3 269.6
Retail sales (billion) 7.78 5.29
Export (billion) 6.69 2.56
Import (billion) 7.87 5.72
HO CHI MINH CITY
The Gross Regional Domestic Product (GRDP) of Q1 2016
achieved USD9.9 billion, an increase of 7.1% y-o-y. In more
detail, the services sector had the highest growth rate of 7.8%,
reaching USD5.7 billion. The industrial and construction sector
came second with a growth rate of 6.25%, equivalent to USD2.7
billion. The agriculture-forestry-fishery sector achieved USD79
million, up 5.8% y-o-y.
Total newly registered and supplementary FDI reached USD275.3
million. There are 147 new projects worth of USD190.3 million
and 36 supplementary projects worth of USD 85 million. The
amount of FDI of Q1 2016 significantly decreased, equivalent to
18.5% q-o-q and 49.5% y-o-y. This is a downside for HCMC as in
the same period Vietnam witnessed an increase of 125.2% y-o-y
in FDI. Three nations with the highest new capital investments
are Japan, Singapore and Korea, accounting for 34.4%, 22.3%
and 7% of the FDI respectively.
Total retail sales of consumer goods and services reached
USD7.8 billion, up 11.6% y-o-y. The four compositions, namely
retail sales, accommodation & catering, travelling services and
other services, accounted for 79.2%, 12.1%, 2.4% and 6.4% of
the total sales of goods consequentially. Compared to the same
period last year, travelling services had the highest growth rate
of 14.4% while accommodation and catering had a slowest
growth rate of 6.8%.
Consumer Price Index (CPI) had a growth rate of -0.03%, 0.05%
and 0.09% from January to March subsequently which pushed
the CPI of Q1 2016 to 0.11%. 	
Export values were USD 6.688 billion, equivalent to an increase
of 0.1% q-o-q. Import values were USD7.873 billion equivalent
to a growth of 8.2% y-o-y. In the previous quarter, the values of
export and import were USD363 million and USD417.8 million
respectively.
HANOI
The GRDP in Q1-2016 achieved USD5.3 billion which was
equivalent to a rise of 6.95% y-o-y. Industrial & construction
sector had the highest growth rate of 7.54% which was followed
by growth rate of 7.05% y-o-y of services sector. In contrast,
Agricultural-forestry-fishery industry suffered a negative growth
rate of -0.69% y-o-y.
The CPI in January and February climbed to 0.12% and 0.47%
m-o-m. The Statistical Office of Hanoi did not publish CPI for
March but it was reported to be slightly increased from February
level. Compared with the previous quarter, the CPI of the Q1 2016
would be much higher due to increases in prices of energy and
agricultural products.
The city attracted USD269.6 million of new and supplementary
FDI capital in the first quarter of 2016. Total retail sales of
consumer goods and services extended 9% y-o-y to achieve
USD5.3 billion. Compared with the previous quarter, this was a
drop of 11.5%.
Export values went up 2.3% y-o-y to achieve USD2.558 billion.
Import values were USD5.715 billion which experienced a
moderate reduction of -2% y-o-y. This brought about a trade
deficit of USD3.157 billion in the review quarter.
In Q1 2016, the capital city welcomed 761,000 tourists. This was
a remarkable uptrend of 28.7% y-o-y.
Figure 3: FDI Capital of HCMC and Hanoi
Source: General Statistics Office | Colliers International Research
6%
8%
10%
12%
14%
2005 2006 2007 2008 2009 2010 2011 2012 2013 2014 2015 Q1
2016
HCMC Hanoi
0
500
1000
1500
2000
2500
3000
Q1 Q2 Q3 Q4 Q1 Q2 Q3 Q4 Q1 Q2 Q3 Q4 Q1 Q2 Q3 Q4 Q1
2012 2013 2014 2015 2016
millionUSD
HCMC Hanoi
Figure 6: Office, Occupancy Rate
PERFORMANCE
Rental growth across all grades was recorded in the review
quarter. Grade A’s average net asking rents increased 1.92%
q-o-q, staying at USD40.5/sqm/month while those of Grade B
surged 5.1% q-o-q, reaching USD22.07/sqm/month.
Average occupancy rate witnessed downward trend over the
quarter but maintained at a high rate of 93.4%. Grade A and
Grade B’s occupied rate were 92.3% and 94.8%, down 3.1% and
1.86% q-o-q respectively.
SUPPLY
No new office building entered the market in the first quarter of
2016. The supply pipeline remained stable with 11 Grade A and
57 Grade B office buildings, providing approximately 1,331,347
sqm GFA.
Grade B will domininate new supply in the next quarters with
nearly 77,000sqm NLA from 4 projects. Despite having no
additional buildings this year, Grade A stock will grow substantially
in the next two years. By the end of 2018, the market is expected
to welcome 4 more Grade A office buildings which are Deutsches
Haus, Saigon Centre (Phase 2), Saigon One Tower and The One,
providing nearly 172,859sqm NLA.
DEMAND
As a result of stronger FDI inflow to the city, the growing number
of foreign enterprises will continue to drive office demand. This
type of tenants would have distinctive enquiries such as green
buildings with good access to natural light and energy efficiency,
contiguous floor plates of larger than 1,000 sqm, prime locations
with accessibility to public transport and staff amenity or close
proximity to clients and brand profile. Landlords should be
strategic to statisfy sophisticated leasing requirements from
clients.
OUTLOOK
As there is a current drought of premium office stock, landlords
are gaining confidence in offering higher rents and pushing back
incentives. High quality assets are expected to achieve a rent
growth up to 10%.
With prime locations and in close proximity of traffic hubs, CBD
office buildings continue to be highly sought-after. Decentralised
districts with well-established infrastructure and traffic system
such as District 7 and Thu Thiem new urban area will become
alternative options for tenants looking for large contiguous floor
plates.
Q1 2016 | HO CHI MINH CITY | OFFICE
©2016 Colliers International Research
VIETNAM QUARTERLY KNOWLEDGE REPORT
Page 6
Table 2: Office, Future Supply
Source: Colliers International Research
Figure 5: Office, Net Absorption
-10,000 0 10,000 20,000 30,000 40,000
Q1
Q3
Q1
Q3
Q1
Q3
Q1
201320142015
20
16
sq m
Grade B Grade A
0
10
20
30
40
50
60
70
80
90
100
Q1 Q2 Q3 Q4 Q1 Q2 Q3 Q4 Q1 Q2 Q3 Q4 Q1 Q2 Q3 Q4 Q1 Q2 Q3 Q4 Q1
2011 2012 2013 2014 2015 2016
Grade A Grade B%
Project name Grade NLA sqm
Expected
Completion
Hai Quan Tower A 30,000 2016
SGGP Building B 16,940 2016
HQC Royal Tower B 22,500 2016
Deutsches Haus A 24,900 2017
Saigon Center Phase 2 A 40,000 2017
Mapletree Business Center B 30,000 2017
E-Town Central B 34,000 2017
Q1 2016 | HO CHI MINH CITY | OFFICE
©2016 Colliers International Research
VIETNAM QUARTERLY KNOWLEDGE REPORT
Page 7
(*) US$/sqm/month (NLA)
Table 3: Significant Office Projects
No Name Address
Completion
Year
NLA
(sqm)
Service
Charges (*)
Occupancy
rate
Average
asking rent
(**)
1 Saigon Centre 65 Le Loi 1996 11,650 9.0 99% 45.0
2 Saigon Tower 29 Le Duan 1997 13,950 8.0 99% 46.0
3 Sunwah Tower 115 Nguyen Hue 1997 20,800 8.0 98% 48.0
4 The Metropolitan 235 Dong Khoi 1997 15,200 8.0 90% 47.0
5 Diamond Plaza 34 Le Duan 1999 15,936 8.0 77% 45.0
6 Kumho Asiana Plaza 39 Le Duan 2009 26,000 8.0 89% 43.0
7 Bitexco Financial Tower 45 Ngo Duc Ke 2010 37,710 8.0 96% 34.0
8 President Place 93 Nguyen Du 2012 8,330 7.0 98% 42.0
9 Times Square 22-36 Nguyen Hue 2012 12,704 7.0 72% 40.0
10 Le Meridien 3C Ton Duc Thang 2013 9,125 6.0 94% 29.0
11 Vietcombank Tower 5 Me Linh Square 2015 41,250 7.0 95% 37.0
Grade A 212,655 7.7 92.3% 40.5
1 VTP-OSIC 8 Nguyen Hue 1993 6,500 6.5 98% 25.0
2 Yo Co Building 41 Nguyen Thi Minh Khai 1995 5,000 3.0 100% 23.0
3 Somerset Chancellor Court 21-23 NguyenThi Minh Khai 1996 3,200 5.0 100% 22.0
4 Central Plaza 17 Le Duan 1997 6,094 6.5 93% 24.0
5 Harbour View Tower 35 Nguyen Hue 1997 8,000 5.0 77% 20.0
6 Saigon Riverside Office 2A-4A Ton Duc Thang 1997 10,000 5.0 100% 28.0
7 Saigon Trade Center 37 Ton Duc Thang 1997 31,416 6.5 71% 24.0
8 MeLinh Point Tower 2 Ngo Duc Ke 1999 17,600 6.0 99% 27.0
9 Zen Plaza 54-56 Nguyen Trai 2001 11,037 7.0 86% 29.0
10 Bitexco Building 19-25 Nguyen Hue 2003 6,000 6.0 92% 27.0
11 The Landmark 5B Ton Duc Thang 2005 8,000 8.0 100% 27.0
12 Opera View 161-167 Dong Khoi 2006 3,100 7.0 100% 27.0
13 City Light 45 Vo Thi Sau 2007 10,000 5.0 100% 19.0
14 Petro Tower 1-5 Le Duan 2007 13,304 9.0 94% 35.0
15 The Lancaster 22 – 22 Bis Le Thanh Ton 2007 7,000 5.0 90% 25.0
16 CJ Building 5 Le Thanh Ton 2008 14,000 8.0 97% 29.0
17 Continential Tower 81-85 Ham Nghi 2008 15,000 6.0 98% 22.0
18 Havana Tower 132 Ham Nghi 2008 7,326 8.0 81% 31.0
19 Royal Center 235 Nguyen Van Cu 2008 14,320 6.0 100% 23.0
20 Sailing Tower 51 Nguyen Thi Minh Khai 2008 16,910 6.0 100% 26.0
21 TMS 172 Hai Ba Trung 2009 4,000 4.0 100% 24.0
22 A&B Tower 76 Le Lai 2010 17,120 6.0 95% 29.0
23 Bao Viet Tower 233 Dong Khoi 2010 10,650 5.0 100% 22.0
24 Green Power Tower 35 Ton Duc Thang 2010 15,600 6.0 99% 25.0
25 Maritime Bank Tower 192 Nguyen Cong Tru 2010 19,596 5.0 84% 22.0
26 Saigon Royal 91 Pasteur 2010 5,340 6.0 100% 23.0
27 Vincom Center 68 -70 -72 Le Thanh Ton 2010 56,600 7.0 94% 32.0
28 Empress Tower 138 Hai Ba Trung 2012 19,538 6.0 100% 30.0
29 Lim Tower 9-11 Ton Duc Thang 2013 22,000 6.0 99% 28.0
30 MB Sunny Tower 259 Tran Hung Dao, Co Giang 2013 13,200 6.0 99% 23.0
31 Lim Tower 2 Vo Van Tan 2015 8,400 5.5 100% 24.0
Grade B 405,851 6.2 93.8% 26.6
Q1 2016 | HO CHI MINH CITY | OFFICE
©2016 Colliers International Research
VIETNAM QUARTERLY KNOWLEDGE REPORT
Page 8
SAIGON SKYLINE REVIEW- CBD HCMC GRADE A OFFICE BUILDINGS
KUMHO ASIANA PLAZA
39 Le Duan, District 1
26,000/1,402
$ 43.00
$ 8.00
DIAMOND PLAZA SAIGON
34 Le Duan, District 1
15,936/2,200
$ 45.00
$ 8.00
LE MERIDIEN
3C Ton Duc Thang, District 1
9,125/NA
$ 29.00
$6.00
SAIGON TOWER
29 Le Duan, District 1
13,950/NA
$ 46.00
$ 8.00
DEUTSCHES HAUS
3-5 Le Van Huu, District 1
THE METROPOLITAN
235 Dong Khoi, District 1
15,200/1,000
$ 47.00
$ 8.00
PRESIDENT PLACE
93 Nguyen Du, District 1
8,330/1,000
$ 42.00
$ 7.00
BITEXCO FINANCIAL TOWER
45 Ngo Duc Ke, District 1
37,710/900-1,300
$ 34.00
$ 8.00
VIETCOMBANK TOWER
5 Me Linh Square, District 1
41,250/NA
$ 37.00
$ 7.00
TIMES SQUARE SAIGON
22-36 Nguyen Hue, District 1
12,704/1,450
$ 40.00
$ 7.00
SAIGON CENTRE
65 Le Loi, District 1
11,650/ 1,073
$ 45.00
$ 9.00
SUNWAH TOWER
115 Nguyen Hue, District 1
20,800/ 1,166
$ 48.00
$ 8.00
Q1 2016 | HO CHI MINH CITY | RETAIL
©2016 Colliers International Research
VIETNAM QUARTERLY KNOWLEDGE REPORT
Page 9
Figure 9: Retail, Total supply
PERFORMANCE
Lower rental rate in suburban areas resulted in a drop of 2%
q-o-q and 10% y-o-y in the average net asking rent across all
segments. Department stores and retail podiums maintained
their rents while shopping centers was down 3% q-o-q in rents,
averaging at USD44/sqm/month.
Average occupancy rate decreased 1.5% q-o-q, staying at 91.6%
as some newly-opened retail projects have not fill up their
vacant space.
SUPPLY
Three new shopping centers in suburban area have come online
The retail stock increased 65,400sqm NLA with the opening of
two new shopping centers in suburban districts.
Vingroup has made all efforts to expand their retail network in
every district in Ho Chi Minh City. While Vincom Le Van Viet
marks Vingroup’s first presence in District 9, Vincom Plaza Go
Vap is their second retail project in the highly-populated Go Vap
District. To date, they have owned 6 retail properties across the
city, providing more than 200,000sqm NLA.
DEMAND
Food and beverage (F&B) tenants is expected to be the main
driver that will support the performance of HCMC’s retail market
in the short to medium term.
McDonald, Starbucks, Subway, KFC and Burger King are a few
international names that are growing their empires in the local
market. These retailers tend to sercure prime locations in a
retail center to easily catch the eyes of customers and lower the
chance of their competitors.
OUTLOOK
The supply pipeline of shopping malls will grow bigger when
Saigon Center Phase II and Aeon Mall Binh Tan will come online
in the next quarters of 2016. The two new shopping centers will
bring more foreign brands to the local market, creating intense
competition between Vietnam and international retailers. Given
abundant new supply, low quality retail properties need to be
repositioning to avoid downtrend in rents and occupancy rates.
Figure 8: Retail, Average Asking rent
Source: Colliers International Research
Figure 7: Retail, Market performance
Source: Colliers International Research
13 21 14
0
50
100
150
200
250
300
350
Retail Podium Department Store Shopping Centre
USD/sqm/month
Min average asking rent Max average asking rent
0
10
20
30
40
50
60
70
80
90
100
90%
92%
94%
96%
98%
100%
Podium Department store Shopping centre
USD/sqm/month
Average asking rent Average occupancy
0
100,000
200,000
300,000
400,000
500,000
600,000
700,000
800,000
2010 2011 2012 2013 2014 2015 2016YTD
NLA(sqm)
Q1 2016 | HO CHI MINH CITY | RETAIL
VIETNAM QUARTERLY KNOWLEDGE REPORT
©2016 Colliers International Research Page 10	
Table 3: Significant Office Projects
(*) ARR (Average Rental Rate): All rents are stated in net rents per sqm, inclusive service charge but exculding VAT
Table 4: Significant Retail Projects
No Name of Project/Building Address Location
Completion
Year
NLA
(sq m)
ARR (*)
Occupancy
Rate
1 Hotel Continental Sai Gon 132-134 Dong Khoi District 1 2000 200 90 100.0%
2 Caravelle Hotel 19 Lam Son Square District 1 2000 150 220 100.0%
3 New World Hotel 76 Le Lai District 1 2000 1,000 60 100.0%
4 Sheraton Saigon 88 Dong Khoi District 1 2002 750 200 100.0%
5 Opera View Lam Son Square District 1 2006 1,260 200 100.0%
6 The Manor 1 91 Nguyen Huu Canh Binh Thanh 2006 2,000 14 83.0%
7 Saigon Pearl 92 Nguyen Huu Canh Binh Thanh 2009 5,000 25 100.0%
8 Rex Arcade 141 Nguyen Hue District 1 2010 2,000 120 100.0%
9 The Manor 2 91 Nguyen Huu Canh Binh Thanh 2010 2,500 13 92.0%
10 Bitexco Financial Tower 45 Ngo Duc Ke District 1 2011 8,000 55 95.0%
11 The Vista Walk Hanoi Highway District 2 2012 10,000 13 80.0%
12 President Place 93 Nguyen Du District 1 2012 800 60 100.0%
13 Times Square 22-36 Nguyen Hue District 1 2012 9,000 300 97.0%
14 Saigon Airport Plaza 1 Bach Dang Tan Binh 2013 7,623 15 100.0%
Retail Podium 50,283 87 94.0%
1 Zen Plaza 54-56 Nguyen Trai District 1 2001 6,817 58 100.0%
2 Parkson Hung Vuong Plaza 126 Hung Vuong District 5 2007 24,000 60 99.0%
3 Kumho Asiana Plaza 35 Le Duan District 1 2009 6,830 60 100.0%
4 Parkson Flemington 184 Le Dai Hanh District 11 2009 26,000 25 90.0%
5 Parkson Paragon 3 Nguyen Luong Bang District 7 2011 7,500 40 90.0%
6 Parkson C.T Plaza 60A Truong Son Tan Binh 2012 12,235 21 95.0%
7 Parkson Cantavil Premier Hanoi Highway District 2 2013 17,815 38 97%
8 Taka Plaza 102 Nam Ky Khoi Nghia District 1 2011 1,000 70 70.0%
Department Store 102,197 41.0 95.0%
1 Diamond Plaza 34 Le Duan District 1 1999 9,000 90 100.0%
2 Parkson Saigontourist Plaza 35 Le Thanh Ton District 1 2002 17,000 90 99.0%
3 Saigon Center 35 Nam Ky Khoi Nghia District 1 1996 Renovation Renovation Renovation
4 City Plaza 102 Nam Ky Khoi Nghia District 1 2000 Renovation Renovation Renovation
5 Superbowl Vietnam TSN 38 Nguyen Hue Tan Binh 2002 5,500 20 98.0%
7 An Dong Plaza 18 An Duong Vuong District 5 2004 18,000 40 99.0%
8 Saigon Square 1 77-89 Nam Ky Khoi Nghia District 1 2006 1,300 167 100.0%
9 Nowzone 235 Nguyen Van Cu District 1 2008 9,000 55 100.0%
10 Lotte Mart Saigon South 469 Nguyen Huu Tho District 7 2008 24,000 50 100.0%
12 Vincom Center B 72 Le Thanh Ton District 1 2010 45,000 150 100.0%
13 Maximark 3/2 Extention 3/2 Street District 10 2010 25,000 35 90.0%
14 Lotte Mart Phu Tho Le Dai Hanh District 11 2010 24,500 30 99.0%
15 Crescent Mall Nguyen Van Linh District 7 2011 45,000 26 100.0%
16 Satra Pham Hung Pham Hung District 8 2011 11,528 14 100.0%
17 CMC Plaza 79B Ly Thuong Kiet Tan Binh 2011 Renovation Renovation Renovation
18 Union Square Dong Khoi District 1 2012 38,000 300 New opening
Shopping Centre 272,828 96 99.0%
Accelerating success
Q1 2016 | HO CHI MINH CITY | CONDOMINIUM
VIETNAM QUARTERLY KNOWLEDGE REPORT
©2016 Colliers International Research Page 11
Table 3: Significant Office Projects
Figure 12: Condominium, Q-o-q and Y-o-y changes in asking price
PERFORMANCE
In the first quarter of 2016, more than 9,000 units were sold
across all segments, up 3.43% y-o-y. It is forecasted that
throught out 2016, approximately 57,500 units will be available
for sale.
High-end and mid-end segments account for more than 70% of
the market share. Sale rate of mid-end segment grew 16% y-o-y
while affordable segment declined 18.9% y-o-y. In the coming
quarters, the market share of high-end segment will see more
challenge from mid-end segment.
SUPPLY
In Q1-2016, it is estimated that 12,760 new units were launched
for sale. Eastern and Southern areas account for majority of
new units supplied.
Condominium market is expected to continually increase both
in quantity and quality. Developers nowadays have to take
part in intense competitions for potential buyers. Apart from
prime location, high-end developers have come up with unique
amenities and concept such as cruise habour, waterfall infinity
pool, artificial sea or hanging gardens, while mid-end and
affordable segments have competitively provided offers such as
low construction density as well as associated public services
such as internal parks, schools and sport centers.
DEMAND
Across all segments, buyers tend to be more selective in
spending their money. Branding of a developer and its ability
in assuring a project’s quality and progress are key factors
considered by potential buyers.
Units with 1 or 2 bedrooms and price less than USD1,000/sqm
are in excessive demand from end-users. Demand for affordable
segment seems very high and is predicted to be grown steadily
in the future.
OUTLOOK
Improved infrastructure provides better connection between
areas of the city as well as shorten the distance to the CBD.
This helps to increase the demand and the price of projects in
outer city areas. In addition, the new Law on Housing which
permits foreigners to purchase up to 30% of the total number of
apartments in a residential apartment project expects to boost
sales further.
Nevertheless, condominium has one of the highest proportions
of speculation among different segments of real estate market. It
is therefore vulnerable to government policies and credit growth.
Source: Colliers International Research
Figure 10: Condominium, Sold units
Source: Colliers International Research
Figure 11: Condominium, Average asking price by segment
0
5000
10000
15000
20000
25000
30000
35000
40000
2006 2007 2008 2009 2010 2011 2012 2013 2014 2015 Q1
2016
units
0
1,000
2,000
3,000
4,000
5,000
Luxury High-end Mid-end Affordable
US$/sqm
Average primary price Average secondary price
0.0%
2.0%
4.0%
6.0%
8.0%
10.0%
Primary market Secondary market
q-o-q changes y-o-y changes
Accelerating success
Q1 2016 | HO CHI MINH CITY | CONDOMINIUM
VIETNAM QUARTERLY KNOWLEDGE REPORT
©2016 Colliers International Research Page 12
Table 5: Condominium, Significant new projects launched in Q1 2016
No Name of Project/Building Developer Location
Completion
Year
Number
of units
Asking Price
(US$/sqm)
1 9 view Apartment Hung Thinh District 9 2018 690 720
2 M-One Nam Saigon Thao Dien Investment District 7 2017 963 1,100
3 Vinhomes Park Paroma VinGroup Binh Thanh 2017 430 1,900
4 Opal Riverside Dat Xanh Group Thu Duc 2017 626 970
5 Dat Gia Residence Dat Gia Real Estate Thu Duc 2017 1,034 800
6 Vinhomes Golden River Bason VinGroup District 1 2018 3,000 4,000-5,000
7 Vinhomes Central Park - P7 VinGroup Binh Thanh 2017 893 1,600-1,800
8 Samland Riverside Sacomreal Binh Thanh 2018 138 1,300
9 Sunriver Usilk TGT District 7 2017 136 1,100
10 De Capella Quoc Cuong Gia Lai District 2 2018 380 1,400
11 The Avila Thai Bao District 8 2017 285 700
12 Xi Grand Court Phu Son Thuan District 10 2017 748 1,400
13 Kris Vue CapitaLand District 2 2018 128 1,300
14 Viva Riverside Vietcomreal District 6 2018 567 1,200
15 Scenic Valley 2 Phu My Hung District 7 2017 248 1,500
16 Luxury Home Sacomreal District 7 2018 250 1,000
17 Top Life TIEXIM District 10 2018 84 2,200
18 Sarina Dai Quang Minh District 2 2016 233 1,750
19 Madison NovaLand District 1 2018 109 5,000-6,000
20 Hung Phat Golden Star Hung Loc Phat District 7 2018 478 1,300
21 I-Home Xa Lo Ha Noi C.T Group District 9 2017 431 700
22 Botanica Premier NovaLand Tan Binh 2018 909 1,600
New launches in Q1 2016 12,760
* Excluding all kinds of tax, promotions and management fee
The information is updated as at the end of Q1 2016
Accelerating success
Q1 2016 | HO CHI MINH CITY | VILLA & TOWNHOUSE
VIETNAM QUARTERLY KNOWLEDGE REPORT
©2016 Colliers International Research Page 13
PERFORMANCE
The villa and townhouse segment performed well in Q1 2016
thanks to a warming property market and stable macroeconomic
factors. Prices continued to go up an average 1-2% q-o-q.
The transaction volume went down 24% q-o-q due to a shortage
in supply of affordable segment.
SUPPLY
Four notable projects offered 486 new villas and townhouses
to the market.
Future supply is expected to grow strongest in Eastern and
Souther areas of HCMC this year while the western area has
high potential to develop in the longer term.
DEMAND
Ho Chi Minh City is home of three million immigrants. The
city also welcomes 50,000 newly married couples every year.
Certain proportions of these people might want to settle in the
city in their own house and would become potential clients of
villa and townhouse market. Hence, the demand for the market
is maintained high and stable over years.
For mid-end and high-end segments, buyers prefer projects
with well-developed infrastructure, good traffic system and
transparent legal status. Similar to condominium market,
low-priced, small area houses in suburban seem to have
highest demand from the market.
OUTLOOK
Free trade agreements such as the TPP would bring about an
inflow of foreign investors, specialists, management teams to
Ho Chi Minh City. This, accompanied with the new Housing Law
which permits foreigners to purchase up 250 separate houses
in a project where the population is equivalent to a ward, would
expect to increase the demand for villas and townhouses.
Districts 2 and District 9 in the East, District 7 and Nha Be in
the South are forecasted to continue to dominate the market
while the Western area have high potential to grow in the future.
Figure 13: Villa and Townhouse, Supply by Year
Source: Colliers International Research
Figure 14: Villa and Townhouse, Current Supply by District
Source: Colliers International Research
Figure 15: Villa&Townhouse, Changes in asking price
Source: Colliers International Research
0.0%
1.0%
2.0%
3.0%
4.0%
5.0%
Primary market Secondary market
q-o-q changes y-o-y changes
0
200
400
600
800
Dist. 9 Dist. 2 Go
Vap
Nha
Be
Dist. 7 Binh
Thanh
Thu
Duc
Dist.
12
Binh
Tan
Binh
Chanh
dwellings
No. of townhouses No. of villas
0
1000
2000
3000
4000
5000
6000
7000
8000
2002 2003 2004 2005 2006 2007 2008 2009 2010 2011 2012 2013 2014 2015 Q1
2016
Existing supply New supply
units
Accelerating success
Q1 2016 | HO CHI MINH CITY | VILLA & TOWNHOUSE
VIETNAM QUARTERLY KNOWLEDGE REPORT
©2016 Colliers International Research Page 14
Table 6: Villa and Townhouse, Significant new projects launched in Q1 2016
No Name of Project/Building Developer Location
Completion
Year
Number
of units
Asking Price
(US$/sqm)
1 The Manera Khang Dien Tu Van Quoc Te District 9 N/A 54 1,800
2 Saroma Villa Dai Quang Minh District 2 2016 177 N/A
3 The Venica Khang Dien District 9 2016 43 500-1,500
4 Camelia Gardern Nam Long Group Binh Chanh 2016 212 1,282-1,851
New launches in Q1 2016 486
Accelerating success
Q1 2016 | HO CHI MINH CITY | SERVICED APARTMENT
VIETNAM QUARTERLY KNOWLEDGE REPORT
©2016 Colliers International Research Page 15
PERFORMANCE
Grade A’s average occupancy rate remained unchanged over
the quarter, reaching 86.4%. The average gross asking rent
recorded a drop of 2.61ppts q-o-q, staying at USD29.9/sqm/
month.
Grade B had the best performance in the review quarter.
Average occupancy rate increased to 88.2%, up 0.45ppts
while rental rate saw an improvement of 1.35ppts, averaging at
USD22.4/sqm/month.
SUPPLY
The existing stock was stable with approximately 4,100 units
from 80 projects. Due to well-establised public facilities and
amenities, the CBD is home of more than 40% of total serviced
apartments.
New supply from now until end of 2017 will grow substantially
with approximately 1,459 units. It is notable that five out of seven
significant future projects is located in District 1 and District 3.
To meet current demand from single tenants, the proportion of
one-bedroom and two-bedroom units tend to be increased in
newly launched developments.
DEMAND
Serviced apartments in the CBD are typically preferred by
professional singles due to its close proximity to their workplace.
District 2 and District 7 are attractive for expatriate families
as these two locations can provide large size accommodation
together with social amenities such as international schools,
hospitals, shopping malls, etc. It is observed that District 2 with
peaceful riverside environment is popular for Westerners while
District 7 is a hot spot for Asian community.
OUTLOOK
Demand for serviced apartments will be strengthen in the long
term after Vietnam joined Trans Pacific Partnership and Asean
Economic Community, leading to the growing number of foreign
workforce. Despite solid demand, this market segment have to
compete with buy-to-let apartments and private houses where
offering competitive rents for long-term stays.
To maintain healthy occupancy rates, landlords need to adjust
rents and consolidate their services when new completions
enter the market expatriates and MNCs.
Project name District Grade
Total
units
Expected
Completion
Sila Urban Living 3 B 217 2Q 2016
Ascott Waterfront Saigon 1 A 222 3Q 2016
Saigon Plaza 1 B 119 4Q 2016
New Pearl 3 B 120 4Q 2016
Saigon South Place 7 A 480 2017
Saigon Center Phase 2 1 A 216 2017
Berkley Service Residence 2 B 85 2017
Table 7: Serviced apartment, Significant future projects under construction
Source: Colliers International Research
Figure 16: Serviced Apartment, Current grade A&B supply
Source: Colliers International Research
Figure 17: Serviced Apartment, Average asking rent by grade
Source: Colliers International Research
0
1,000
2,000
3,000
4,000
2010 2011 2012 2013 2014 2015 Q1 2016
units
Grade A Grade B
15
20
25
30
35
2010 2011 2012 2013 2014 2015 Q1 2016
US$/sqm/month
Grade A Grade B
Accelerating success
Q1 2016 | HO CHI MINH CITY | SERVICED APARTMENT
VIETNAM QUARTERLY KNOWLEDGE REPORT
©2016 Colliers International Research Page 16
Table 8: Significant Serviced Apartment Projects
No. Project Name Address Location
Completion
Year
Total
Room
Average
Occupancy
ARR(*)
(**)
1 The Landmark 5B Ton Duc Thang District 1 1995 66 95.0% 26
2 Sedona Suites 65 Le Loi District 1 1996 89 89.0% 30
3 Somerset Chancellor Court 21-23 Nguyen Thi Minh Khai District 1 1996 172 96.0% 34
4 Nguyen Du Park Villas 111 Nguyen Du District 1 2004 41 98.0% 30
5 The Lancaster 22-22 Bis Le Thanh Ton District 1 2007 55 73.0% 37
6 Intercontinental Asian Saigon 39 Le Duan District 1 2009 260 95.0% 36
Grade A 683 92.9% 33.5
1 Norfork Mansion 17-21 Ly Tu Trong District 1 1998 126 85.0% 26
2 Saigon Sky Garden 20 Le Thanh Ton District 1 1998 154 85.0% 26
3 Somerset HCM 8A Nguyen Binh Khiem District 1 1998 165 94.0% 26
4 Diamond Plaza 34 Le Duan District 1 1999 42 95.0% 29
5 Garden View Court 101 Nguyen Du District 1 2000 76 91.0% 31
6 Ben Thanh Luxury 172-174 Ky Con District 1 2010 88 91.0% 18
7 Lafayette De SaiGon 8 Phung Khac Khoan District 1 2010 18 89.0% 28
8 Vincom Center 45A Ly Tu Trong District 1 2010 60 34.0% 26
9 Nikko Saigon 235 Nguyen Van Cu District 1 2011 54 100.0% 30
10 Saigon City Residence 8A/3D2 Thai Van Lung District 1 2011 17 84.0% 23
11 Spring Court 1Bis Phung Khac Khoan District 1 2011 14 76.0% 23
Grade B 814 85.7% 25.9
(*) US/sqm/month
(**) ARR (Average Rental Rate): All rents are stated in gross rents per sqm, not including VAT and serviced charge
©2016 Colliers International Research
Accelerating success
Q1 2016 | HO CHI MINH CITY | INDUSTRIAL
VIETNAM QUARTERLY KNOWLEDGE REPORT
©2016 Colliers International Research Page 17
PERFORMANCE
In Q1 2016, the average rent of industrial parks (IPs) in HCM
City was USD122/sqm/term and the average land use right
term was 35.7 years. IPs in Cu Chi district have the lowest
rents, averaging at USD50-USD60/sqm/term. On the contrary,
IPs in Tan Binh District and District 7 have highest asking
rents of, up to USD220-USD270/sqm/term. In general, rents
in HCMC are currently more than double compared to those in
the Southern Key Economic Region such as Binh Duong, Dong
Nai, Long An, Vung Tau.
The average occupancy rate was 68%, stable over the quarter.
About two-thirds of IPs enjoyed above 90% occupancy rates
due to its convenient location and efficient services. Common
offers for ready-built factories were USD2.5-USD4/sqm/month
(exclusive of VAT and service charge) with a minimum area
from 1,000-5,000sqm.
SUPPLY
In the first three months of 2016, there is no new supply of IPS.
The total areas of IPs in HCMC are over 3,900ha of which the
leasable areas are over 2,700ha.
By 2020, the total supply of industrial zones is estimated to rise
to above 6,500 ha, up to 67% compared to the current supply.
However, there is an uncertainty on the construction progress
of some industrial parks.
DEMAND
Inflows of Foreign direct investment (FDI) to Export Processing
Zones (EPZs) and industrial parks (IPs) in Ho Chi Minh City
plummeted 69.5% year-on-year to USD116 million in the first
three months of 2016.
As of the end of March 2016, domestic and foreign firms
registered to invest in 1,390 projects with accumulated capital
of USD9.17 billion in HCM City’ EZs and IPs of which foreign-
owned-enterprises accounted for 554 projects and USD5.42
billion.
Meanwhile, domestic companies pledged to invest nearly
USD80.4 million in EZs and IPs in the first quarter of 2016,
representing an 80% y-o-y increase.Companies from non-TPP
member nations such as China, Korea, India would relocate
their operations and factories to Vietnam in order to benefit
from tax incentives for their products. Foreign investors,
especially from the U.S and Japan, will also flow into Vietnam
more heavily to take advantage of Vietnam’s abundant labor
force and a 90-million consumers market. These factors
positively contribute to the demand for industrial real estates.
OUTLOOK
Rents and occupancy rates are likely to go up in the coming
quarters as the inflows of FDI and the expansion of production
in preparation for the TPP and other FTAs are expected to
continue.
The number of industrial areas is still being expanded.
However, the majority of future projects are in the process
of site clearance and compensation and hence construction
process is expected to be prolonged. Le Minh Xuan 2, Le Minh
Xuan 3, Vinh Loc 3, Hiep Phuoc phase 2 are among those that
are on track to be in operation soon.
VIETNAM QUARTERLY KNOWLEDGE REPORT
©2016 Colliers International Research
Figure 18: Industrial, Net absorption
Source: Colliers International Research
Figure 19: Industrial, Supply by District
Source: Colliers International Research
Table 9: Industrial, Future Supply
Industrial Park Name District
GFA
(ha)
Le Minh Xuan Industrial Park - phase 3 Binh Chanh 242
Tay Bac Cu Chi Industrial Park - phase 2 Cu Chi 173
Hiep Phuoc Industrial Park - phase 2 Nha Be 597
0
10
20
30
40
50
60
70
80
Q1 Q2 Q3 Q4 Q1 Q2 Q3 Q4 Q1 Q2 Q3 Q4 Q1 Q2 Q3 Q4 Q1
2012 2013 2014 2015 2016
ha
Dist. 9
22%
Cu Chi
23%
Binh Chanh
16%
Binh Tan
10%
Dist. 7
8%
Nha Be
8%
Others
13%
Q1 2016 | HO CHI MINH CITY | INDUSTRIAL
VIETNAM QUARTERLY KNOWLEDGE REPORT
©2016 Colliers International Research Page 18
Table 3: Significant Office Projects
Table 10: HCMC Industrial Market Overview
No Name of Industrial Park Location
Distance to
CBD (km)
Total Area
(ha)
Total leasable
area (ha)
Asking Rent
(US$/sqm/
term)
Occupancy LUR Term
1 Linh Trung 1 Export Processing Zone Thu Duc 18 62 46 60 100% 2042
2 Linh Trung 2 Export Processing Zone Thu Duc 17 62 44 60 99% 2050
3 Binh Chieu Industrial Park Thu Duc 16 27 27 150 100% 2046
4 Saigon Hi-tech Park P1 District 9 15 300 300 60 100% 2052
5 Tay Bac Cu Chi Industrial Park Cu Chi 36.5 208 150 90 99% 2047
6 Tan Thoi Hiep Industrial Park District 12 16 28 20 100 100% 2049
7 Tan Phu Trung Industrial Park Cu Chi 37 543 359 73 28% 2054
8 Tan Thuan Export Processing Zone District 7 6.4 300 205 260 81% 2041
9 Hiep Phuoc Industrial Park 1 Nha Be 21 331 224 100 93% 2048
10 Hiep Phuoc Industrial Park 2 Nha Be 22 597 345 100 10% 2058
11 Tan Tao Industrial Park 1 Binh Tan 17 161 97 251 97% 2047
12 Tan Tao Industrial Park 2 Binh Tan 17 183 116 251 78% 2050
13 Tan Binh Industrial Park Tan Binh 11 129 100 235 100% 2047
14 Le Minh Xuan Industrial Park Binh Chanh 20 100 66 100 95% 2047
15 Vinh Loc Industrial Park Binh Chanh 15 203 131 270 95% 2047
16 Dong Nam Industrial Park Cu Chi 30 343 287 63 69% 2058
17 An Ha Industrial Park Binh Chanh 23 124 124 64 23% 2058
18 Cat Lai Industrial Park District 2 21 137 87 90 100% 2061
19 Automotive - Mechanical (Hoa Phu) Cu Chi 40 99 67 56 83% 2057
Total 3,937 2,795 122 68%
COLLIERS INTERNATIONAL | VIETNAM
HO CHI MINH CITY
Bitexco Office Building, 7th Floor
19-25 Nguyen Hue Street
District 1, HCM City, Vietnam
Tel: + 84 8 3827 5665
HANOI
Press Club Building, 4th Floor
59A Ly Thai To Street,
Hoan Kiem District, Hanoi, Vietnam
Tel: +84 8 3827 5665
502 offices in
67 countries on
6 continents
Accelerating success
DAVID JACKSON
General Director
david.jackson@colliers.com
+84 8 3827 5665
About Colliers International
Colliers International is a leader in global real estate services, defined by our spirit of
enterprise.
Through a culture of service excellence and a shared sense of initiative, we integrate the
resources of real estate specialists worldwide to accelerate the success of our partners.
We connect through a shared set of values that shape a collaborative environment throughout
our organization that is unsurpassed in the industry.
With more than 100 professionals in 2 offices in Vietnam, the team is market driven and
has proven and successful track record with both international and local experience.
From Hanoi to Ho Chi Minh City, we provide a full range of real estate services
The foundation of our services is the strength and depth of our experience.
Publication Coverage Frequency Content Availability
Knowledge Report/
Market Insights
Vietnam Cities Quarterly All market sectors Publicly available
Investment report Vietnam Quarterly Economic updates and
Investment highlights
Publicly available
CBD Report HCMC CBD Monthly Office, Retail, Hotel and
Serviced Apartment
Publicly available
Residential launch
update
HCMC Monthly Residential Publicly available
Asia Pacific Office
Report
Asia Pacific
including Vietnam
Quarterly Office market Publicly available
Vietnam Property
Market Report
Vietnam cities Quarterly All market sectors On subscription
Development
Recommendation
Vietnam cities At request All market sectors On subscription
$2.30
billion in
annual revenue
1.7
billion square feet
under management
16,300
professionals
and staff
This document has been prepared by Colliers International for advertising and general information only. Colliers International makes no guarantees,
representations or warranties of any kind, expressed or implied, regarding the information including, but not limited to, warranties of content,
accuracy and reliability. Any interested party should undertake their own inquiries as to the accuracy of the information. Colliers International
excludes unequivocally all inferred or implied terms, conditions and warranties arising out of this document and excludes all liability for loss and
damages arising there from. This publication is the copyrighted property of Colliers International and/or its licensor(s). ©2016. All rights reserved.
For further information, please contact us:
VIETNAM | RESEARCH  FORECAST REPORT
©2016 Colliers International Research www.colliers.com/vietnam
HA VO
Research Manager
ha.vo@colliers.com
+84 8 3827 5665

More Related Content

What's hot

Hanoi Quarterly Knowledge Report | Q4 2016
Hanoi Quarterly Knowledge Report | Q4 2016 Hanoi Quarterly Knowledge Report | Q4 2016
Hanoi Quarterly Knowledge Report | Q4 2016
Colliers International | Vietnam
 
HCMC Quarterly Knowledge Report | Q3 2016
HCMC Quarterly Knowledge Report | Q3 2016 HCMC Quarterly Knowledge Report | Q3 2016
HCMC Quarterly Knowledge Report | Q3 2016
Colliers International | Vietnam
 
HCMC Quarterly Knowledge Report | Q4 2015
HCMC Quarterly Knowledge Report | Q4 2015 HCMC Quarterly Knowledge Report | Q4 2015
HCMC Quarterly Knowledge Report | Q4 2015
Colliers International | Vietnam
 
Nigeria 2016 Outlook - to be or not to be
Nigeria 2016 Outlook - to be or not to beNigeria 2016 Outlook - to be or not to be
Nigeria 2016 Outlook - to be or not to beChuks Anyanwu
 
Cep report uk_business_15112011
Cep report uk_business_15112011Cep report uk_business_15112011
Cep report uk_business_15112011
Aliya Urazaliyeva
 
The State of Domestic Commerce in Pakistan Study 5 - Retail Markets
The State of Domestic Commerce in Pakistan Study 5 - Retail MarketsThe State of Domestic Commerce in Pakistan Study 5 - Retail Markets
The State of Domestic Commerce in Pakistan Study 5 - Retail Markets
idspak
 
06.2012. REPORT, World Bank Mongolia Quarterly Economic Update, The World Bank
06.2012. REPORT, World Bank Mongolia Quarterly Economic Update, The World Bank06.2012. REPORT, World Bank Mongolia Quarterly Economic Update, The World Bank
06.2012. REPORT, World Bank Mongolia Quarterly Economic Update, The World Bank
The Business Council of Mongolia
 
Бюджет DARPA на 2012 финансовый год
Бюджет DARPA на 2012 финансовый годБюджет DARPA на 2012 финансовый год
Бюджет DARPA на 2012 финансовый год
Ilya Klabukov
 
2016 OECD Business and Finance Scoreboard
2016 OECD Business and Finance Scoreboard2016 OECD Business and Finance Scoreboard
2016 OECD Business and Finance Scoreboard
OECD Directorate for Financial and Enterprise Affairs
 
Regional Study on Financial Education in the EAC Draft Report
Regional Study on Financial Education in the EAC Draft ReportRegional Study on Financial Education in the EAC Draft Report
Regional Study on Financial Education in the EAC Draft ReportMoses Biu
 
understanding-local-growth
understanding-local-growthunderstanding-local-growth
understanding-local-growth30088
 
Curacao Economic Outlook 2011
Curacao Economic Outlook 2011Curacao Economic Outlook 2011
Curacao Economic Outlook 2011
HUBcuracao
 
Sample global oil and gas supporting activities market research report 2020
Sample global oil and gas supporting activities market research report 2020Sample global oil and gas supporting activities market research report 2020
Sample global oil and gas supporting activities market research report 2020
Cognitive Market Research
 
2011 illinois-state-budget
2011 illinois-state-budget2011 illinois-state-budget
2011 illinois-state-budget
club1075
 
10000032 en-agriculture-and-rural-development-sector-bank-group-policy-final-...
10000032 en-agriculture-and-rural-development-sector-bank-group-policy-final-...10000032 en-agriculture-and-rural-development-sector-bank-group-policy-final-...
10000032 en-agriculture-and-rural-development-sector-bank-group-policy-final-...Dr Lendy Spires
 
DBEDT's 2014 Q3 Statistical & Economic Report
DBEDT's 2014 Q3 Statistical & Economic ReportDBEDT's 2014 Q3 Statistical & Economic Report
DBEDT's 2014 Q3 Statistical & Economic Report
Honolulu Civil Beat
 
S7C: MiFID II Research Unbundling Market Research Report (2017)
S7C: MiFID II Research Unbundling Market Research Report (2017)S7C: MiFID II Research Unbundling Market Research Report (2017)
S7C: MiFID II Research Unbundling Market Research Report (2017)
Rodrigo Zepeda LLB, LLM, Chartered MCSI
 
James Fund IPS 2016.02.17
James Fund IPS 2016.02.17James Fund IPS 2016.02.17
James Fund IPS 2016.02.17Xiaochen Deng
 
2012 Jordan ICT & ITES Industry Statistics Yearbook
2012 Jordan ICT & ITES Industry Statistics Yearbook2012 Jordan ICT & ITES Industry Statistics Yearbook
2012 Jordan ICT & ITES Industry Statistics Yearbook
Entrepreneurship and ICT Advisor
 

What's hot (20)

Hanoi Quarterly Knowledge Report | Q4 2016
Hanoi Quarterly Knowledge Report | Q4 2016 Hanoi Quarterly Knowledge Report | Q4 2016
Hanoi Quarterly Knowledge Report | Q4 2016
 
HCMC Quarterly Knowledge Report | Q3 2016
HCMC Quarterly Knowledge Report | Q3 2016 HCMC Quarterly Knowledge Report | Q3 2016
HCMC Quarterly Knowledge Report | Q3 2016
 
HCMC Quarterly Knowledge Report | Q4 2015
HCMC Quarterly Knowledge Report | Q4 2015 HCMC Quarterly Knowledge Report | Q4 2015
HCMC Quarterly Knowledge Report | Q4 2015
 
Nigeria 2016 Outlook - to be or not to be
Nigeria 2016 Outlook - to be or not to beNigeria 2016 Outlook - to be or not to be
Nigeria 2016 Outlook - to be or not to be
 
Cep report uk_business_15112011
Cep report uk_business_15112011Cep report uk_business_15112011
Cep report uk_business_15112011
 
The State of Domestic Commerce in Pakistan Study 5 - Retail Markets
The State of Domestic Commerce in Pakistan Study 5 - Retail MarketsThe State of Domestic Commerce in Pakistan Study 5 - Retail Markets
The State of Domestic Commerce in Pakistan Study 5 - Retail Markets
 
2011 ICT and ITES Industry Statistics Yearbook
2011 ICT and ITES Industry Statistics Yearbook2011 ICT and ITES Industry Statistics Yearbook
2011 ICT and ITES Industry Statistics Yearbook
 
06.2012. REPORT, World Bank Mongolia Quarterly Economic Update, The World Bank
06.2012. REPORT, World Bank Mongolia Quarterly Economic Update, The World Bank06.2012. REPORT, World Bank Mongolia Quarterly Economic Update, The World Bank
06.2012. REPORT, World Bank Mongolia Quarterly Economic Update, The World Bank
 
Бюджет DARPA на 2012 финансовый год
Бюджет DARPA на 2012 финансовый годБюджет DARPA на 2012 финансовый год
Бюджет DARPA на 2012 финансовый год
 
2016 OECD Business and Finance Scoreboard
2016 OECD Business and Finance Scoreboard2016 OECD Business and Finance Scoreboard
2016 OECD Business and Finance Scoreboard
 
Regional Study on Financial Education in the EAC Draft Report
Regional Study on Financial Education in the EAC Draft ReportRegional Study on Financial Education in the EAC Draft Report
Regional Study on Financial Education in the EAC Draft Report
 
understanding-local-growth
understanding-local-growthunderstanding-local-growth
understanding-local-growth
 
Curacao Economic Outlook 2011
Curacao Economic Outlook 2011Curacao Economic Outlook 2011
Curacao Economic Outlook 2011
 
Sample global oil and gas supporting activities market research report 2020
Sample global oil and gas supporting activities market research report 2020Sample global oil and gas supporting activities market research report 2020
Sample global oil and gas supporting activities market research report 2020
 
2011 illinois-state-budget
2011 illinois-state-budget2011 illinois-state-budget
2011 illinois-state-budget
 
10000032 en-agriculture-and-rural-development-sector-bank-group-policy-final-...
10000032 en-agriculture-and-rural-development-sector-bank-group-policy-final-...10000032 en-agriculture-and-rural-development-sector-bank-group-policy-final-...
10000032 en-agriculture-and-rural-development-sector-bank-group-policy-final-...
 
DBEDT's 2014 Q3 Statistical & Economic Report
DBEDT's 2014 Q3 Statistical & Economic ReportDBEDT's 2014 Q3 Statistical & Economic Report
DBEDT's 2014 Q3 Statistical & Economic Report
 
S7C: MiFID II Research Unbundling Market Research Report (2017)
S7C: MiFID II Research Unbundling Market Research Report (2017)S7C: MiFID II Research Unbundling Market Research Report (2017)
S7C: MiFID II Research Unbundling Market Research Report (2017)
 
James Fund IPS 2016.02.17
James Fund IPS 2016.02.17James Fund IPS 2016.02.17
James Fund IPS 2016.02.17
 
2012 Jordan ICT & ITES Industry Statistics Yearbook
2012 Jordan ICT & ITES Industry Statistics Yearbook2012 Jordan ICT & ITES Industry Statistics Yearbook
2012 Jordan ICT & ITES Industry Statistics Yearbook
 

Similar to HCMC Quarterly Knowledge Report | Q1 2016

Hanoi Quarterly Knowledge Report | Q4 2015
Hanoi Quarterly Knowledge Report | Q4 2015 Hanoi Quarterly Knowledge Report | Q4 2015
Hanoi Quarterly Knowledge Report | Q4 2015
Colliers International | Vietnam
 
Vietnam Investment Report Q4 2015 (EN)
Vietnam Investment Report Q4 2015 (EN)Vietnam Investment Report Q4 2015 (EN)
Vietnam Investment Report Q4 2015 (EN)
Colliers International | Vietnam
 
Why so idle wages and employment in a crowded labor market
Why so idle wages and employment in a crowded labor marketWhy so idle wages and employment in a crowded labor market
Why so idle wages and employment in a crowded labor market
Ntalemu
 
Rong Viet Securities - Investment Strategy July 2018
Rong Viet Securities - Investment Strategy July 2018Rong Viet Securities - Investment Strategy July 2018
Rong Viet Securities - Investment Strategy July 2018
Thomas Farthofer
 
Retailing in vietnam 2016
Retailing in vietnam 2016Retailing in vietnam 2016
Retailing in vietnam 2016
Tuan Le
 
Vietnam Quarterly Knowledge Report | Q4 2015
Vietnam Quarterly Knowledge Report | Q4 2015 Vietnam Quarterly Knowledge Report | Q4 2015
Vietnam Quarterly Knowledge Report | Q4 2015
Colliers International | Vietnam
 
MSFCap2016FP_Group6
MSFCap2016FP_Group6MSFCap2016FP_Group6
MSFCap2016FP_Group6Gavin Yeh
 
Financial Economics Final Project
Financial Economics Final ProjectFinancial Economics Final Project
Financial Economics Final ProjectCongyi Liu
 
Zimbabwe's 2019 Monetary Policy Statement
Zimbabwe's 2019 Monetary Policy Statement Zimbabwe's 2019 Monetary Policy Statement
Zimbabwe's 2019 Monetary Policy Statement
Povo News
 
Economic reports and outlooks - Québec City CMA, 2014-2015
Economic reports and outlooks - Québec City CMA, 2014-2015Economic reports and outlooks - Québec City CMA, 2014-2015
Economic reports and outlooks - Québec City CMA, 2014-2015
Université Laval
 
Taking Stock June 2008 En Final
Taking Stock June 2008 En FinalTaking Stock June 2008 En Final
Taking Stock June 2008 En Finalhsplastic
 
Investigations
InvestigationsInvestigations
Investigationshemeshc
 
Industrial Market Report 2019
Industrial Market Report 2019Industrial Market Report 2019
Industrial Market Report 2019
TMS_Consultancy
 
Informe - La economía global entra en aguas turbulentas
Informe - La economía global entra en aguas turbulentasInforme - La economía global entra en aguas turbulentas
Informe - La economía global entra en aguas turbulentas
Ignacio Jimenez
 
Impect of macroeconomics determinant on the gdp growth rate and performance o...
Impect of macroeconomics determinant on the gdp growth rate and performance o...Impect of macroeconomics determinant on the gdp growth rate and performance o...
Impect of macroeconomics determinant on the gdp growth rate and performance o...
The Superior University, Lahore
 
International finance issue of Vietnam
International finance issue of VietnamInternational finance issue of Vietnam
International finance issue of VietnamGolden Nguyen
 
Gbe group3
Gbe group3 Gbe group3
Gbe group3
VishalKhurana23
 
Vietnam Quarterly Knowledge Report | Q3 2016
Vietnam Quarterly Knowledge Report | Q3 2016 Vietnam Quarterly Knowledge Report | Q3 2016
Vietnam Quarterly Knowledge Report | Q3 2016
Colliers International | Vietnam
 

Similar to HCMC Quarterly Knowledge Report | Q1 2016 (20)

Hanoi Quarterly Knowledge Report | Q4 2015
Hanoi Quarterly Knowledge Report | Q4 2015 Hanoi Quarterly Knowledge Report | Q4 2015
Hanoi Quarterly Knowledge Report | Q4 2015
 
Vietnam Investment Report Q4 2015 (EN)
Vietnam Investment Report Q4 2015 (EN)Vietnam Investment Report Q4 2015 (EN)
Vietnam Investment Report Q4 2015 (EN)
 
Why so idle wages and employment in a crowded labor market
Why so idle wages and employment in a crowded labor marketWhy so idle wages and employment in a crowded labor market
Why so idle wages and employment in a crowded labor market
 
IMSF Annual Report2 015
IMSF Annual Report2 015IMSF Annual Report2 015
IMSF Annual Report2 015
 
Rong Viet Securities - Investment Strategy July 2018
Rong Viet Securities - Investment Strategy July 2018Rong Viet Securities - Investment Strategy July 2018
Rong Viet Securities - Investment Strategy July 2018
 
Retailing in vietnam 2016
Retailing in vietnam 2016Retailing in vietnam 2016
Retailing in vietnam 2016
 
Vietnam Quarterly Knowledge Report | Q4 2015
Vietnam Quarterly Knowledge Report | Q4 2015 Vietnam Quarterly Knowledge Report | Q4 2015
Vietnam Quarterly Knowledge Report | Q4 2015
 
MSFCap2016FP_Group6
MSFCap2016FP_Group6MSFCap2016FP_Group6
MSFCap2016FP_Group6
 
Financial Economics Final Project
Financial Economics Final ProjectFinancial Economics Final Project
Financial Economics Final Project
 
Zimbabwe's 2019 Monetary Policy Statement
Zimbabwe's 2019 Monetary Policy Statement Zimbabwe's 2019 Monetary Policy Statement
Zimbabwe's 2019 Monetary Policy Statement
 
Economic reports and outlooks - Québec City CMA, 2014-2015
Economic reports and outlooks - Québec City CMA, 2014-2015Economic reports and outlooks - Québec City CMA, 2014-2015
Economic reports and outlooks - Québec City CMA, 2014-2015
 
Taking Stock June 2008 En Final
Taking Stock June 2008 En FinalTaking Stock June 2008 En Final
Taking Stock June 2008 En Final
 
Investigations
InvestigationsInvestigations
Investigations
 
Industrial Market Report 2019
Industrial Market Report 2019Industrial Market Report 2019
Industrial Market Report 2019
 
Informe - La economía global entra en aguas turbulentas
Informe - La economía global entra en aguas turbulentasInforme - La economía global entra en aguas turbulentas
Informe - La economía global entra en aguas turbulentas
 
QCR-2015-Q2
QCR-2015-Q2QCR-2015-Q2
QCR-2015-Q2
 
Impect of macroeconomics determinant on the gdp growth rate and performance o...
Impect of macroeconomics determinant on the gdp growth rate and performance o...Impect of macroeconomics determinant on the gdp growth rate and performance o...
Impect of macroeconomics determinant on the gdp growth rate and performance o...
 
International finance issue of Vietnam
International finance issue of VietnamInternational finance issue of Vietnam
International finance issue of Vietnam
 
Gbe group3
Gbe group3 Gbe group3
Gbe group3
 
Vietnam Quarterly Knowledge Report | Q3 2016
Vietnam Quarterly Knowledge Report | Q3 2016 Vietnam Quarterly Knowledge Report | Q3 2016
Vietnam Quarterly Knowledge Report | Q3 2016
 

More from Colliers International | Vietnam

Colliers Radar report: "2017 - the year in which Asian property capital flows...
Colliers Radar report: "2017 - the year in which Asian property capital flows...Colliers Radar report: "2017 - the year in which Asian property capital flows...
Colliers Radar report: "2017 - the year in which Asian property capital flows...
Colliers International | Vietnam
 
IHG - General Information
IHG - General InformationIHG - General Information
IHG - General Information
Colliers International | Vietnam
 
IRS - Aparments
IRS - AparmentsIRS - Aparments
IRS - General Information
IRS - General InformationIRS - General Information
IRS - General Information
Colliers International | Vietnam
 
Asia Pacific: Colliers Radar - The dragons rise anew
Asia Pacific: Colliers Radar - The dragons rise anewAsia Pacific: Colliers Radar - The dragons rise anew
Asia Pacific: Colliers Radar - The dragons rise anew
Colliers International | Vietnam
 
Asia Property Capital Quarterly - September 2016
Asia Property Capital Quarterly - September 2016Asia Property Capital Quarterly - September 2016
Asia Property Capital Quarterly - September 2016
Colliers International | Vietnam
 
CBD Monthly Report | January 2016 (VN)
CBD Monthly Report | January 2016 (VN)CBD Monthly Report | January 2016 (VN)
CBD Monthly Report | January 2016 (VN)
Colliers International | Vietnam
 
CBD Monthly Report | January 2016
CBD Monthly Report | January 2016CBD Monthly Report | January 2016
CBD Monthly Report | January 2016
Colliers International | Vietnam
 
HCMC Market Insights Q1 2016 (EN)
HCMC Market Insights Q1 2016 (EN)HCMC Market Insights Q1 2016 (EN)
HCMC Market Insights Q1 2016 (EN)
Colliers International | Vietnam
 
Hanoi Market Insights Q1 2016 (VN)
Hanoi Market Insights Q1 2016 (VN)Hanoi Market Insights Q1 2016 (VN)
Hanoi Market Insights Q1 2016 (VN)
Colliers International | Vietnam
 
Hanoi Market Insights Q1 2016 (EN)
Hanoi Market Insights Q1 2016 (EN)Hanoi Market Insights Q1 2016 (EN)
Hanoi Market Insights Q1 2016 (EN)
Colliers International | Vietnam
 
HCMC CBD Market Report | Apr 2016 (EN)
HCMC CBD Market Report | Apr 2016 (EN)HCMC CBD Market Report | Apr 2016 (EN)
HCMC CBD Market Report | Apr 2016 (EN)
Colliers International | Vietnam
 
HCMC CBD Market Report | Apr 2016 (VN)
HCMC CBD Market Report | Apr 2016 (VN)HCMC CBD Market Report | Apr 2016 (VN)
HCMC CBD Market Report | Apr 2016 (VN)
Colliers International | Vietnam
 
HCMC CBD Market Report | Feb 2016 (VN)
HCMC CBD Market Report | Feb 2016 (VN)HCMC CBD Market Report | Feb 2016 (VN)
HCMC CBD Market Report | Feb 2016 (VN)
Colliers International | Vietnam
 
HCMC CBD Market Report | Feb 2016 (EN)
HCMC CBD Market Report | Feb 2016 (EN)HCMC CBD Market Report | Feb 2016 (EN)
HCMC CBD Market Report | Feb 2016 (EN)
Colliers International | Vietnam
 
HCMC Residential Launch Update | Feb 2016 (EN)
HCMC Residential Launch Update | Feb 2016 (EN)HCMC Residential Launch Update | Feb 2016 (EN)
HCMC Residential Launch Update | Feb 2016 (EN)
Colliers International | Vietnam
 
HCMC CBD Market Report | Jan 2016 (VN)
HCMC CBD Market Report | Jan 2016 (VN)HCMC CBD Market Report | Jan 2016 (VN)
HCMC CBD Market Report | Jan 2016 (VN)
Colliers International | Vietnam
 
HCMC CBD Market Report | Jan 2016 (EN)
HCMC CBD Market Report | Jan 2016 (EN)HCMC CBD Market Report | Jan 2016 (EN)
HCMC CBD Market Report | Jan 2016 (EN)
Colliers International | Vietnam
 
4Q 2015 Asia Pacific Office Market Map
4Q 2015 Asia Pacific Office Market Map4Q 2015 Asia Pacific Office Market Map
4Q 2015 Asia Pacific Office Market Map
Colliers International | Vietnam
 

More from Colliers International | Vietnam (19)

Colliers Radar report: "2017 - the year in which Asian property capital flows...
Colliers Radar report: "2017 - the year in which Asian property capital flows...Colliers Radar report: "2017 - the year in which Asian property capital flows...
Colliers Radar report: "2017 - the year in which Asian property capital flows...
 
IHG - General Information
IHG - General InformationIHG - General Information
IHG - General Information
 
IRS - Aparments
IRS - AparmentsIRS - Aparments
IRS - Aparments
 
IRS - General Information
IRS - General InformationIRS - General Information
IRS - General Information
 
Asia Pacific: Colliers Radar - The dragons rise anew
Asia Pacific: Colliers Radar - The dragons rise anewAsia Pacific: Colliers Radar - The dragons rise anew
Asia Pacific: Colliers Radar - The dragons rise anew
 
Asia Property Capital Quarterly - September 2016
Asia Property Capital Quarterly - September 2016Asia Property Capital Quarterly - September 2016
Asia Property Capital Quarterly - September 2016
 
CBD Monthly Report | January 2016 (VN)
CBD Monthly Report | January 2016 (VN)CBD Monthly Report | January 2016 (VN)
CBD Monthly Report | January 2016 (VN)
 
CBD Monthly Report | January 2016
CBD Monthly Report | January 2016CBD Monthly Report | January 2016
CBD Monthly Report | January 2016
 
HCMC Market Insights Q1 2016 (EN)
HCMC Market Insights Q1 2016 (EN)HCMC Market Insights Q1 2016 (EN)
HCMC Market Insights Q1 2016 (EN)
 
Hanoi Market Insights Q1 2016 (VN)
Hanoi Market Insights Q1 2016 (VN)Hanoi Market Insights Q1 2016 (VN)
Hanoi Market Insights Q1 2016 (VN)
 
Hanoi Market Insights Q1 2016 (EN)
Hanoi Market Insights Q1 2016 (EN)Hanoi Market Insights Q1 2016 (EN)
Hanoi Market Insights Q1 2016 (EN)
 
HCMC CBD Market Report | Apr 2016 (EN)
HCMC CBD Market Report | Apr 2016 (EN)HCMC CBD Market Report | Apr 2016 (EN)
HCMC CBD Market Report | Apr 2016 (EN)
 
HCMC CBD Market Report | Apr 2016 (VN)
HCMC CBD Market Report | Apr 2016 (VN)HCMC CBD Market Report | Apr 2016 (VN)
HCMC CBD Market Report | Apr 2016 (VN)
 
HCMC CBD Market Report | Feb 2016 (VN)
HCMC CBD Market Report | Feb 2016 (VN)HCMC CBD Market Report | Feb 2016 (VN)
HCMC CBD Market Report | Feb 2016 (VN)
 
HCMC CBD Market Report | Feb 2016 (EN)
HCMC CBD Market Report | Feb 2016 (EN)HCMC CBD Market Report | Feb 2016 (EN)
HCMC CBD Market Report | Feb 2016 (EN)
 
HCMC Residential Launch Update | Feb 2016 (EN)
HCMC Residential Launch Update | Feb 2016 (EN)HCMC Residential Launch Update | Feb 2016 (EN)
HCMC Residential Launch Update | Feb 2016 (EN)
 
HCMC CBD Market Report | Jan 2016 (VN)
HCMC CBD Market Report | Jan 2016 (VN)HCMC CBD Market Report | Jan 2016 (VN)
HCMC CBD Market Report | Jan 2016 (VN)
 
HCMC CBD Market Report | Jan 2016 (EN)
HCMC CBD Market Report | Jan 2016 (EN)HCMC CBD Market Report | Jan 2016 (EN)
HCMC CBD Market Report | Jan 2016 (EN)
 
4Q 2015 Asia Pacific Office Market Map
4Q 2015 Asia Pacific Office Market Map4Q 2015 Asia Pacific Office Market Map
4Q 2015 Asia Pacific Office Market Map
 

Recently uploaded

Killer Referans Bahcesehir Catalog Listing Turkey
Killer Referans Bahcesehir Catalog Listing TurkeyKiller Referans Bahcesehir Catalog Listing Turkey
Killer Referans Bahcesehir Catalog Listing Turkey
Listing Turkey
 
Investing In The US As A Canadian… And How To Do It RIGHT!! (feat. Erwin Szet...
Investing In The US As A Canadian… And How To Do It RIGHT!! (feat. Erwin Szet...Investing In The US As A Canadian… And How To Do It RIGHT!! (feat. Erwin Szet...
Investing In The US As A Canadian… And How To Do It RIGHT!! (feat. Erwin Szet...
Volition Properties
 
Torun Center Residences Istanbul - Listing Turkey
Torun Center Residences Istanbul - Listing TurkeyTorun Center Residences Istanbul - Listing Turkey
Torun Center Residences Istanbul - Listing Turkey
Listing Turkey
 
Simpolo Company Profile & Corporate Logo
Simpolo Company Profile & Corporate LogoSimpolo Company Profile & Corporate Logo
Simpolo Company Profile & Corporate Logo
simpolosparkteam
 
Green Homes, Islamabad Presentation .pdf
Green Homes, Islamabad Presentation .pdfGreen Homes, Islamabad Presentation .pdf
Green Homes, Islamabad Presentation .pdf
ticktoktips
 
How to Scan Tenants in NYC - You Should Know!
How to Scan Tenants in NYC - You Should Know!How to Scan Tenants in NYC - You Should Know!
How to Scan Tenants in NYC - You Should Know!
BelgiumManagement
 
Urbanrise Paradise on Earth - Unveiling Unprecedented Luxury in Exquisite Vil...
Urbanrise Paradise on Earth - Unveiling Unprecedented Luxury in Exquisite Vil...Urbanrise Paradise on Earth - Unveiling Unprecedented Luxury in Exquisite Vil...
Urbanrise Paradise on Earth - Unveiling Unprecedented Luxury in Exquisite Vil...
JagadishKR1
 
Hawthorn Module 1 Coverted to Slide Show - 04.06.2024.docx
Hawthorn Module 1 Coverted to Slide Show - 04.06.2024.docxHawthorn Module 1 Coverted to Slide Show - 04.06.2024.docx
Hawthorn Module 1 Coverted to Slide Show - 04.06.2024.docx
anothershaneroberts
 
Riverview City Loni Kalbhor Pune Brochure
Riverview City Loni Kalbhor Pune BrochureRiverview City Loni Kalbhor Pune Brochure
Riverview City Loni Kalbhor Pune Brochure
kishor21012022
 
Sense Levent Kagithane Catalog - Listing Turkey
Sense Levent Kagithane Catalog - Listing TurkeySense Levent Kagithane Catalog - Listing Turkey
Sense Levent Kagithane Catalog - Listing Turkey
Listing Turkey
 
The KA Housing - Catalogue - Listing Turkey
The KA Housing - Catalogue - Listing TurkeyThe KA Housing - Catalogue - Listing Turkey
The KA Housing - Catalogue - Listing Turkey
Listing Turkey
 
How to keep your Home naturally Cool and Warm
How to keep your Home naturally Cool and WarmHow to keep your Home naturally Cool and Warm
How to keep your Home naturally Cool and Warm
Vinra Construction
 
Omaxe Sports City Dwarka A Comprehensive Guide
Omaxe Sports City Dwarka A Comprehensive GuideOmaxe Sports City Dwarka A Comprehensive Guide
Omaxe Sports City Dwarka A Comprehensive Guide
omaxesportscitydwark
 
One20 North Vancouver Floor Plans by Three Shores Development.
One20 North Vancouver Floor Plans by Three Shores Development.One20 North Vancouver Floor Plans by Three Shores Development.
One20 North Vancouver Floor Plans by Three Shores Development.
VickyAulakh1
 
BricknBolt Understanding Load-Bearing Walls and Their Structural Support in H...
BricknBolt Understanding Load-Bearing Walls and Their Structural Support in H...BricknBolt Understanding Load-Bearing Walls and Their Structural Support in H...
BricknBolt Understanding Load-Bearing Walls and Their Structural Support in H...
BrickAndBolt
 
Brigade Insignia at Yelahanka Brochure.pdf
Brigade Insignia at Yelahanka Brochure.pdfBrigade Insignia at Yelahanka Brochure.pdf
Brigade Insignia at Yelahanka Brochure.pdf
SachinChauhan191
 
Optimizing Your MCA Lead Capture Process for Better Results
Optimizing Your MCA Lead Capture Process for Better ResultsOptimizing Your MCA Lead Capture Process for Better Results
Optimizing Your MCA Lead Capture Process for Better Results
Lead Generation Media
 
SVN Live 6.3.24 Weekly Property Broadcast
SVN Live 6.3.24 Weekly Property BroadcastSVN Live 6.3.24 Weekly Property Broadcast
SVN Live 6.3.24 Weekly Property Broadcast
SVN International Corp.
 
Deutsche EuroShop | Company Presentation | 06/24
Deutsche EuroShop | Company Presentation | 06/24Deutsche EuroShop | Company Presentation | 06/24
Deutsche EuroShop | Company Presentation | 06/24
Deutsche EuroShop AG
 
Elegant Evergreen Homes - Luxury Apartments Redefining Comfort in Yelahanka, ...
Elegant Evergreen Homes - Luxury Apartments Redefining Comfort in Yelahanka, ...Elegant Evergreen Homes - Luxury Apartments Redefining Comfort in Yelahanka, ...
Elegant Evergreen Homes - Luxury Apartments Redefining Comfort in Yelahanka, ...
JagadishKR1
 

Recently uploaded (20)

Killer Referans Bahcesehir Catalog Listing Turkey
Killer Referans Bahcesehir Catalog Listing TurkeyKiller Referans Bahcesehir Catalog Listing Turkey
Killer Referans Bahcesehir Catalog Listing Turkey
 
Investing In The US As A Canadian… And How To Do It RIGHT!! (feat. Erwin Szet...
Investing In The US As A Canadian… And How To Do It RIGHT!! (feat. Erwin Szet...Investing In The US As A Canadian… And How To Do It RIGHT!! (feat. Erwin Szet...
Investing In The US As A Canadian… And How To Do It RIGHT!! (feat. Erwin Szet...
 
Torun Center Residences Istanbul - Listing Turkey
Torun Center Residences Istanbul - Listing TurkeyTorun Center Residences Istanbul - Listing Turkey
Torun Center Residences Istanbul - Listing Turkey
 
Simpolo Company Profile & Corporate Logo
Simpolo Company Profile & Corporate LogoSimpolo Company Profile & Corporate Logo
Simpolo Company Profile & Corporate Logo
 
Green Homes, Islamabad Presentation .pdf
Green Homes, Islamabad Presentation .pdfGreen Homes, Islamabad Presentation .pdf
Green Homes, Islamabad Presentation .pdf
 
How to Scan Tenants in NYC - You Should Know!
How to Scan Tenants in NYC - You Should Know!How to Scan Tenants in NYC - You Should Know!
How to Scan Tenants in NYC - You Should Know!
 
Urbanrise Paradise on Earth - Unveiling Unprecedented Luxury in Exquisite Vil...
Urbanrise Paradise on Earth - Unveiling Unprecedented Luxury in Exquisite Vil...Urbanrise Paradise on Earth - Unveiling Unprecedented Luxury in Exquisite Vil...
Urbanrise Paradise on Earth - Unveiling Unprecedented Luxury in Exquisite Vil...
 
Hawthorn Module 1 Coverted to Slide Show - 04.06.2024.docx
Hawthorn Module 1 Coverted to Slide Show - 04.06.2024.docxHawthorn Module 1 Coverted to Slide Show - 04.06.2024.docx
Hawthorn Module 1 Coverted to Slide Show - 04.06.2024.docx
 
Riverview City Loni Kalbhor Pune Brochure
Riverview City Loni Kalbhor Pune BrochureRiverview City Loni Kalbhor Pune Brochure
Riverview City Loni Kalbhor Pune Brochure
 
Sense Levent Kagithane Catalog - Listing Turkey
Sense Levent Kagithane Catalog - Listing TurkeySense Levent Kagithane Catalog - Listing Turkey
Sense Levent Kagithane Catalog - Listing Turkey
 
The KA Housing - Catalogue - Listing Turkey
The KA Housing - Catalogue - Listing TurkeyThe KA Housing - Catalogue - Listing Turkey
The KA Housing - Catalogue - Listing Turkey
 
How to keep your Home naturally Cool and Warm
How to keep your Home naturally Cool and WarmHow to keep your Home naturally Cool and Warm
How to keep your Home naturally Cool and Warm
 
Omaxe Sports City Dwarka A Comprehensive Guide
Omaxe Sports City Dwarka A Comprehensive GuideOmaxe Sports City Dwarka A Comprehensive Guide
Omaxe Sports City Dwarka A Comprehensive Guide
 
One20 North Vancouver Floor Plans by Three Shores Development.
One20 North Vancouver Floor Plans by Three Shores Development.One20 North Vancouver Floor Plans by Three Shores Development.
One20 North Vancouver Floor Plans by Three Shores Development.
 
BricknBolt Understanding Load-Bearing Walls and Their Structural Support in H...
BricknBolt Understanding Load-Bearing Walls and Their Structural Support in H...BricknBolt Understanding Load-Bearing Walls and Their Structural Support in H...
BricknBolt Understanding Load-Bearing Walls and Their Structural Support in H...
 
Brigade Insignia at Yelahanka Brochure.pdf
Brigade Insignia at Yelahanka Brochure.pdfBrigade Insignia at Yelahanka Brochure.pdf
Brigade Insignia at Yelahanka Brochure.pdf
 
Optimizing Your MCA Lead Capture Process for Better Results
Optimizing Your MCA Lead Capture Process for Better ResultsOptimizing Your MCA Lead Capture Process for Better Results
Optimizing Your MCA Lead Capture Process for Better Results
 
SVN Live 6.3.24 Weekly Property Broadcast
SVN Live 6.3.24 Weekly Property BroadcastSVN Live 6.3.24 Weekly Property Broadcast
SVN Live 6.3.24 Weekly Property Broadcast
 
Deutsche EuroShop | Company Presentation | 06/24
Deutsche EuroShop | Company Presentation | 06/24Deutsche EuroShop | Company Presentation | 06/24
Deutsche EuroShop | Company Presentation | 06/24
 
Elegant Evergreen Homes - Luxury Apartments Redefining Comfort in Yelahanka, ...
Elegant Evergreen Homes - Luxury Apartments Redefining Comfort in Yelahanka, ...Elegant Evergreen Homes - Luxury Apartments Redefining Comfort in Yelahanka, ...
Elegant Evergreen Homes - Luxury Apartments Redefining Comfort in Yelahanka, ...
 

HCMC Quarterly Knowledge Report | Q1 2016

  • 1. Accelerating success www.colliers.com/vietnam HO CHI MINH CITY QUARTERLY KNOWLEDGE REPORT Q1 2016
  • 2. TABLE OF CONTENTS ECONOMIC OVERVIEW............................................................................................................... VIETNAM .................................................................................................................................... HO CHI MINH CITY ...................................................................................................................... HA NOI ........................................................................................................................................ HO CHI MINH CITY MARKET OVERVIEW ........................................................................ OFFICE ........................................................................................................................................ RETAIL ........................................................................................................................................ CONDOMINIUM ............................................................................................................................ VILLA & TOWNHOUSE ................................................................................................................. SERVICED APARTMENT .............................................................................................................. INDUSTRIAL ................................................................................................................................ Cover Page: Saigon Skyline 4-5 4 5 5 6-18 6 9 11 13 15 17 Page
  • 3. LIST OF FIGURES Figure 1: Vietnam GDP ..................................................................................................................... Figure 2: Interest Rate and Exchange Rate of Vietnam ...................................................................... Figure 3: FDI Capital of HCMC and Hanoi .......................................................................................... Figure 4: GDP Growth Rate of HCMC and Hanoi ................................................................................ HO CHI MINH CITY MARKET OVERVIEW Figure 5: Office, Net Absorption ......................................................................................................... Figure 6: Office, Occupancy Rate ....................................................................................................... Figure 7: Retail, Market Performance................................................................................................... Figure 8: Retail, Average Asking Rent ................................................................................................ Figure 9: Retail, Supply by District ................................................................................................... Figure 10: Condominium, Sold Units................................................................................................... Figure 11: Condominium, Average Asking Rent by Segment ................................................................ Figure 12: Condominium, Q-o-Q and Y-o-Y Changes in Asking Price .................................................. Figure 13: Villa and Townhouse, Supply by Year ................................................................................. Figure 14: Villa and Townhouse, Current Supply by District ................................................................ Figure 15 Villa and Townhouse, Changes in Asking Price..................................................................... Figure 16: Serviced Apartment, Current Grade A&B Supply ................................................................ Figure 17: Serviced Apartment, Average Asking Rent by Grade ........................................................... Figure 18: Industrial, Net Absorption .................................................................................................. Figure 19: Industrial, Supply by District .............................................................................................. LIST OF TABLES Table 1: Macroeconomic Indicators of HCMC and Hanoi ...................................................................... Table 2: Office, Future Supply ............................................................................................................ Table 3: Significant Office Projects .................................................................................................... Table 4: Significant Retail Projects .................................................................................................... Table 5: Condominium, Significant new Projects launched in Q1 2016 ................................................ Table 6: Villa and Townhouse, Significant new Projects launched in Q1 2016 ...................................... Table 7: Serviced Apartment, Significant Future Projects under construction ...................................... Table 8: Significant Serviced Apartment Projects ............................................................................... Table 9: Industrial, Future Supply ....................................................................................................... Table 10: Industrial, Market Overview ................................................................................................ 4 4 5 5 6 6 9 9 9 11 11 11 13 13 13 15 15 17 17 5 6 7 10 12 14 15 16 17 18 Page
  • 4. GDP Vietnam’s GDP has grown 5.46% in Q1 2016. This was a noticeable reduction from a rate of 6.12% in Q1 2015 but still higher than GDP growth rate of the same periods in 2012, 2013 and 2014. The three main compositions of the GDP which are agriculture–forestry-fishery, industry-construction and services had growth rates of -1.23%, 6.72% and 6.13% y-o-y respectively. Financial, banking and insurance sectors increased slightly over the same period, reaching 5.99%. Real estate trading rose 3.43% y-o-y which achieved the highest growth rate from 2012 to date. CPI In Q1 2016, the Consumer Price Index (CPI) increased 1.25% y-o-y while the core CPI grew 1.76% y-o-y. Factors that contributed to the increase in CPI in Q1 2016 were an upward in energy prices on the world market and the El Nino’s impact in Vietnam which cut down the supply and inflated up the price of livestock and agricultural products such as rice or sugarcanes. An increase in health care fees scheduled in July 2016 and school fees scheduled in September 2016 would expectedly push the CPI to increase even higher in the coming quarters. FDI As of 20th March, there have been about 473 new foreign investment projects in Vietnam with total registered investment worth USD2.74 billion, an increase of 125.2% y-o-y. In addition, 203 other projects registered to increase its investment by USD1.285 billion, an increase of 107% compared to the same period last year. In total, foreign investment in the first quarter of 2016 reached USD4.02 billion, up 119.1% compared to Q1-2015. Disbursement from FDI projects also grew 14.8% over last year’s period with USD3.5 billion were paid out. RETAIL SALES Vietnam’s retail sales of goods and services in Q1 2016 achieved USD38.2 billion, a 0.99% increase compared to Q4-2015 and 9.1% y-o-y growth (or 7.9% y-o-y growth if price increase is excluded). The proportions of four main compositions are as follows: retail sales 76.4%, accommodation and catering services 11.3%, travel 0.8% and other services 11.5%. The four sectors all witnessed significant growths compared to last year’s periods, which were 9.2%, 8.5%, 8.8% and 8.9% y-o-y respectively. INTERNATIONAL ARRIVALS The number of international visitors to Vietnam in Q1 2016 reached 2.459 million, 19.9% increase y-o-y. China and Korea were the two countries which accounted for highest number of visitors to Vietnam in the review period with 580,000 and 408,100 visitors respectively. EXCHANGE RATE In contrast to the intense volatility in 2015, the exchange rate USD/VND in the first quarter of 2016 was relatively calm. The exchange rate did not increase as many predicted in 2015, but decreased slightly from VND22,500 to around VND22,382 VND per USD1. The stability of the exchange rate in recent months has been partly contributed by favorable condition on the international financial market. According to forecasts of the International Monetary Fund (IMF), world economic growth trends have been slowed and this would further contribute to the slowing of the Fed’s rate hikes in the coming months. In the next quarters, if the dollar does not rise sharply and the Yuan is not significantly devalued, pressure on the exchange rate USD/USD in 2016 should not be too big. Q1 2016 | ECONOMIC OVERVIEW ©2016 Colliers International Research VIETNAM QUARTERLY KNOWLEDGE REPORT Page 4 Q2 2016 forecast Figure 1: Vietnam GDP Source: World Bank | Colliers International Research Figure 2: Interest rate and Exchage rate of Vietnam Source: Asian Development Bank (ADB) | Colliers International Research VIETNAM 0 500 1,000 1,500 2,000 2,500 0 1 2 3 4 5 6 7 8 2005 2006 2007 2008 2009 2010 2011 2012 2013 2014 2015 Q1 2016 USD/capita % GDP per capita (nominal) GDP growth rate 10,000 12,000 14,000 16,000 18,000 20,000 22,000 24,000 4 5 6 7 8 9 10 11 12 13 14 2005 2006 2007 2008 2009 2010 2011 2012 2013 2014 2015 Q1 2016 VND/USD %perannum Interst Rate Exchange Rate
  • 5. Q1 2016 | ECONOMIC OVERVIEW ©2016 Colliers International Research VIETNAM QUARTERLY KNOWLEDGE REPORT Page 5 Figure 4: GDP Growth Rate of HCMC and Hanoi Source: General Statistics Office | Colliers International Research Source: General Statistics Office | Colliers International Research Table 1: Marcoeconomic Indicators of HCMC and Hanoi HCMC Hanoi Q1 2016 Q2 2016F Q1 2016 Q2 2016F GDP (billion) 9.86 5.33 FDI (million) 275.3 269.6 Retail sales (billion) 7.78 5.29 Export (billion) 6.69 2.56 Import (billion) 7.87 5.72 HO CHI MINH CITY The Gross Regional Domestic Product (GRDP) of Q1 2016 achieved USD9.9 billion, an increase of 7.1% y-o-y. In more detail, the services sector had the highest growth rate of 7.8%, reaching USD5.7 billion. The industrial and construction sector came second with a growth rate of 6.25%, equivalent to USD2.7 billion. The agriculture-forestry-fishery sector achieved USD79 million, up 5.8% y-o-y. Total newly registered and supplementary FDI reached USD275.3 million. There are 147 new projects worth of USD190.3 million and 36 supplementary projects worth of USD 85 million. The amount of FDI of Q1 2016 significantly decreased, equivalent to 18.5% q-o-q and 49.5% y-o-y. This is a downside for HCMC as in the same period Vietnam witnessed an increase of 125.2% y-o-y in FDI. Three nations with the highest new capital investments are Japan, Singapore and Korea, accounting for 34.4%, 22.3% and 7% of the FDI respectively. Total retail sales of consumer goods and services reached USD7.8 billion, up 11.6% y-o-y. The four compositions, namely retail sales, accommodation & catering, travelling services and other services, accounted for 79.2%, 12.1%, 2.4% and 6.4% of the total sales of goods consequentially. Compared to the same period last year, travelling services had the highest growth rate of 14.4% while accommodation and catering had a slowest growth rate of 6.8%. Consumer Price Index (CPI) had a growth rate of -0.03%, 0.05% and 0.09% from January to March subsequently which pushed the CPI of Q1 2016 to 0.11%. Export values were USD 6.688 billion, equivalent to an increase of 0.1% q-o-q. Import values were USD7.873 billion equivalent to a growth of 8.2% y-o-y. In the previous quarter, the values of export and import were USD363 million and USD417.8 million respectively. HANOI The GRDP in Q1-2016 achieved USD5.3 billion which was equivalent to a rise of 6.95% y-o-y. Industrial & construction sector had the highest growth rate of 7.54% which was followed by growth rate of 7.05% y-o-y of services sector. In contrast, Agricultural-forestry-fishery industry suffered a negative growth rate of -0.69% y-o-y. The CPI in January and February climbed to 0.12% and 0.47% m-o-m. The Statistical Office of Hanoi did not publish CPI for March but it was reported to be slightly increased from February level. Compared with the previous quarter, the CPI of the Q1 2016 would be much higher due to increases in prices of energy and agricultural products. The city attracted USD269.6 million of new and supplementary FDI capital in the first quarter of 2016. Total retail sales of consumer goods and services extended 9% y-o-y to achieve USD5.3 billion. Compared with the previous quarter, this was a drop of 11.5%. Export values went up 2.3% y-o-y to achieve USD2.558 billion. Import values were USD5.715 billion which experienced a moderate reduction of -2% y-o-y. This brought about a trade deficit of USD3.157 billion in the review quarter. In Q1 2016, the capital city welcomed 761,000 tourists. This was a remarkable uptrend of 28.7% y-o-y. Figure 3: FDI Capital of HCMC and Hanoi Source: General Statistics Office | Colliers International Research 6% 8% 10% 12% 14% 2005 2006 2007 2008 2009 2010 2011 2012 2013 2014 2015 Q1 2016 HCMC Hanoi 0 500 1000 1500 2000 2500 3000 Q1 Q2 Q3 Q4 Q1 Q2 Q3 Q4 Q1 Q2 Q3 Q4 Q1 Q2 Q3 Q4 Q1 2012 2013 2014 2015 2016 millionUSD HCMC Hanoi
  • 6. Figure 6: Office, Occupancy Rate PERFORMANCE Rental growth across all grades was recorded in the review quarter. Grade A’s average net asking rents increased 1.92% q-o-q, staying at USD40.5/sqm/month while those of Grade B surged 5.1% q-o-q, reaching USD22.07/sqm/month. Average occupancy rate witnessed downward trend over the quarter but maintained at a high rate of 93.4%. Grade A and Grade B’s occupied rate were 92.3% and 94.8%, down 3.1% and 1.86% q-o-q respectively. SUPPLY No new office building entered the market in the first quarter of 2016. The supply pipeline remained stable with 11 Grade A and 57 Grade B office buildings, providing approximately 1,331,347 sqm GFA. Grade B will domininate new supply in the next quarters with nearly 77,000sqm NLA from 4 projects. Despite having no additional buildings this year, Grade A stock will grow substantially in the next two years. By the end of 2018, the market is expected to welcome 4 more Grade A office buildings which are Deutsches Haus, Saigon Centre (Phase 2), Saigon One Tower and The One, providing nearly 172,859sqm NLA. DEMAND As a result of stronger FDI inflow to the city, the growing number of foreign enterprises will continue to drive office demand. This type of tenants would have distinctive enquiries such as green buildings with good access to natural light and energy efficiency, contiguous floor plates of larger than 1,000 sqm, prime locations with accessibility to public transport and staff amenity or close proximity to clients and brand profile. Landlords should be strategic to statisfy sophisticated leasing requirements from clients. OUTLOOK As there is a current drought of premium office stock, landlords are gaining confidence in offering higher rents and pushing back incentives. High quality assets are expected to achieve a rent growth up to 10%. With prime locations and in close proximity of traffic hubs, CBD office buildings continue to be highly sought-after. Decentralised districts with well-established infrastructure and traffic system such as District 7 and Thu Thiem new urban area will become alternative options for tenants looking for large contiguous floor plates. Q1 2016 | HO CHI MINH CITY | OFFICE ©2016 Colliers International Research VIETNAM QUARTERLY KNOWLEDGE REPORT Page 6 Table 2: Office, Future Supply Source: Colliers International Research Source: Colliers International Research Source: Colliers International Research Figure 5: Office, Net Absorption -10,000 0 10,000 20,000 30,000 40,000 Q1 Q3 Q1 Q3 Q1 Q3 Q1 201320142015 20 16 sq m Grade B Grade A 0 10 20 30 40 50 60 70 80 90 100 Q1 Q2 Q3 Q4 Q1 Q2 Q3 Q4 Q1 Q2 Q3 Q4 Q1 Q2 Q3 Q4 Q1 Q2 Q3 Q4 Q1 2011 2012 2013 2014 2015 2016 Grade A Grade B% Project name Grade NLA sqm Expected Completion Hai Quan Tower A 30,000 2016 SGGP Building B 16,940 2016 HQC Royal Tower B 22,500 2016 Deutsches Haus A 24,900 2017 Saigon Center Phase 2 A 40,000 2017 Mapletree Business Center B 30,000 2017 E-Town Central B 34,000 2017
  • 7. Q1 2016 | HO CHI MINH CITY | OFFICE ©2016 Colliers International Research VIETNAM QUARTERLY KNOWLEDGE REPORT Page 7 (*) US$/sqm/month (NLA) Table 3: Significant Office Projects No Name Address Completion Year NLA (sqm) Service Charges (*) Occupancy rate Average asking rent (**) 1 Saigon Centre 65 Le Loi 1996 11,650 9.0 99% 45.0 2 Saigon Tower 29 Le Duan 1997 13,950 8.0 99% 46.0 3 Sunwah Tower 115 Nguyen Hue 1997 20,800 8.0 98% 48.0 4 The Metropolitan 235 Dong Khoi 1997 15,200 8.0 90% 47.0 5 Diamond Plaza 34 Le Duan 1999 15,936 8.0 77% 45.0 6 Kumho Asiana Plaza 39 Le Duan 2009 26,000 8.0 89% 43.0 7 Bitexco Financial Tower 45 Ngo Duc Ke 2010 37,710 8.0 96% 34.0 8 President Place 93 Nguyen Du 2012 8,330 7.0 98% 42.0 9 Times Square 22-36 Nguyen Hue 2012 12,704 7.0 72% 40.0 10 Le Meridien 3C Ton Duc Thang 2013 9,125 6.0 94% 29.0 11 Vietcombank Tower 5 Me Linh Square 2015 41,250 7.0 95% 37.0 Grade A 212,655 7.7 92.3% 40.5 1 VTP-OSIC 8 Nguyen Hue 1993 6,500 6.5 98% 25.0 2 Yo Co Building 41 Nguyen Thi Minh Khai 1995 5,000 3.0 100% 23.0 3 Somerset Chancellor Court 21-23 NguyenThi Minh Khai 1996 3,200 5.0 100% 22.0 4 Central Plaza 17 Le Duan 1997 6,094 6.5 93% 24.0 5 Harbour View Tower 35 Nguyen Hue 1997 8,000 5.0 77% 20.0 6 Saigon Riverside Office 2A-4A Ton Duc Thang 1997 10,000 5.0 100% 28.0 7 Saigon Trade Center 37 Ton Duc Thang 1997 31,416 6.5 71% 24.0 8 MeLinh Point Tower 2 Ngo Duc Ke 1999 17,600 6.0 99% 27.0 9 Zen Plaza 54-56 Nguyen Trai 2001 11,037 7.0 86% 29.0 10 Bitexco Building 19-25 Nguyen Hue 2003 6,000 6.0 92% 27.0 11 The Landmark 5B Ton Duc Thang 2005 8,000 8.0 100% 27.0 12 Opera View 161-167 Dong Khoi 2006 3,100 7.0 100% 27.0 13 City Light 45 Vo Thi Sau 2007 10,000 5.0 100% 19.0 14 Petro Tower 1-5 Le Duan 2007 13,304 9.0 94% 35.0 15 The Lancaster 22 – 22 Bis Le Thanh Ton 2007 7,000 5.0 90% 25.0 16 CJ Building 5 Le Thanh Ton 2008 14,000 8.0 97% 29.0 17 Continential Tower 81-85 Ham Nghi 2008 15,000 6.0 98% 22.0 18 Havana Tower 132 Ham Nghi 2008 7,326 8.0 81% 31.0 19 Royal Center 235 Nguyen Van Cu 2008 14,320 6.0 100% 23.0 20 Sailing Tower 51 Nguyen Thi Minh Khai 2008 16,910 6.0 100% 26.0 21 TMS 172 Hai Ba Trung 2009 4,000 4.0 100% 24.0 22 A&B Tower 76 Le Lai 2010 17,120 6.0 95% 29.0 23 Bao Viet Tower 233 Dong Khoi 2010 10,650 5.0 100% 22.0 24 Green Power Tower 35 Ton Duc Thang 2010 15,600 6.0 99% 25.0 25 Maritime Bank Tower 192 Nguyen Cong Tru 2010 19,596 5.0 84% 22.0 26 Saigon Royal 91 Pasteur 2010 5,340 6.0 100% 23.0 27 Vincom Center 68 -70 -72 Le Thanh Ton 2010 56,600 7.0 94% 32.0 28 Empress Tower 138 Hai Ba Trung 2012 19,538 6.0 100% 30.0 29 Lim Tower 9-11 Ton Duc Thang 2013 22,000 6.0 99% 28.0 30 MB Sunny Tower 259 Tran Hung Dao, Co Giang 2013 13,200 6.0 99% 23.0 31 Lim Tower 2 Vo Van Tan 2015 8,400 5.5 100% 24.0 Grade B 405,851 6.2 93.8% 26.6
  • 8. Q1 2016 | HO CHI MINH CITY | OFFICE ©2016 Colliers International Research VIETNAM QUARTERLY KNOWLEDGE REPORT Page 8 SAIGON SKYLINE REVIEW- CBD HCMC GRADE A OFFICE BUILDINGS KUMHO ASIANA PLAZA 39 Le Duan, District 1 26,000/1,402 $ 43.00 $ 8.00 DIAMOND PLAZA SAIGON 34 Le Duan, District 1 15,936/2,200 $ 45.00 $ 8.00 LE MERIDIEN 3C Ton Duc Thang, District 1 9,125/NA $ 29.00 $6.00 SAIGON TOWER 29 Le Duan, District 1 13,950/NA $ 46.00 $ 8.00 DEUTSCHES HAUS 3-5 Le Van Huu, District 1 THE METROPOLITAN 235 Dong Khoi, District 1 15,200/1,000 $ 47.00 $ 8.00 PRESIDENT PLACE 93 Nguyen Du, District 1 8,330/1,000 $ 42.00 $ 7.00 BITEXCO FINANCIAL TOWER 45 Ngo Duc Ke, District 1 37,710/900-1,300 $ 34.00 $ 8.00 VIETCOMBANK TOWER 5 Me Linh Square, District 1 41,250/NA $ 37.00 $ 7.00 TIMES SQUARE SAIGON 22-36 Nguyen Hue, District 1 12,704/1,450 $ 40.00 $ 7.00 SAIGON CENTRE 65 Le Loi, District 1 11,650/ 1,073 $ 45.00 $ 9.00 SUNWAH TOWER 115 Nguyen Hue, District 1 20,800/ 1,166 $ 48.00 $ 8.00
  • 9. Q1 2016 | HO CHI MINH CITY | RETAIL ©2016 Colliers International Research VIETNAM QUARTERLY KNOWLEDGE REPORT Page 9 Figure 9: Retail, Total supply PERFORMANCE Lower rental rate in suburban areas resulted in a drop of 2% q-o-q and 10% y-o-y in the average net asking rent across all segments. Department stores and retail podiums maintained their rents while shopping centers was down 3% q-o-q in rents, averaging at USD44/sqm/month. Average occupancy rate decreased 1.5% q-o-q, staying at 91.6% as some newly-opened retail projects have not fill up their vacant space. SUPPLY Three new shopping centers in suburban area have come online The retail stock increased 65,400sqm NLA with the opening of two new shopping centers in suburban districts. Vingroup has made all efforts to expand their retail network in every district in Ho Chi Minh City. While Vincom Le Van Viet marks Vingroup’s first presence in District 9, Vincom Plaza Go Vap is their second retail project in the highly-populated Go Vap District. To date, they have owned 6 retail properties across the city, providing more than 200,000sqm NLA. DEMAND Food and beverage (F&B) tenants is expected to be the main driver that will support the performance of HCMC’s retail market in the short to medium term. McDonald, Starbucks, Subway, KFC and Burger King are a few international names that are growing their empires in the local market. These retailers tend to sercure prime locations in a retail center to easily catch the eyes of customers and lower the chance of their competitors. OUTLOOK The supply pipeline of shopping malls will grow bigger when Saigon Center Phase II and Aeon Mall Binh Tan will come online in the next quarters of 2016. The two new shopping centers will bring more foreign brands to the local market, creating intense competition between Vietnam and international retailers. Given abundant new supply, low quality retail properties need to be repositioning to avoid downtrend in rents and occupancy rates. Figure 8: Retail, Average Asking rent Source: Colliers International Research Source: Colliers International Research Figure 7: Retail, Market performance Source: Colliers International Research 13 21 14 0 50 100 150 200 250 300 350 Retail Podium Department Store Shopping Centre USD/sqm/month Min average asking rent Max average asking rent 0 10 20 30 40 50 60 70 80 90 100 90% 92% 94% 96% 98% 100% Podium Department store Shopping centre USD/sqm/month Average asking rent Average occupancy 0 100,000 200,000 300,000 400,000 500,000 600,000 700,000 800,000 2010 2011 2012 2013 2014 2015 2016YTD NLA(sqm)
  • 10. Q1 2016 | HO CHI MINH CITY | RETAIL VIETNAM QUARTERLY KNOWLEDGE REPORT ©2016 Colliers International Research Page 10 Table 3: Significant Office Projects (*) ARR (Average Rental Rate): All rents are stated in net rents per sqm, inclusive service charge but exculding VAT Table 4: Significant Retail Projects No Name of Project/Building Address Location Completion Year NLA (sq m) ARR (*) Occupancy Rate 1 Hotel Continental Sai Gon 132-134 Dong Khoi District 1 2000 200 90 100.0% 2 Caravelle Hotel 19 Lam Son Square District 1 2000 150 220 100.0% 3 New World Hotel 76 Le Lai District 1 2000 1,000 60 100.0% 4 Sheraton Saigon 88 Dong Khoi District 1 2002 750 200 100.0% 5 Opera View Lam Son Square District 1 2006 1,260 200 100.0% 6 The Manor 1 91 Nguyen Huu Canh Binh Thanh 2006 2,000 14 83.0% 7 Saigon Pearl 92 Nguyen Huu Canh Binh Thanh 2009 5,000 25 100.0% 8 Rex Arcade 141 Nguyen Hue District 1 2010 2,000 120 100.0% 9 The Manor 2 91 Nguyen Huu Canh Binh Thanh 2010 2,500 13 92.0% 10 Bitexco Financial Tower 45 Ngo Duc Ke District 1 2011 8,000 55 95.0% 11 The Vista Walk Hanoi Highway District 2 2012 10,000 13 80.0% 12 President Place 93 Nguyen Du District 1 2012 800 60 100.0% 13 Times Square 22-36 Nguyen Hue District 1 2012 9,000 300 97.0% 14 Saigon Airport Plaza 1 Bach Dang Tan Binh 2013 7,623 15 100.0% Retail Podium 50,283 87 94.0% 1 Zen Plaza 54-56 Nguyen Trai District 1 2001 6,817 58 100.0% 2 Parkson Hung Vuong Plaza 126 Hung Vuong District 5 2007 24,000 60 99.0% 3 Kumho Asiana Plaza 35 Le Duan District 1 2009 6,830 60 100.0% 4 Parkson Flemington 184 Le Dai Hanh District 11 2009 26,000 25 90.0% 5 Parkson Paragon 3 Nguyen Luong Bang District 7 2011 7,500 40 90.0% 6 Parkson C.T Plaza 60A Truong Son Tan Binh 2012 12,235 21 95.0% 7 Parkson Cantavil Premier Hanoi Highway District 2 2013 17,815 38 97% 8 Taka Plaza 102 Nam Ky Khoi Nghia District 1 2011 1,000 70 70.0% Department Store 102,197 41.0 95.0% 1 Diamond Plaza 34 Le Duan District 1 1999 9,000 90 100.0% 2 Parkson Saigontourist Plaza 35 Le Thanh Ton District 1 2002 17,000 90 99.0% 3 Saigon Center 35 Nam Ky Khoi Nghia District 1 1996 Renovation Renovation Renovation 4 City Plaza 102 Nam Ky Khoi Nghia District 1 2000 Renovation Renovation Renovation 5 Superbowl Vietnam TSN 38 Nguyen Hue Tan Binh 2002 5,500 20 98.0% 7 An Dong Plaza 18 An Duong Vuong District 5 2004 18,000 40 99.0% 8 Saigon Square 1 77-89 Nam Ky Khoi Nghia District 1 2006 1,300 167 100.0% 9 Nowzone 235 Nguyen Van Cu District 1 2008 9,000 55 100.0% 10 Lotte Mart Saigon South 469 Nguyen Huu Tho District 7 2008 24,000 50 100.0% 12 Vincom Center B 72 Le Thanh Ton District 1 2010 45,000 150 100.0% 13 Maximark 3/2 Extention 3/2 Street District 10 2010 25,000 35 90.0% 14 Lotte Mart Phu Tho Le Dai Hanh District 11 2010 24,500 30 99.0% 15 Crescent Mall Nguyen Van Linh District 7 2011 45,000 26 100.0% 16 Satra Pham Hung Pham Hung District 8 2011 11,528 14 100.0% 17 CMC Plaza 79B Ly Thuong Kiet Tan Binh 2011 Renovation Renovation Renovation 18 Union Square Dong Khoi District 1 2012 38,000 300 New opening Shopping Centre 272,828 96 99.0%
  • 11. Accelerating success Q1 2016 | HO CHI MINH CITY | CONDOMINIUM VIETNAM QUARTERLY KNOWLEDGE REPORT ©2016 Colliers International Research Page 11 Table 3: Significant Office Projects Figure 12: Condominium, Q-o-q and Y-o-y changes in asking price PERFORMANCE In the first quarter of 2016, more than 9,000 units were sold across all segments, up 3.43% y-o-y. It is forecasted that throught out 2016, approximately 57,500 units will be available for sale. High-end and mid-end segments account for more than 70% of the market share. Sale rate of mid-end segment grew 16% y-o-y while affordable segment declined 18.9% y-o-y. In the coming quarters, the market share of high-end segment will see more challenge from mid-end segment. SUPPLY In Q1-2016, it is estimated that 12,760 new units were launched for sale. Eastern and Southern areas account for majority of new units supplied. Condominium market is expected to continually increase both in quantity and quality. Developers nowadays have to take part in intense competitions for potential buyers. Apart from prime location, high-end developers have come up with unique amenities and concept such as cruise habour, waterfall infinity pool, artificial sea or hanging gardens, while mid-end and affordable segments have competitively provided offers such as low construction density as well as associated public services such as internal parks, schools and sport centers. DEMAND Across all segments, buyers tend to be more selective in spending their money. Branding of a developer and its ability in assuring a project’s quality and progress are key factors considered by potential buyers. Units with 1 or 2 bedrooms and price less than USD1,000/sqm are in excessive demand from end-users. Demand for affordable segment seems very high and is predicted to be grown steadily in the future. OUTLOOK Improved infrastructure provides better connection between areas of the city as well as shorten the distance to the CBD. This helps to increase the demand and the price of projects in outer city areas. In addition, the new Law on Housing which permits foreigners to purchase up to 30% of the total number of apartments in a residential apartment project expects to boost sales further. Nevertheless, condominium has one of the highest proportions of speculation among different segments of real estate market. It is therefore vulnerable to government policies and credit growth. Source: Colliers International Research Figure 10: Condominium, Sold units Source: Colliers International Research Source: Colliers International Research Figure 11: Condominium, Average asking price by segment 0 5000 10000 15000 20000 25000 30000 35000 40000 2006 2007 2008 2009 2010 2011 2012 2013 2014 2015 Q1 2016 units 0 1,000 2,000 3,000 4,000 5,000 Luxury High-end Mid-end Affordable US$/sqm Average primary price Average secondary price 0.0% 2.0% 4.0% 6.0% 8.0% 10.0% Primary market Secondary market q-o-q changes y-o-y changes
  • 12. Accelerating success Q1 2016 | HO CHI MINH CITY | CONDOMINIUM VIETNAM QUARTERLY KNOWLEDGE REPORT ©2016 Colliers International Research Page 12 Table 5: Condominium, Significant new projects launched in Q1 2016 No Name of Project/Building Developer Location Completion Year Number of units Asking Price (US$/sqm) 1 9 view Apartment Hung Thinh District 9 2018 690 720 2 M-One Nam Saigon Thao Dien Investment District 7 2017 963 1,100 3 Vinhomes Park Paroma VinGroup Binh Thanh 2017 430 1,900 4 Opal Riverside Dat Xanh Group Thu Duc 2017 626 970 5 Dat Gia Residence Dat Gia Real Estate Thu Duc 2017 1,034 800 6 Vinhomes Golden River Bason VinGroup District 1 2018 3,000 4,000-5,000 7 Vinhomes Central Park - P7 VinGroup Binh Thanh 2017 893 1,600-1,800 8 Samland Riverside Sacomreal Binh Thanh 2018 138 1,300 9 Sunriver Usilk TGT District 7 2017 136 1,100 10 De Capella Quoc Cuong Gia Lai District 2 2018 380 1,400 11 The Avila Thai Bao District 8 2017 285 700 12 Xi Grand Court Phu Son Thuan District 10 2017 748 1,400 13 Kris Vue CapitaLand District 2 2018 128 1,300 14 Viva Riverside Vietcomreal District 6 2018 567 1,200 15 Scenic Valley 2 Phu My Hung District 7 2017 248 1,500 16 Luxury Home Sacomreal District 7 2018 250 1,000 17 Top Life TIEXIM District 10 2018 84 2,200 18 Sarina Dai Quang Minh District 2 2016 233 1,750 19 Madison NovaLand District 1 2018 109 5,000-6,000 20 Hung Phat Golden Star Hung Loc Phat District 7 2018 478 1,300 21 I-Home Xa Lo Ha Noi C.T Group District 9 2017 431 700 22 Botanica Premier NovaLand Tan Binh 2018 909 1,600 New launches in Q1 2016 12,760 * Excluding all kinds of tax, promotions and management fee The information is updated as at the end of Q1 2016
  • 13. Accelerating success Q1 2016 | HO CHI MINH CITY | VILLA & TOWNHOUSE VIETNAM QUARTERLY KNOWLEDGE REPORT ©2016 Colliers International Research Page 13 PERFORMANCE The villa and townhouse segment performed well in Q1 2016 thanks to a warming property market and stable macroeconomic factors. Prices continued to go up an average 1-2% q-o-q. The transaction volume went down 24% q-o-q due to a shortage in supply of affordable segment. SUPPLY Four notable projects offered 486 new villas and townhouses to the market. Future supply is expected to grow strongest in Eastern and Souther areas of HCMC this year while the western area has high potential to develop in the longer term. DEMAND Ho Chi Minh City is home of three million immigrants. The city also welcomes 50,000 newly married couples every year. Certain proportions of these people might want to settle in the city in their own house and would become potential clients of villa and townhouse market. Hence, the demand for the market is maintained high and stable over years. For mid-end and high-end segments, buyers prefer projects with well-developed infrastructure, good traffic system and transparent legal status. Similar to condominium market, low-priced, small area houses in suburban seem to have highest demand from the market. OUTLOOK Free trade agreements such as the TPP would bring about an inflow of foreign investors, specialists, management teams to Ho Chi Minh City. This, accompanied with the new Housing Law which permits foreigners to purchase up 250 separate houses in a project where the population is equivalent to a ward, would expect to increase the demand for villas and townhouses. Districts 2 and District 9 in the East, District 7 and Nha Be in the South are forecasted to continue to dominate the market while the Western area have high potential to grow in the future. Figure 13: Villa and Townhouse, Supply by Year Source: Colliers International Research Figure 14: Villa and Townhouse, Current Supply by District Source: Colliers International Research Figure 15: Villa&Townhouse, Changes in asking price Source: Colliers International Research 0.0% 1.0% 2.0% 3.0% 4.0% 5.0% Primary market Secondary market q-o-q changes y-o-y changes 0 200 400 600 800 Dist. 9 Dist. 2 Go Vap Nha Be Dist. 7 Binh Thanh Thu Duc Dist. 12 Binh Tan Binh Chanh dwellings No. of townhouses No. of villas 0 1000 2000 3000 4000 5000 6000 7000 8000 2002 2003 2004 2005 2006 2007 2008 2009 2010 2011 2012 2013 2014 2015 Q1 2016 Existing supply New supply units
  • 14. Accelerating success Q1 2016 | HO CHI MINH CITY | VILLA & TOWNHOUSE VIETNAM QUARTERLY KNOWLEDGE REPORT ©2016 Colliers International Research Page 14 Table 6: Villa and Townhouse, Significant new projects launched in Q1 2016 No Name of Project/Building Developer Location Completion Year Number of units Asking Price (US$/sqm) 1 The Manera Khang Dien Tu Van Quoc Te District 9 N/A 54 1,800 2 Saroma Villa Dai Quang Minh District 2 2016 177 N/A 3 The Venica Khang Dien District 9 2016 43 500-1,500 4 Camelia Gardern Nam Long Group Binh Chanh 2016 212 1,282-1,851 New launches in Q1 2016 486
  • 15. Accelerating success Q1 2016 | HO CHI MINH CITY | SERVICED APARTMENT VIETNAM QUARTERLY KNOWLEDGE REPORT ©2016 Colliers International Research Page 15 PERFORMANCE Grade A’s average occupancy rate remained unchanged over the quarter, reaching 86.4%. The average gross asking rent recorded a drop of 2.61ppts q-o-q, staying at USD29.9/sqm/ month. Grade B had the best performance in the review quarter. Average occupancy rate increased to 88.2%, up 0.45ppts while rental rate saw an improvement of 1.35ppts, averaging at USD22.4/sqm/month. SUPPLY The existing stock was stable with approximately 4,100 units from 80 projects. Due to well-establised public facilities and amenities, the CBD is home of more than 40% of total serviced apartments. New supply from now until end of 2017 will grow substantially with approximately 1,459 units. It is notable that five out of seven significant future projects is located in District 1 and District 3. To meet current demand from single tenants, the proportion of one-bedroom and two-bedroom units tend to be increased in newly launched developments. DEMAND Serviced apartments in the CBD are typically preferred by professional singles due to its close proximity to their workplace. District 2 and District 7 are attractive for expatriate families as these two locations can provide large size accommodation together with social amenities such as international schools, hospitals, shopping malls, etc. It is observed that District 2 with peaceful riverside environment is popular for Westerners while District 7 is a hot spot for Asian community. OUTLOOK Demand for serviced apartments will be strengthen in the long term after Vietnam joined Trans Pacific Partnership and Asean Economic Community, leading to the growing number of foreign workforce. Despite solid demand, this market segment have to compete with buy-to-let apartments and private houses where offering competitive rents for long-term stays. To maintain healthy occupancy rates, landlords need to adjust rents and consolidate their services when new completions enter the market expatriates and MNCs. Project name District Grade Total units Expected Completion Sila Urban Living 3 B 217 2Q 2016 Ascott Waterfront Saigon 1 A 222 3Q 2016 Saigon Plaza 1 B 119 4Q 2016 New Pearl 3 B 120 4Q 2016 Saigon South Place 7 A 480 2017 Saigon Center Phase 2 1 A 216 2017 Berkley Service Residence 2 B 85 2017 Table 7: Serviced apartment, Significant future projects under construction Source: Colliers International Research Figure 16: Serviced Apartment, Current grade A&B supply Source: Colliers International Research Figure 17: Serviced Apartment, Average asking rent by grade Source: Colliers International Research 0 1,000 2,000 3,000 4,000 2010 2011 2012 2013 2014 2015 Q1 2016 units Grade A Grade B 15 20 25 30 35 2010 2011 2012 2013 2014 2015 Q1 2016 US$/sqm/month Grade A Grade B
  • 16. Accelerating success Q1 2016 | HO CHI MINH CITY | SERVICED APARTMENT VIETNAM QUARTERLY KNOWLEDGE REPORT ©2016 Colliers International Research Page 16 Table 8: Significant Serviced Apartment Projects No. Project Name Address Location Completion Year Total Room Average Occupancy ARR(*) (**) 1 The Landmark 5B Ton Duc Thang District 1 1995 66 95.0% 26 2 Sedona Suites 65 Le Loi District 1 1996 89 89.0% 30 3 Somerset Chancellor Court 21-23 Nguyen Thi Minh Khai District 1 1996 172 96.0% 34 4 Nguyen Du Park Villas 111 Nguyen Du District 1 2004 41 98.0% 30 5 The Lancaster 22-22 Bis Le Thanh Ton District 1 2007 55 73.0% 37 6 Intercontinental Asian Saigon 39 Le Duan District 1 2009 260 95.0% 36 Grade A 683 92.9% 33.5 1 Norfork Mansion 17-21 Ly Tu Trong District 1 1998 126 85.0% 26 2 Saigon Sky Garden 20 Le Thanh Ton District 1 1998 154 85.0% 26 3 Somerset HCM 8A Nguyen Binh Khiem District 1 1998 165 94.0% 26 4 Diamond Plaza 34 Le Duan District 1 1999 42 95.0% 29 5 Garden View Court 101 Nguyen Du District 1 2000 76 91.0% 31 6 Ben Thanh Luxury 172-174 Ky Con District 1 2010 88 91.0% 18 7 Lafayette De SaiGon 8 Phung Khac Khoan District 1 2010 18 89.0% 28 8 Vincom Center 45A Ly Tu Trong District 1 2010 60 34.0% 26 9 Nikko Saigon 235 Nguyen Van Cu District 1 2011 54 100.0% 30 10 Saigon City Residence 8A/3D2 Thai Van Lung District 1 2011 17 84.0% 23 11 Spring Court 1Bis Phung Khac Khoan District 1 2011 14 76.0% 23 Grade B 814 85.7% 25.9 (*) US/sqm/month (**) ARR (Average Rental Rate): All rents are stated in gross rents per sqm, not including VAT and serviced charge ©2016 Colliers International Research
  • 17. Accelerating success Q1 2016 | HO CHI MINH CITY | INDUSTRIAL VIETNAM QUARTERLY KNOWLEDGE REPORT ©2016 Colliers International Research Page 17 PERFORMANCE In Q1 2016, the average rent of industrial parks (IPs) in HCM City was USD122/sqm/term and the average land use right term was 35.7 years. IPs in Cu Chi district have the lowest rents, averaging at USD50-USD60/sqm/term. On the contrary, IPs in Tan Binh District and District 7 have highest asking rents of, up to USD220-USD270/sqm/term. In general, rents in HCMC are currently more than double compared to those in the Southern Key Economic Region such as Binh Duong, Dong Nai, Long An, Vung Tau. The average occupancy rate was 68%, stable over the quarter. About two-thirds of IPs enjoyed above 90% occupancy rates due to its convenient location and efficient services. Common offers for ready-built factories were USD2.5-USD4/sqm/month (exclusive of VAT and service charge) with a minimum area from 1,000-5,000sqm. SUPPLY In the first three months of 2016, there is no new supply of IPS. The total areas of IPs in HCMC are over 3,900ha of which the leasable areas are over 2,700ha. By 2020, the total supply of industrial zones is estimated to rise to above 6,500 ha, up to 67% compared to the current supply. However, there is an uncertainty on the construction progress of some industrial parks. DEMAND Inflows of Foreign direct investment (FDI) to Export Processing Zones (EPZs) and industrial parks (IPs) in Ho Chi Minh City plummeted 69.5% year-on-year to USD116 million in the first three months of 2016. As of the end of March 2016, domestic and foreign firms registered to invest in 1,390 projects with accumulated capital of USD9.17 billion in HCM City’ EZs and IPs of which foreign- owned-enterprises accounted for 554 projects and USD5.42 billion. Meanwhile, domestic companies pledged to invest nearly USD80.4 million in EZs and IPs in the first quarter of 2016, representing an 80% y-o-y increase.Companies from non-TPP member nations such as China, Korea, India would relocate their operations and factories to Vietnam in order to benefit from tax incentives for their products. Foreign investors, especially from the U.S and Japan, will also flow into Vietnam more heavily to take advantage of Vietnam’s abundant labor force and a 90-million consumers market. These factors positively contribute to the demand for industrial real estates. OUTLOOK Rents and occupancy rates are likely to go up in the coming quarters as the inflows of FDI and the expansion of production in preparation for the TPP and other FTAs are expected to continue. The number of industrial areas is still being expanded. However, the majority of future projects are in the process of site clearance and compensation and hence construction process is expected to be prolonged. Le Minh Xuan 2, Le Minh Xuan 3, Vinh Loc 3, Hiep Phuoc phase 2 are among those that are on track to be in operation soon. VIETNAM QUARTERLY KNOWLEDGE REPORT ©2016 Colliers International Research Figure 18: Industrial, Net absorption Source: Colliers International Research Figure 19: Industrial, Supply by District Source: Colliers International Research Source: Colliers International Research Table 9: Industrial, Future Supply Industrial Park Name District GFA (ha) Le Minh Xuan Industrial Park - phase 3 Binh Chanh 242 Tay Bac Cu Chi Industrial Park - phase 2 Cu Chi 173 Hiep Phuoc Industrial Park - phase 2 Nha Be 597 0 10 20 30 40 50 60 70 80 Q1 Q2 Q3 Q4 Q1 Q2 Q3 Q4 Q1 Q2 Q3 Q4 Q1 Q2 Q3 Q4 Q1 2012 2013 2014 2015 2016 ha Dist. 9 22% Cu Chi 23% Binh Chanh 16% Binh Tan 10% Dist. 7 8% Nha Be 8% Others 13%
  • 18. Q1 2016 | HO CHI MINH CITY | INDUSTRIAL VIETNAM QUARTERLY KNOWLEDGE REPORT ©2016 Colliers International Research Page 18 Table 3: Significant Office Projects Table 10: HCMC Industrial Market Overview No Name of Industrial Park Location Distance to CBD (km) Total Area (ha) Total leasable area (ha) Asking Rent (US$/sqm/ term) Occupancy LUR Term 1 Linh Trung 1 Export Processing Zone Thu Duc 18 62 46 60 100% 2042 2 Linh Trung 2 Export Processing Zone Thu Duc 17 62 44 60 99% 2050 3 Binh Chieu Industrial Park Thu Duc 16 27 27 150 100% 2046 4 Saigon Hi-tech Park P1 District 9 15 300 300 60 100% 2052 5 Tay Bac Cu Chi Industrial Park Cu Chi 36.5 208 150 90 99% 2047 6 Tan Thoi Hiep Industrial Park District 12 16 28 20 100 100% 2049 7 Tan Phu Trung Industrial Park Cu Chi 37 543 359 73 28% 2054 8 Tan Thuan Export Processing Zone District 7 6.4 300 205 260 81% 2041 9 Hiep Phuoc Industrial Park 1 Nha Be 21 331 224 100 93% 2048 10 Hiep Phuoc Industrial Park 2 Nha Be 22 597 345 100 10% 2058 11 Tan Tao Industrial Park 1 Binh Tan 17 161 97 251 97% 2047 12 Tan Tao Industrial Park 2 Binh Tan 17 183 116 251 78% 2050 13 Tan Binh Industrial Park Tan Binh 11 129 100 235 100% 2047 14 Le Minh Xuan Industrial Park Binh Chanh 20 100 66 100 95% 2047 15 Vinh Loc Industrial Park Binh Chanh 15 203 131 270 95% 2047 16 Dong Nam Industrial Park Cu Chi 30 343 287 63 69% 2058 17 An Ha Industrial Park Binh Chanh 23 124 124 64 23% 2058 18 Cat Lai Industrial Park District 2 21 137 87 90 100% 2061 19 Automotive - Mechanical (Hoa Phu) Cu Chi 40 99 67 56 83% 2057 Total 3,937 2,795 122 68%
  • 19. COLLIERS INTERNATIONAL | VIETNAM HO CHI MINH CITY Bitexco Office Building, 7th Floor 19-25 Nguyen Hue Street District 1, HCM City, Vietnam Tel: + 84 8 3827 5665 HANOI Press Club Building, 4th Floor 59A Ly Thai To Street, Hoan Kiem District, Hanoi, Vietnam Tel: +84 8 3827 5665 502 offices in 67 countries on 6 continents Accelerating success DAVID JACKSON General Director david.jackson@colliers.com +84 8 3827 5665 About Colliers International Colliers International is a leader in global real estate services, defined by our spirit of enterprise. Through a culture of service excellence and a shared sense of initiative, we integrate the resources of real estate specialists worldwide to accelerate the success of our partners. We connect through a shared set of values that shape a collaborative environment throughout our organization that is unsurpassed in the industry. With more than 100 professionals in 2 offices in Vietnam, the team is market driven and has proven and successful track record with both international and local experience. From Hanoi to Ho Chi Minh City, we provide a full range of real estate services The foundation of our services is the strength and depth of our experience. Publication Coverage Frequency Content Availability Knowledge Report/ Market Insights Vietnam Cities Quarterly All market sectors Publicly available Investment report Vietnam Quarterly Economic updates and Investment highlights Publicly available CBD Report HCMC CBD Monthly Office, Retail, Hotel and Serviced Apartment Publicly available Residential launch update HCMC Monthly Residential Publicly available Asia Pacific Office Report Asia Pacific including Vietnam Quarterly Office market Publicly available Vietnam Property Market Report Vietnam cities Quarterly All market sectors On subscription Development Recommendation Vietnam cities At request All market sectors On subscription $2.30 billion in annual revenue 1.7 billion square feet under management 16,300 professionals and staff This document has been prepared by Colliers International for advertising and general information only. Colliers International makes no guarantees, representations or warranties of any kind, expressed or implied, regarding the information including, but not limited to, warranties of content, accuracy and reliability. Any interested party should undertake their own inquiries as to the accuracy of the information. Colliers International excludes unequivocally all inferred or implied terms, conditions and warranties arising out of this document and excludes all liability for loss and damages arising there from. This publication is the copyrighted property of Colliers International and/or its licensor(s). ©2016. All rights reserved. For further information, please contact us: VIETNAM | RESEARCH FORECAST REPORT ©2016 Colliers International Research www.colliers.com/vietnam HA VO Research Manager ha.vo@colliers.com +84 8 3827 5665