Download to read offline


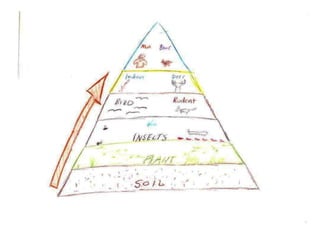


1. The document argues that visualization is essential to reading comprehension and that "without visualization, students cannot comprehend, and reading cannot be said to be reading." 2. It promotes using drawing as a way to increase student engagement, comprehension, creative problem-solving and critical thinking when combined with reading. Drawing focuses the mind and leads to greater engagement and presence. 3. The document provides guidance on simple drawing strategies and choices in visual formats to accompany reading, with the goal of improving reading, learning, and thinking.


