
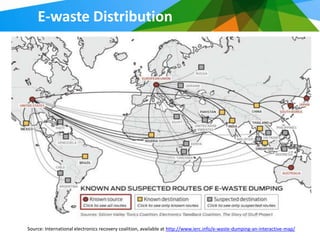
![Global Facts Regarding SWM
Annual waste generation exceeds 4 billion tons / almost
half of them are municipal
The growth of population and GDP/cap will result in
increased waste generation
Source: Veolia, Cyclope (2009) From waste to resource: an abstract of world waste survey 2009, Paris.
[Available: http://www.uncrd.or.jp/env/spc/docs/plenary3/PS3-F-Veolia_Hierso-Print%20abstract.pdf]](https://image.slidesharecdn.com/globalizationandwastemanagementpresentation-121120101801-phpapp02/85/D-Waste-Presentation-Globalization-and-Waste-Management-21-320.jpg)
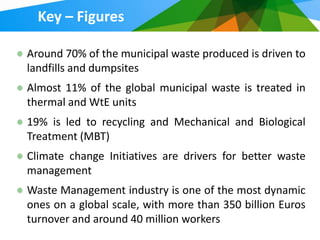

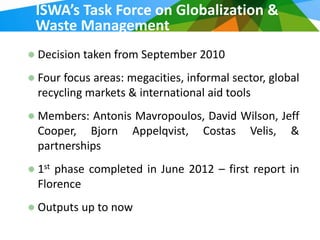
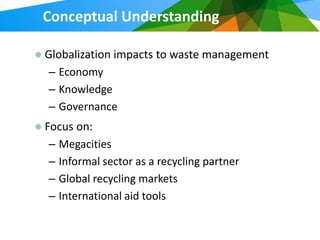
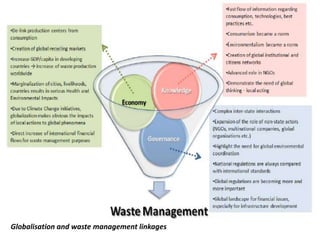
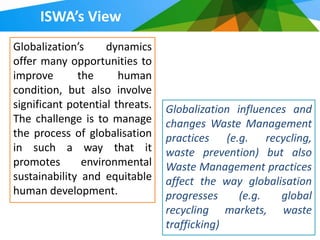
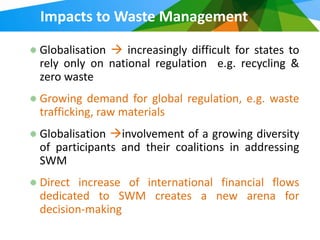
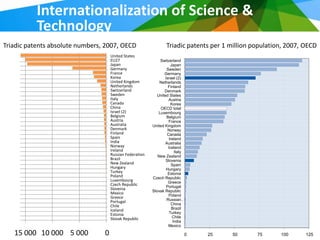
ISWA's task force on globalization and waste management focuses on four key areas: megacities, the informal sector, global recycling markets, and international aid tools. The report emphasizes the interconnectedness of waste management with globalization, highlighting challenges such as e-waste management and the need for global regulations in waste management practices. It concludes that urbanization and climate change are crucial factors affecting waste management systems globally.
![Com score 2010_canada_digital_year_in_review[1]](https://cdn.slidesharecdn.com/ss_thumbnails/comscore2010canadadigitalyearinreview1-110413160628-phpapp02-thumbnail.jpg?width=640&height=640&fit=bounds)


![Key Driving Forces of Globalisation [Notes]](https://cdn.slidesharecdn.com/ss_thumbnails/keydrivingforcesofglobalisation-120728230319-phpapp02-thumbnail.jpg?width=640&height=640&fit=bounds)


![Global competition landscape reviewv victor camlek [2.28.2012]](https://cdn.slidesharecdn.com/ss_thumbnails/globalcompetitionlandscapereviewvvictorcamlek2-28-2012-130406083303-phpapp02-thumbnail.jpg?width=640&height=640&fit=bounds)


