Download to read offline
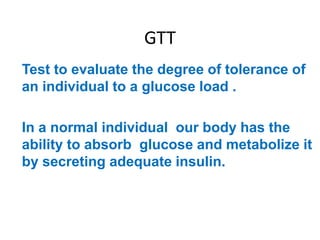
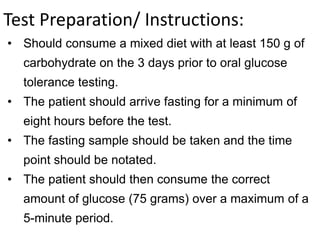
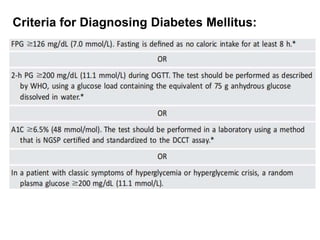
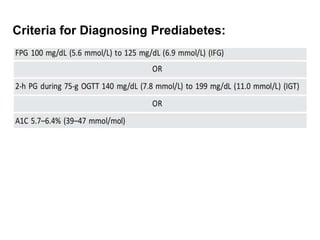
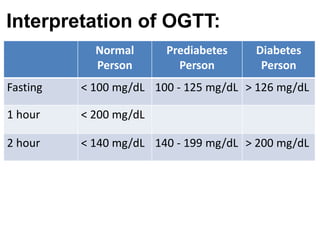
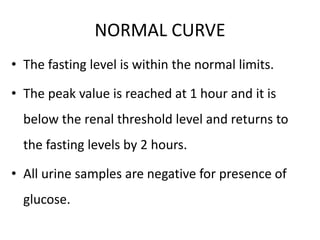
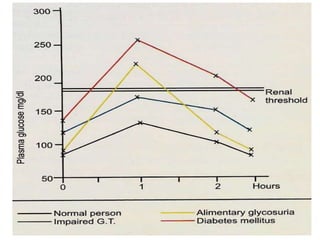
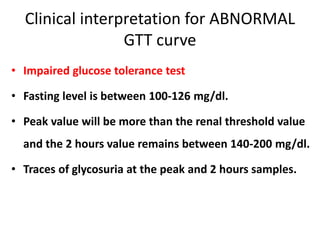
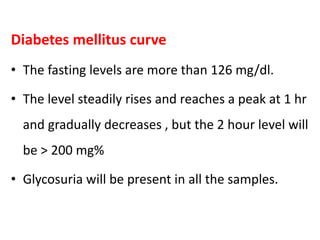
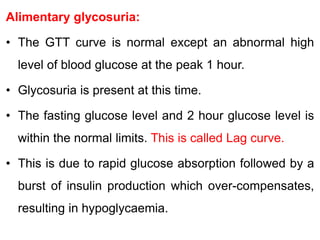
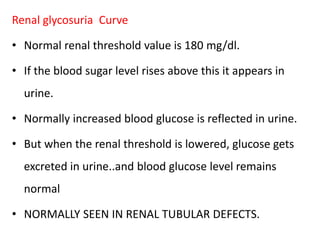
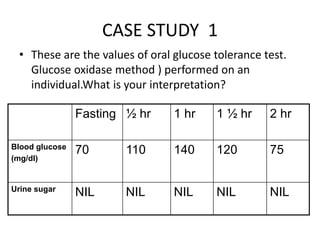
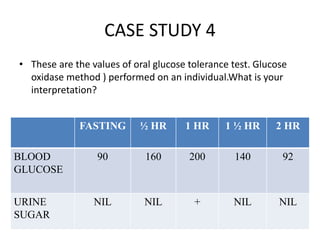
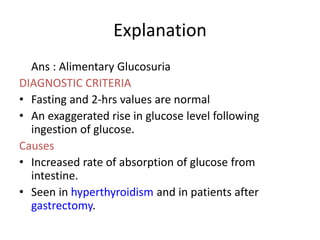
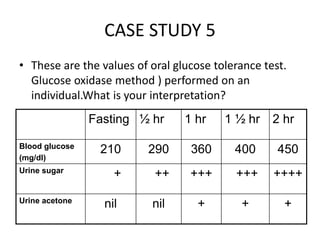
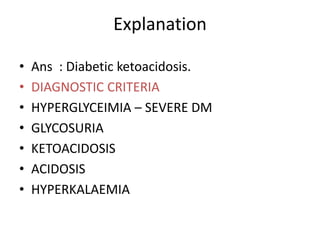

The document describes the glucose tolerance test (GTT) used to evaluate tolerance to glucose loads and diagnose prediabetes and diabetes. It provides instructions for administering the GTT, criteria for diagnosing prediabetes and diabetes based on fasting blood glucose and 2-hour post-load glucose levels, and interpretations of normal, abnormal, diabetic, and other abnormal GTT curves. It also includes 5 case studies presenting GTT values and interpreting the results as normal, prediabetes, diabetes, renal glycosuria, or diabetic ketoacidosis.