The document details the physiology of the glucose tolerance test (OGTT), focusing on the regulation of blood glucose by insulin and glucagon, and how diabetes mellitus affects glucose metabolism. It outlines the preparation, procedure, and results of the test, including criteria for diagnosing normal glucose levels, pre-diabetes, and diabetes based on blood glucose readings. Additionally, it describes the materials and methods for measuring blood glucose levels during the test.

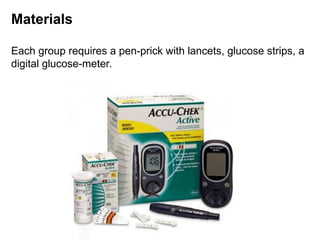
![Methods of Measurement
1. Obtain a droplet of blood from a finger by lancing. [It
helps if you squeeze your fingertip to trap blood first
before using the lancet.] A partner can prepare the
glucose-meter by placing a strip in the meter.
2. When the droplet appears on the LCD, apply the blood
drop to the end of the glucose strip (not on top of the
strip)
3. An infrared light scans the strip and in a matter of 5-6
seconds, blood glucose is indicated on the screen in
mg/dL.
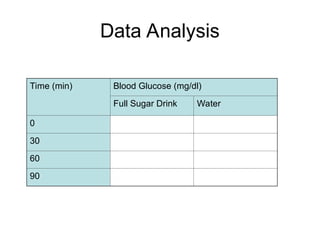
4. After this first (Time 0) reading, drink a roughly 350 mL
serving of one of the beverages provided, then record
blood glucose at 30, 60 and 90 minutes afterwards.
5. Record data for yourself and your labmate in the table
below.](https://image.slidesharecdn.com/glucosetolerancetesting-250123124601-e94dd24d/85/glucose-tolerance-testing_presentation-ppt-17-320.jpg)