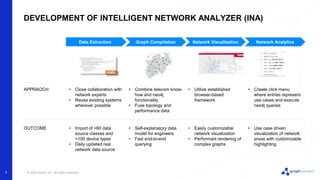
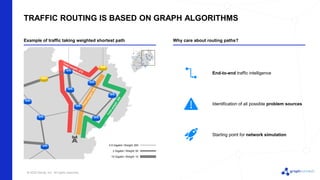
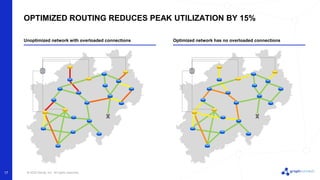
© 2022 Neo4j, Inc. All rights reserved.
Graph-Based Network Topology
Analysis for Telecom Operators
Andreas Lattoch,
Sopra Steria
Franziska Schmidt,
Sopra Steria
© 2022 Neo4j, Inc. All rights reserved.
2
DIGITALIZATION INCREASES NUMBER OF DAILY NETWORK CHANGES
What do we do
Who are we
Franziska Schmidt
Likes relational databases, loves graph databases
Andreas Lattoch
Clones Telecom-Networks into Graphs 2500
Telecom FTE
Banking
Public
Sector
Insurance Aerospace
Automotive
&
Industrial
Goods
Telecom
&
Media
Energy
&
Utilities
• We do IT Strategy,
Consulting, and Solution
Development
• We are 2500 consultants
in the Telecom & Media
vertical
• We work with clients
across Europe
© 2022 Neo4j, Inc. All rights reserved.
3
EVER TRIED TO
CHANGE A TIRE
WHILE DRIVING?
© 2022 Neo4j, Inc. All rights reserved.
4
OUR CLIENTS CHANGE THEIR RUNNING NETWORK EVERY DAY
Our clients include the top telecom providers in Germany:
1000
NETWORK CHANGES
AND MANUAL DATA
ENTRIES EVERY DAY
80%
OF NETWORK
OUTAGES DUE TO
CHANGES
$7bn
COMBINED ANNUAL
INVESTMENT OF
TELECOM PROVIDERS*
* Data from annual reports of Telekom, Vodafone und Telefónica from 2020
© 2022 Neo4j, Inc. All rights reserved.
6
NETWORK CHANGES REQUIRE VIEW OF THE ACTUAL NETWORK
SOFTWARE
ENGINEERING
NETWORK
SERVICE
CREATION
Planned models Actual artifact Testing & Validation
e.g., UML Class Diagram Code e.g., IntelliJ IDEA Diagrams
Network Topology Planning Network Configuration
?
© 2022 Neo4j, Inc. All rights reserved.
7
DEVELOPMENT OF INTELLIGENT NETWORK ANALYZER (INA)
Data Extraction Graph Compilation Network Visualization Network Analytics
APPRAOCH
OUTCOME • Import of >60 data
source classes and
>100 device types
• Daily updated real
network data source
• Close collaboration with
network experts
• Reuse existing systems
wherever possible
• Utilize established
browser-based
framework
• Create click menu
where entries represent
use cases and execute
neo4j queries
• Combine telecom know-
how and neo4j
functionality
• Fuse topology and
performance data
• Self-explanatory data
model for engineers
• Fast end-to-end
querying
• Easily customizable
network visualization
• Performant rendering of
complex graphs
• Use case driven
visualization of network
areas with customizable
highlighting
© 2022 Neo4j, Inc. All rights reserved.
8
ARCHITECTURE OF INA UTILIZES GREAT FRAMEWORKS
Antennas
Switches
Router
Data extraction
> 60 Data source classes
Graph database
Config, Status, Traffic Data
Frontend
Customizable visualization
Analytics
AI driven traffic routing
© 2022 Neo4j, Inc. All rights reserved.
9
INA: CUSTOMIZABLE NETWORK VISUALIZATION & ANALYTICS TOOL
Customizable
icons for your own
visualization needs
Fast and intuitive
rendering of
complex graphs.
Predefined
analysis options
via parametrized
queries executable
on nodes
Telco specific
visualizations
such as
connection
utilization
© 2022 Neo4j, Inc. All rights reserved.
10
SHIFT FROM MANUAL DOCUMENTATION TO DIGITAL TWIN
Before: Manually maintained network documentation With INA: Daily updated digital twin of network topology
© 2022 Neo4j, Inc. All rights reserved.
11
FROM CONNECTED DEVICES TO TRAFFIC FLOWS
Connecting the dots is not enough… …to identify potential root causes
?
© 2022 Neo4j, Inc. All rights reserved.
TRAFFIC ROUTING IS BASED ON GRAPH ALGORITHMS
Example of traffic taking weighted shortest path Why care about routing paths?
2 Gigabit / Weight: 50
0.5 Gigabit / Weight: 200
10 Gigabit / Weight: 10
Identification of all possible problem sources
Starting point for network simulation
End-to-end traffic intelligence
© 2022 Neo4j, Inc. All rights reserved.
13
IT AIN‘T THAT EASY IN REALITY – IF YOU DON‘T USE NEO4J
Example real world network Complicating factors
• Network divided in subnetworks with different transfer points
• Paths with equal total weights
• Inactive connections
• Inclusion of all real word data
• Performant calculation of weighted shortest path
• User friendly data processing
No problem with Neo4j
© 2022 Neo4j, Inc. All rights reserved.
14
DEMO
© 2022 Neo4j, Inc. All rights reserved.
15
I'M SITTING HERE IN TRAFFIC ON THE QUEENSBORO BRIDGE TONIGHT
ROAD
NETWORK
ROUTER
NETWORK
Default routes cause congestion Smart rerouting Optimal infrastructure utilization
INA
Graphics from: https://www.frontiersin.org/articles/10.3389/fict.2017.00029/full
© 2022 Neo4j, Inc. All rights reserved.
16
TRAFFIC OPTIMIZATION IN PRACTICE
5 possible paths for each end point… Simulated annealing solves optimization challenge
Brute force calculation of all combinations
would take ~25 years at 1ms per configuration
800bn
possibilities
~25y
to calculate all
possibilities
~60s
to find good optimum
Simulated annealing finds optimal solution
within 60 s after 1000 tested combinations
Task: assign yellow backbone router to blue
router so that utilization is minimized
Possible combinations: 517 = 800bn
© 2022 Neo4j, Inc. All rights reserved.
17
OPTIMIZED ROUTING REDUCES PEAK UTILIZATION BY 15%
Unoptimized network with overloaded connections Optimized network has no overloaded connections
© 2022 Neo4j, Inc. All rights reserved.
18
DISCOVERY, ANALYSIS, AND OPTIMIZATION OF NETWORKS WITH INA
Discovery Analysis
End-to-end
analysis
Topology
discovery
Optimization
Optimization based on
simulations
© 2022 Neo4j, Inc. All rights reserved.
19
Thank you!
For feedback or question contact us via LinkedIn or our colleague Annika
annika.riebschlaeger@soprasteria.com
© 2022 Neo4j, Inc. All rights reserved.
20
Q&A
© 2022 Neo4j, Inc. All rights reserved.
21
Thank you!
For feedback or question contact us via LinkedIn or our colleague Annika
annika.riebschlaeger@soprasteria.com

Graph-Based Network Topology Analysis for Telecom Operators

  • 1.
    © 2022 Neo4j,Inc. All rights reserved. © 2022 Neo4j, Inc. All rights reserved. Graph-Based Network Topology Analysis for Telecom Operators Andreas Lattoch, Sopra Steria Franziska Schmidt, Sopra Steria
  • 2.
    © 2022 Neo4j,Inc. All rights reserved. 2 DIGITALIZATION INCREASES NUMBER OF DAILY NETWORK CHANGES What do we do Who are we Franziska Schmidt Likes relational databases, loves graph databases Andreas Lattoch Clones Telecom-Networks into Graphs 2500 Telecom FTE Banking Public Sector Insurance Aerospace Automotive & Industrial Goods Telecom & Media Energy & Utilities • We do IT Strategy, Consulting, and Solution Development • We are 2500 consultants in the Telecom & Media vertical • We work with clients across Europe
  • 3.
    © 2022 Neo4j,Inc. All rights reserved. 3 EVER TRIED TO CHANGE A TIRE WHILE DRIVING?
  • 4.
    © 2022 Neo4j,Inc. All rights reserved. 4 OUR CLIENTS CHANGE THEIR RUNNING NETWORK EVERY DAY Our clients include the top telecom providers in Germany: 1000 NETWORK CHANGES AND MANUAL DATA ENTRIES EVERY DAY 80% OF NETWORK OUTAGES DUE TO CHANGES $7bn COMBINED ANNUAL INVESTMENT OF TELECOM PROVIDERS* * Data from annual reports of Telekom, Vodafone und Telefónica from 2020
  • 5.
    © 2022 Neo4j,Inc. All rights reserved. 6 NETWORK CHANGES REQUIRE VIEW OF THE ACTUAL NETWORK SOFTWARE ENGINEERING NETWORK SERVICE CREATION Planned models Actual artifact Testing & Validation e.g., UML Class Diagram Code e.g., IntelliJ IDEA Diagrams Network Topology Planning Network Configuration ?
  • 6.
    © 2022 Neo4j,Inc. All rights reserved. 7 DEVELOPMENT OF INTELLIGENT NETWORK ANALYZER (INA) Data Extraction Graph Compilation Network Visualization Network Analytics APPRAOCH OUTCOME • Import of >60 data source classes and >100 device types • Daily updated real network data source • Close collaboration with network experts • Reuse existing systems wherever possible • Utilize established browser-based framework • Create click menu where entries represent use cases and execute neo4j queries • Combine telecom know- how and neo4j functionality • Fuse topology and performance data • Self-explanatory data model for engineers • Fast end-to-end querying • Easily customizable network visualization • Performant rendering of complex graphs • Use case driven visualization of network areas with customizable highlighting
  • 7.
    © 2022 Neo4j,Inc. All rights reserved. 8 ARCHITECTURE OF INA UTILIZES GREAT FRAMEWORKS Antennas Switches Router Data extraction > 60 Data source classes Graph database Config, Status, Traffic Data Frontend Customizable visualization Analytics AI driven traffic routing
  • 8.
    © 2022 Neo4j,Inc. All rights reserved. 9 INA: CUSTOMIZABLE NETWORK VISUALIZATION & ANALYTICS TOOL Customizable icons for your own visualization needs Fast and intuitive rendering of complex graphs. Predefined analysis options via parametrized queries executable on nodes Telco specific visualizations such as connection utilization
  • 9.
    © 2022 Neo4j,Inc. All rights reserved. 10 SHIFT FROM MANUAL DOCUMENTATION TO DIGITAL TWIN Before: Manually maintained network documentation With INA: Daily updated digital twin of network topology
  • 10.
    © 2022 Neo4j,Inc. All rights reserved. 11 FROM CONNECTED DEVICES TO TRAFFIC FLOWS Connecting the dots is not enough… …to identify potential root causes ?
  • 11.
    © 2022 Neo4j,Inc. All rights reserved. TRAFFIC ROUTING IS BASED ON GRAPH ALGORITHMS Example of traffic taking weighted shortest path Why care about routing paths? 2 Gigabit / Weight: 50 0.5 Gigabit / Weight: 200 10 Gigabit / Weight: 10 Identification of all possible problem sources Starting point for network simulation End-to-end traffic intelligence
  • 12.
    © 2022 Neo4j,Inc. All rights reserved. 13 IT AIN‘T THAT EASY IN REALITY – IF YOU DON‘T USE NEO4J Example real world network Complicating factors • Network divided in subnetworks with different transfer points • Paths with equal total weights • Inactive connections • Inclusion of all real word data • Performant calculation of weighted shortest path • User friendly data processing No problem with Neo4j
  • 13.
    © 2022 Neo4j,Inc. All rights reserved. © 2022 Neo4j, Inc. All rights reserved. 14 DEMO
  • 14.
    © 2022 Neo4j,Inc. All rights reserved. 15 I'M SITTING HERE IN TRAFFIC ON THE QUEENSBORO BRIDGE TONIGHT ROAD NETWORK ROUTER NETWORK Default routes cause congestion Smart rerouting Optimal infrastructure utilization INA Graphics from: https://www.frontiersin.org/articles/10.3389/fict.2017.00029/full
  • 15.
    © 2022 Neo4j,Inc. All rights reserved. 16 TRAFFIC OPTIMIZATION IN PRACTICE 5 possible paths for each end point… Simulated annealing solves optimization challenge Brute force calculation of all combinations would take ~25 years at 1ms per configuration 800bn possibilities ~25y to calculate all possibilities ~60s to find good optimum Simulated annealing finds optimal solution within 60 s after 1000 tested combinations Task: assign yellow backbone router to blue router so that utilization is minimized Possible combinations: 517 = 800bn
  • 16.
    © 2022 Neo4j,Inc. All rights reserved. 17 OPTIMIZED ROUTING REDUCES PEAK UTILIZATION BY 15% Unoptimized network with overloaded connections Optimized network has no overloaded connections
  • 17.
    © 2022 Neo4j,Inc. All rights reserved. 18 DISCOVERY, ANALYSIS, AND OPTIMIZATION OF NETWORKS WITH INA Discovery Analysis End-to-end analysis Topology discovery Optimization Optimization based on simulations
  • 18.
    © 2022 Neo4j,Inc. All rights reserved. © 2022 Neo4j, Inc. All rights reserved. 19 Thank you! For feedback or question contact us via LinkedIn or our colleague Annika annika.riebschlaeger@soprasteria.com
  • 19.
    © 2022 Neo4j,Inc. All rights reserved. © 2022 Neo4j, Inc. All rights reserved. 20 Q&A
  • 20.
    © 2022 Neo4j,Inc. All rights reserved. © 2022 Neo4j, Inc. All rights reserved. 21 Thank you! For feedback or question contact us via LinkedIn or our colleague Annika annika.riebschlaeger@soprasteria.com