Download to read offline

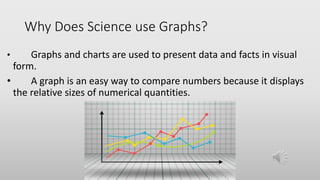


This document outlines graphing assignments and concepts including interpreting graphs, why science uses graphs, the relationship between the x and y axes, dot plots, and scatterplots. Students are asked to practice interpreting graphs, learn about graphing through a Brainpop video, and take a quiz on graphing concepts. Graphs present data visually and make it easy to compare numerical quantities by showing their relative sizes. The x axis represents one variable while the y axis represents another related variable.


