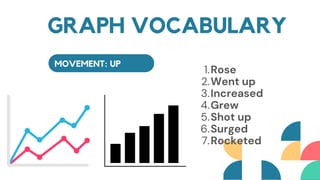
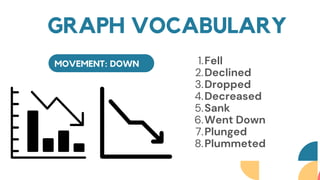
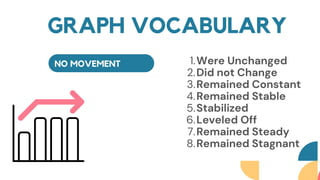
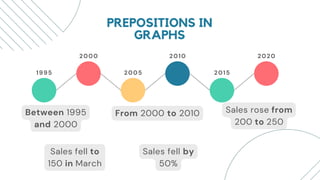
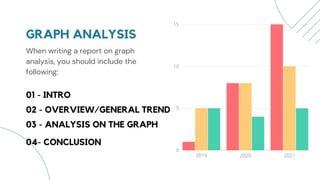
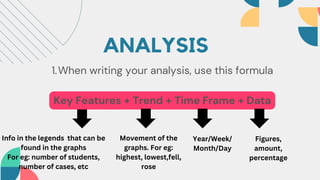
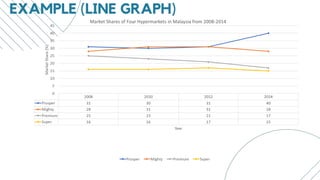
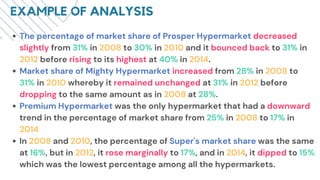
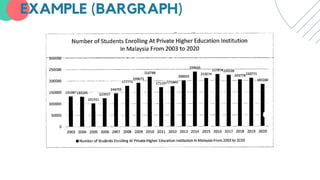
GRAPH ANALYSIS
By: Ms Laila
DESCRIBING
TREND ON
GRAPHS
INTRODUCTION
When writing a report based on a graph, it is crucial to use the
formal language that is designated to describe the visuals.
Present the information in an organised way as possible and
accurate. Use graph vocabularies in the next slides to help you
in describing the graph.
MOVEMENT: UP
Rose
Went up
Increased
Grew
Shot up
Surged
Rocketed
1.
2.
3.
4.
5.
6.
7.
GRAPH VOCABULARY
MOVEMENT: DOWN Fell
Declined
Dropped
Decreased
Sank
Went Down
Plunged
Plummeted
1.
2.
3.
4.
5.
6.
7.
8.
GRAPH VOCABULARY
NO MOVEMENT Were Unchanged
Did not Change
Remained Constant
Remained Stable
Stabilized
Leveled Off
Remained Steady
Remained Stagnant
1.
2.
3.
4.
5.
6.
7.
8.
GRAPH VOCABULARY
PREPOSITIONS IN
GRAPHS
Between 1995
and 2000
1995
2000
2005
2010
2015
2020
From 2000 to 2010 Sales rose from
200 to 250
Sales fell to
150 in March
Sales fell by
50%
ADVERBS AND
INTENSIFIERS
Slightly
A little
A lot
Sharply
Suddenly
Steeply
Gradually
Gently
Steadily
1.
2.
3.
4.
5.
6.
7.
8.
9.
HOW TO WRITE
GRAPH
ANALYSIS?
2019 2020 2021
15
10
5
0
GRAPH ANALYSIS
When writing a report on graph
analysis, you should include the
following:
01 - INTRO
02 - OVERVIEW/GENERAL TREND
03 - ANALYSIS ON THE GRAPH
04- CONCLUSION
INTRODUCTION
Refer to the title of the stimulus
For Example:
The stimulus depicts/shows/illustrates...
The charts demonstrates...
Figure 1 shows/depicts/illustrates
The visual shows...
1.
2.
3. Just write whatever titles you can find in the
questions
OVERVIEW/GENERAL TREND
Refer to the title of each of the stimulus
For Example:
Generally, the trend shows fluctuation in
the....
Generally, the highest number of .............. is
recorded in 20XX.
Generally, the lowest number of ............. is
recorded in 20XX.
1.
2.
ANALYSIS
When writing your analysis, use this formula
1.
Key Features + Trend + Time Frame + Data
Info in the legends that can be
found in the graphs
For eg: number of students,
number of cases, etc
Movement of the
graphs. For eg:
highest, lowest,fell,
rose
Year/Week/
Month/Day
Figures,
amount,
percentage
EXAMPLE (LINE GRAPH)
EXAMPLE OF ANALYSIS
The percentage of market share of Prosper Hypermarket decreased
slightly from 31% in 2008 to 30% in 2010 and it bounced back to 31% in
2012 before rising to its highest at 40% in 2014.
Market share of Mighty Hypermarket increased from 28% in 2008 to
31% in 2010 whereby it remained unchanged at 31% in 2012 before
dropping to the same amount as in 2008 at 28%.
Premium Hypermarket was the only hypermarket that had a downward
trend in the percentage of market share from 25% in 2008 to 17% in
2014
In 2008 and 2010, the percentage of Super's market share was the same
at 16%, but in 2012, it rose marginally to 17%, and in 2014, it dipped to 15%
which was the lowest percentage among all the hypermarkets.
INDICATOR
Key Features
Trend
Data
Time Frame
EXAMPLE (BARGRAPH)
EXAMPLE OF ANALYSIS
The number of students enrolling at private higher education
institutions in Malaysia from 2003 to 2005 went down steadily from
13,1947 students to 13,0265 students. After that, the number of students
enrolling at private higher education institutions in Malaysia from 2005
with 101311 students went up gradually to 2010 with 216788 students.
Next, the number of students enrolling at private higher education
institutions in Malaysia from 2010 to 2011 dropped noticeably with
21,6788 and 17,1197 students respectively. Then, the number of students
enrolling at private higher education institution in Malaysia then
increased significantly from 17,1197 students in 2011 to 23,8565 students
in 2014.
EXAMPLE OF ANALYSIS
The number of students enrolling at private higher education
institutions in Malaysia then declined considerably from 2014 to 2015
with 238565 and 210574 students respectively. After that, the number
of students enrolling at private higher education institutions in Malaysia
inclined a little from 210574 students in 2015 to 227874 students in 2016.
Next, the number of students enrolling at private higher education
institutions in Malaysia fell down gradually from 2016 with 227874
students to 2018 with 203778 students .
Then, the number of students enrolling at private higher education
institution in Malaysia went up a bit from 2018 to 2019 with 203778 and
210771 students respectively. Finally, from 2019 to 2020, the number of
students enrolling at private higher education institution in Malaysia
went back down suddenly with 210771 and 183280 students each year
CONCLUSION
Restate the overview or general trend by
paraphrasing it.
THANK YOU

GRAPH ANALYSIS on English as Professional Comm.pdf

  • 1.
  • 2.
  • 3.
    INTRODUCTION When writing areport based on a graph, it is crucial to use the formal language that is designated to describe the visuals. Present the information in an organised way as possible and accurate. Use graph vocabularies in the next slides to help you in describing the graph.
  • 4.
    MOVEMENT: UP Rose Went up Increased Grew Shotup Surged Rocketed 1. 2. 3. 4. 5. 6. 7. GRAPH VOCABULARY
  • 5.
    MOVEMENT: DOWN Fell Declined Dropped Decreased Sank WentDown Plunged Plummeted 1. 2. 3. 4. 5. 6. 7. 8. GRAPH VOCABULARY
  • 6.
    NO MOVEMENT WereUnchanged Did not Change Remained Constant Remained Stable Stabilized Leveled Off Remained Steady Remained Stagnant 1. 2. 3. 4. 5. 6. 7. 8. GRAPH VOCABULARY
  • 7.
    PREPOSITIONS IN GRAPHS Between 1995 and2000 1995 2000 2005 2010 2015 2020 From 2000 to 2010 Sales rose from 200 to 250 Sales fell to 150 in March Sales fell by 50%
  • 8.
    ADVERBS AND INTENSIFIERS Slightly A little Alot Sharply Suddenly Steeply Gradually Gently Steadily 1. 2. 3. 4. 5. 6. 7. 8. 9.
  • 9.
  • 10.
    2019 2020 2021 15 10 5 0 GRAPHANALYSIS When writing a report on graph analysis, you should include the following: 01 - INTRO 02 - OVERVIEW/GENERAL TREND 03 - ANALYSIS ON THE GRAPH 04- CONCLUSION
  • 11.
    INTRODUCTION Refer to thetitle of the stimulus For Example: The stimulus depicts/shows/illustrates... The charts demonstrates... Figure 1 shows/depicts/illustrates The visual shows... 1. 2. 3. Just write whatever titles you can find in the questions
  • 12.
    OVERVIEW/GENERAL TREND Refer tothe title of each of the stimulus For Example: Generally, the trend shows fluctuation in the.... Generally, the highest number of .............. is recorded in 20XX. Generally, the lowest number of ............. is recorded in 20XX. 1. 2.
  • 13.
    ANALYSIS When writing youranalysis, use this formula 1. Key Features + Trend + Time Frame + Data Info in the legends that can be found in the graphs For eg: number of students, number of cases, etc Movement of the graphs. For eg: highest, lowest,fell, rose Year/Week/ Month/Day Figures, amount, percentage
  • 14.
  • 15.
    EXAMPLE OF ANALYSIS Thepercentage of market share of Prosper Hypermarket decreased slightly from 31% in 2008 to 30% in 2010 and it bounced back to 31% in 2012 before rising to its highest at 40% in 2014. Market share of Mighty Hypermarket increased from 28% in 2008 to 31% in 2010 whereby it remained unchanged at 31% in 2012 before dropping to the same amount as in 2008 at 28%. Premium Hypermarket was the only hypermarket that had a downward trend in the percentage of market share from 25% in 2008 to 17% in 2014 In 2008 and 2010, the percentage of Super's market share was the same at 16%, but in 2012, it rose marginally to 17%, and in 2014, it dipped to 15% which was the lowest percentage among all the hypermarkets.
  • 16.
  • 17.
  • 18.
    EXAMPLE OF ANALYSIS Thenumber of students enrolling at private higher education institutions in Malaysia from 2003 to 2005 went down steadily from 13,1947 students to 13,0265 students. After that, the number of students enrolling at private higher education institutions in Malaysia from 2005 with 101311 students went up gradually to 2010 with 216788 students. Next, the number of students enrolling at private higher education institutions in Malaysia from 2010 to 2011 dropped noticeably with 21,6788 and 17,1197 students respectively. Then, the number of students enrolling at private higher education institution in Malaysia then increased significantly from 17,1197 students in 2011 to 23,8565 students in 2014.
  • 19.
    EXAMPLE OF ANALYSIS Thenumber of students enrolling at private higher education institutions in Malaysia then declined considerably from 2014 to 2015 with 238565 and 210574 students respectively. After that, the number of students enrolling at private higher education institutions in Malaysia inclined a little from 210574 students in 2015 to 227874 students in 2016. Next, the number of students enrolling at private higher education institutions in Malaysia fell down gradually from 2016 with 227874 students to 2018 with 203778 students . Then, the number of students enrolling at private higher education institution in Malaysia went up a bit from 2018 to 2019 with 203778 and 210771 students respectively. Finally, from 2019 to 2020, the number of students enrolling at private higher education institution in Malaysia went back down suddenly with 210771 and 183280 students each year
  • 20.
    CONCLUSION Restate the overviewor general trend by paraphrasing it.
  • 21.