Graf
•Download as DOCX, PDF•
0 likes•797 views

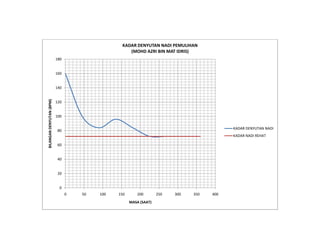
The document contains graphs showing the heart rate recovery of 4 individuals over time following exercise. The graphs plot heart rate in beats per minute (BPM) on the y-axis against time in seconds on the x-axis. Each graph shows the individual's heart rate quickly increasing above their resting heart rate level after exercise, before gradually decreasing back towards the resting rate over several minutes. This documents the heart rate recovery patterns of 4 people after physical exertion.

More Related Content
What's hot
What's hot (20)
Viewers also liked
Viewers also liked (20)
More from Pensil Dan Pemadam
More from Pensil Dan Pemadam (20)
Graf
- 1. KADAR DENYUTAN NADI PEMULIHAN (MOHD AZRI BIN MAT IDRIS) 180 160 140 BILANGAN DENYUTAN (BPM) 120 100 KADAR DENYUTAN NADI 80 KADAR NADI REHAT 60 40 20 0 0 50 100 150 200 250 300 350 400 MASA (SAAT)
- 2. KADAR DENYUTAN NADI PEMULIHAN (MOHAMAD AMIR WARDEE BIN MOHD KAMIS) 160 140 120 KADAR DENYUTAN NADI (BPM) 100 80 KADAR DENYUTAN NADI KADAR NADI REHAT 60 40 20 0 0 50 100 150 200 250 300 350 400 MASA (SAAT)
- 3. KADAR DENYUTAN NADI PEMULIHAN (MOHD AIDIL BIN OTHMAN) 180 160 140 KADAR DENYUTAN NADI (BPM) 120 100 KADAR DENYUTAN NADI 80 KADAR NADI REHAT 60 40 20 0 0 50 100 150 200 250 300 350 400 MASA (SAAT)
- 4. KADAR DENYUTAN NADI PEMULIHAN (MOHD NASRUN BIN MOHD ZAKI) 180 160 140 KADAR DENYUTAN NADI (BPM) 120 100 80 KADAR DENYUTAN NADI KADAR NADI REHAT 60 40 20 0 0 100 200 300 400 500 600 MASA (SAAT)