SlideShare a Scribd company logo
1 of 12
Download to read offline
GPS Signal Degradation Modeling

                              Changlin Ma, Gyu-In Jee, Glenn MacGougan, and Gerard Lachapelle
                               Department of Geomatics Engineering, the University of Calgary

                                                           S. Bloebaum
                                            Ericsson Inc, Research Triangle Park, N.C.

                                                   G. Cox, L. Garin, J. Shewfelt
                                                SiRF Technology Inc., San Jose, CA


BIOGRAPHY                                                            State University. He has been with Ericsson since 1990,
                                                                     where he has held a variety of roles in research and
Changlin Ma is a graduate student of the department of               development for cellular phones and networks.
Geomatics Engineering at the University of Calgary. He               Currently, he is a Technical Manager in Ericsson Mobile
received his B.S.(1992) and M.S.(1995) in Electronics                Platforms and Technologies in Research Triangle Park,
Engineering from Northwestern Polytechnical University               NC where he is responsible for positioning technology
(Xi’an, China), and his first Ph.D.(1998) also in                    development. He has been involved with GPS for four
Electronics Engineering from Tsinghua University                     years and played a key role in setting GSM standards for
(Beijing, China). His current research is focused on GPS             network-assisted GPS. His technical interests are hybrid
receiver technology.                                                 cellular-satellite  positioning     technology,   speech
                                                                     enhancement and compression, and multicarrier
Gyu-In Jee is a Professor in the Department of                       modulation and transmission systems. He holds four
Electronics Engineering at Konkuk University in Seoul,               U.S. patents.
Korea. He received his Ph.D. in Systems Engineering
from Case Western Reserve University on 1989. He has                 Geoffrey F. Cox received his B.A. degree in
worked on several GPS related research projects; GPS                 Geology/Chemistry and Mathematics at the University of
receiver software design, GPS/INS integration for land               Maine in 1992, M. Eng. in Geomatics Engineering from
vehicle, DGPS system development, GPS engine design                  the University of Calgary in 1996. His area of study at
using the Mitel chip sets, wireless location in CDMA                 that time was GPS Positioning and Navigation with
network, etc. His research interests include software GPS            emphasis on the Foliage Effects on GPS Signals. Since
receiver, wireless positioning for E911, and GPS/INS                 1996, Mr. Cox has worked in many engineering and
integration for personal navigation.                                 business capacities ranging from WADGPS development
                                                                     for Terrestrial and Aviation Precision Agricultural
Mr. Glenn MacGougan is a MSc. student in the                         Systems, Commercial RTK Survey and Mapping
Department of Geomatics Engineering at the University                Systems. In beginning of 2000, Mr. Cox consulted for
of Calgary. In 2000 he completed a BSc. in Geomatics                 various companies by providing GPS related engineering
Engineering at the University of Calgary. He will                    and marketing services. Mr. Cox joined SiRF
complete his second degree in September 2002.                        Technology, Inc. in the fall of 2000 as Senior
                                                                     Applications Engineer.
Dr. Gerard Lachapelle is a Professor and Head of the
Department of Geomatics Engineering where he is                      Lionel Garin is Lead Architect at SiRF Technology. Prior
responsible for teaching and research related to                     to joining SiRF he worked on Multipath Rejection
positioning, navigation, and hydrography. He has been                techniques, survey quality GPS and Glonass receivers at
involved with GPS developments and applications since                Ashtech and Sagem. Mr. Garin holds a MSEE from
1980.                                                                EcoleNationale Supérieure des Télécommunications.

Scott Bloebaum received the B.S. and M.S. degrees in                 John L. Shewfelt received a B.Sc. in Electrical
Electrical Engineering from Virginia Tech, and the Ph.D.             Engineering from the University of California Santa
degree in Electrical Engineering from North Carolina                 Barbara in 1981. Since that time Mr. Shewfelt has been


ION GPS 2001, 11-14 September 2001, Salt Lake City, UT         882
involved in design, development, test and integration of             in this case, thus requiring a GPS receiver to be able to
complex avionics and guidance systems for various types              acquire and track weak signals. Secondly, GPS signals in
of aircraft and naval platforms, including working with              these serious situations can contain serious multipath
microwave radars and receivers, Jammers, UV and IR                   signals, which can degrade positioning accuracy
imaging systems, and GPS/INS guidance and control. In                significantly.
March of 2000, Mr. Shewfelt joined SiRF Technology
Inc. as Applications Engineering Manager to facilitate               To understand and perhaps solve these problems
the integration of GPS technology into embedded                      knowledge about the GPS signal channel is obviously a
products and platforms.                                              prerequisite. Unfortunately, not much research has been
                                                                     done in this area. Thus, the motivation for this paper was
                                                                     to further such research.
ABSTRACT
                                                                     This paper examines the GPS signal channel near
This paper attempts to provide some insight into the                 receiver antennas. Specifically, it focuses on the signal
fading properties of GPS signals. When a GPS signal                  fading distribution due to masking and blocking effects
gets to an antenna, it suffers from masking and blocking             of surrounding objects. To do so incoming GPS signals
effects from surrounding objects. With respect to these              are first divided into three categories: Clear LOS signals,
effects, GPS signals can be divided into clear LOS                   Shadowed signals, and Blocked signals. A statistic
signals, shadowed signals, and blocked signals. A                    model, Urban Three-State Fade Model (UTSFM), is
statistic model, Urban Three-State Fade Model                        introduced to fit the fading histogram of real data. The
(UTSFM), is discussed in this paper. Experimental                    fitting results describe the signal composition based on
results show that this model can describe the fading                 the data.
distribution of GPS signals very well. After model fitting,
the model parameters can indicate the composition of the             The outline of this paper is a follows: the GPS signal
incoming signals in terms of the relative magnitude of               channel is discussed, a signal classification is presented,
the three signal types.                                              the Urban Three State Model is explained, and finally
                                                                     experimental data and model fitting is discussed. Some
INTRODUCTION                                                         conclusions and discussion of ensuing research conclude
                                                                     the paper.
Although GPS was first designed as a military system to
provide real time position, it is becoming a necessity in            GPS SIGNAL CHANNEL
people’s daily life. GPS receivers are now being made
smaller and smaller and can be integrated into many                  When a GPS signal propagates from a satellite to a
devices to provide both position and time with high                  receiver antenna, it suffers from degradation effects, such
accuracy. Its application has already extended to many               as, free space loss, refraction and absorption from the
areas, such as, earthquake detection, cellular phone                 atmosphere, reflection and masking from surrounding
positioning, so on and so forth.                                     objects such as trees and buildings, jamming, and
                                                                     environmental noise.
These new applications impose more serious
requirements on GPS itself. Traditionally, a GPS receiver
was required to function in an open area with a clear
view of the sky, but in new applications it is required to
work in degraded signal environments.

One typical example is the use of GPS in cellular phones
that are required to be “location Aware” for the E911
mandate in the near future ( FCC 2001). GPS is a
promising solution to this requirement since it can
provide position autonomously. However, when looking
at this problem in detail, there are many issues to address.
First, cellular phones are used in many places, not only in
open areas. This means the GPS receiver built in a
cellular phone must work well in places where there is
not much open sky, such as, urban canyons or inside a
building. From previous a study (Frank van Diggelen,                            Figure 1: GPS signal propagation
2001), it was shown that GPS signals become very weak


ION GPS 2001, 11-14 September 2001, Salt Lake City, UT         883
This paper focused on signal strength fading due to
reflection and masking by surrounding objects such as                 SIGNAL CLASSIFICATION
trees and buildings.
                                                                      With respect to fading effects, GPS signals can be
Huygens’ principle tells us that waves are propagated by              divided into three categories:
wavelets on sequential wave fronts. When an object
blocks some wavelets, waves of other wavelets can still               Clear line-of-sight (LOS) signal: This kind of signal
reach the shadowed region, but the signal strength is                 gets to the receiver antenna directly without any object in
decreased, as shown in Figure 2.                                      the way of propagation. Fading is only due to free space
                                                                      loss and atmosphere absorption.

                                                                      Shadowed signal: For this kind of signal, the
                                                                      propagation takes place over the first Fresnel zone
                                                                      through a medium that just attenuates the signal, such as,
                                                                      tree canopies.

                                                                      Blocked signal: The propagation path within the first
                                                                      Fresnel zone is completely obstructed so that signal
                                                                      reception is accomplished through diffraction and
                                                                      reflection (multipath).


                                                                      URBAN THREE STATE FADE MODEL
              Figure 2: Huygens’ Principle
                                                                      This is a statistical model, and has been utilized in the
Normally, the concept of the Fresnel zone especially the              study of land-mobile communication system (J.
first Fresnel zone is used to characterize the shadowing              Goldhirsh and Wolfhard J. Vogel 1998). It is used here to
and blocking effects (Barry McLarmon), as shown in                    describe the GPS signal fading distribution. The idea of
Figure 3.                                                             the model is quite simple: The fading distribution of the
                                                                      three types of signals discussed previously can be
                                                                      expressed by specific probability density functions (pdf),
                                                                      and the composite amplitude probability density function
                                                                      of GPS signals is the combination of them.

                                                                      Clear signals from a satellite correspond to clear LOS
                                                                      and multipath signals. In this case, the fading distribution
                                                                      can be expressed by a Ricean pdf

                                                                                                  [                  ]
                                                                          f Ricean (v ) = 2 Kv exp − K (v 2 + 1) I 0 (2 Kv )   (1)

                                                                      where v is the received voltage relative to the clear path
                                                                      voltage, K is the ratio of the direct power received to the
                  Figure 3: Fresnel Zone                              multipath power, and I 0 ( ) is the 0th order modified
The Fresnel zone is the volume of space enclosed by an                Bessel function.
ellipsoid, which has the two antennas A and B at the ends
of a radio link as its foci. The first Fresnel zone is an             If signals from a satellite are blocked, the received
ellipsoid defined such that the distance summation of a               signals consist of only multipath signals. In this case, the
point C on the ellipsoid to A and B is one wavelength                 fading distribution can be expressed by a Rayleigh pdf
longer than the direct distance between A and B, i.e.                 which is a special case of Ricean function without LOS
AC+CB = AB + λ. From experience, the fading effect is                 signal
negligible if there are no objects in the first Fresnel zone,
and the fading effect is thought serious if there are                                                 [
                                                                             f Rayleigh (v ) = 2 Kv exp − Kv 2   ]             (2)
objects in this region.


ION GPS 2001, 11-14 September 2001, Salt Lake City, UT          884
If signals from a satellite can be directly received but are                                                  In this paper, the fading histograms of real data were
attenuated by trees or other materials, these signals are                                                     fitted by adjusting the coefficients and parameters in the
called shadowed signals and the fading can be described                                                       model. The results indicate the composition of the
by Loo’s function (Chun Loo, 1985)                                                                            received signals.

                                      2 Kv
 f Loo ' s (v ) = 8.686                                                                                       EXPERIMENT DESCRIPTION
                                      π σ                                                         (3)
 ∞
         (20 log(z ) − m )2                 
                             − K (v 2 + z 2 ) I 0 (2 Kvz )dz
   1                                                                                                          Some experiments had been done to study how well the
 ∫z 
 0
     exp −
               2σ  2                        
                                             
                                                                                                              statistic model can describe GPS signal fading. The data
                                                                                                              were collected by the scheme shown in Figure 5.
In fact, shadowed signals consist of two parts: attenuated
LOS signals of which the fading is log normally
distributed and multipath signals of which the fading is                                                                   Reference
Rayleigh distributed.

In the Urban Three-State Fade Model, the composite
amplitude probability density function is the combination
of the above three pdf (R. Akturan and W. Vogel, 1997).                                                                                            Rover
 f v (α , v ) = C (α ) f Ricean (v ) + S (α ) f Loo (v ) + B(α ) f Rayleigh (v )                  (4)
C (α ) + S (α ) + B (α ) = 1

Where α is the elevation, and C (α ) , S (α ) , and B (α ) are                                                            Figure 5: Data collect scheme
weight coefficients. These coefficients can be thought as
indicators of the relative magnitude of the three kinds of                                                    The reference station receiver was located on the roof of
signals at a certain elevation.                                                                               a five story building with a very good view of the sky.
                                                                                                              The rover receiver was mounted on a car. The fading data
The following figure is an example of Ricean pdf,                                                             of rover were obtained by comparing the carrier to noise
Rayleigh pdf, and Loo’s pdf.                                                                                  density ratio, C/N0, between the two receivers. An
                                                                                                              assumption that there was not extra fading at reference
                      0.09
                                          PDF of Ricean, Rayleigh, and Loo                                    station was made. This means that the fading at reference
                                                                                                              station was due only to free space loss and absorption
                                                                                  Ricean
                      0.08
                                                                                  Rayleigh                    from atmosphere. This fading was also shared by the
                                                                                  Loo
                      0.07                                                                                    rover and could be removed by differencing. The fading
                      0.06                                                                                    difference between the rover and the reference station
                                                                                                              was thus due to masking effects of the surrounding
     Probability(%)


                      0.05
                                                                                                              objects near the rover. The receivers used at reference
                      0.04
                                                                                                              station and rover were the same in order to guarantee that
                      0.03                                                                                    the algorithms used to calculate the C/N0 were identical.
                      0.02
                                                                                                              Several typical working environments were chosen, and
                      0.01
                                                                                                              the masking effects varied from light to heavy. These
                        0
                        -40   -30   -20        -10       0       10          20     30       40               scenarios were as follows:
                                                     Fade (dB)

                                                                                                              •   Open sky (stationary test, data rate: 1Hz, time
                      Figure 4: pdf of Ricean, Rayleigh, and Loo’s                                                length: 1.5 hour)
                                                                                                              •   Road-side tree shadowing (kinematic test, update
The blue line is a Ricean pdf and is centered at 0dB for                                                          rate: 1 Hz, velocity: up to 50km/h, distance: about 50
clear signals. The red line corresponds to Loo’s function                                                         km, time length: about 2.5 hours)
and is commonly centered less than 10 dB for shadowed                                                         •   Moderate sub-urban with 2 or 3 floor buildings
signals. Finally, the green line corresponds to a Rayleigh                                                        (kinematic test, update rate: 1Hz, velocity: up to
pdf and is normally centered larger than 10 dB for                                                                50km/h, distance: about 40 km, time length: about 2
blocked signal.                                                                                                   hours)


ION GPS 2001, 11-14 September 2001, Salt Lake City, UT                                                  885
•    Urban canyons (Calgary, kinematic test, update                  Downtown San Francisco
     rate: 1Hz, velocity: up to 50km/h, distance: about 40
     km, time length: about 2.5 hours )

As discussed previously, the signal components were
determined by adjusting weight coefficients and
parameters in the model to fit the fading histograms of
collected data. The coefficients gave us the relative
magnitude of three categories of signals. To conduct the
model fitting, four elevation regions were chosen: 0-20°,
20-40°, 40-65°, and 65-90°. A separate model fitting was
done in each elevation region; Thus, the change of
signals with respect to the elevation could be studied.

The following steps are needed to complete a separate
model fitting:
1. Compute the signal fading histogram of collected
    data.
2. Adjust coefficient and parameters of Ricean function
    for clear signals
3. Adjust coefficient and parameters of Loo’s function
    for shadowed signals                                                                        Figure 6: Downtown San Francisco
4. Adjust coefficient and parameters of Rayleigh’s
    function for blocked signals                                                        0.03
                                                                                                       San Francisco Urban Canyon : Elevation (0-20 Degs)


5. The resultant coefficients give relative magnitude for                                                                                          Field Data
                                                                                                                                                   3-State Model
    each category of signals                                                           0.025


                                                                                        0.02
                                                                      Probability(%)


EXPERIMENTAL RESULTS                                                                   0.015


In this section, the model fitting results for each scenario                            0.01

are presented.
                                                                                       0.005

Urban Canyon Tests
                                                                                          0
                                                                                          -40    -30       -20    -10      0      10      20      30         40    50
                                                                                                                           Fade (dB)
Two urban canyon tests were performed to test the signal
fading in a location with heavy masking and blocking                                                              (a) Elevation 0-20°
                                                                                                       San Francisco Urban Canyon : Elevation (20-40 Degs)
effects. One was in downtown San Francisco and the                                     0.045
                                                                                                                                                   Field Data
other in downtown Calgary. Experimental results showed                                  0.04
                                                                                                                                                   3-State Model
that the fading effects in these two areas were consistent
in major signal components and fading magnitude.                                       0.035

                                                                                        0.03

Figure 6 shows a typical view of the signal environment
                                                                      Probability(%)


                                                                                       0.025
in downtown San Francisco. The plots in Figure 7 show
                                                                                        0.02
the theoretical pdf and the corresponding histogram of
the collected data. The blue lines in Figure 7 are the                                 0.015

histograms of the test data while the green lines                                       0.01

correspond to the model.                                                               0.005

                                                                                          0
                                                                                          -40    -30       -20    -10      0      10      20      30         40    50
                                                                                                                           Fade (dB)

                                                                                                                 (b) Elevation 20-40°


ION GPS 2001, 11-14 September 2001, Salt Lake City, UT         886
San Francisco Urban Canyon : Elevation (40-65 Degs)                    collected data. The blue lines in Figure 9 are the
                      0.1
                                                                               Field Data                 histograms of the test data while the green lines
                     0.09                                                      3-State Model
                                                                                                          correspond to the model.
                     0.08

                     0.07
    Probability(%)


                     0.06

                     0.05

                     0.04

                     0.03

                     0.02

                     0.01

                       0
                       -40   -30       -20    -10      0      10      20      30         40    50
                                                       Fade (dB)

                                              (c) Elevation 40-65°
                                   San Francisco Urban Canyon : Elevation (65-90 Degs)
                     0.25
                                                                               Field Data
                                                                               3-State Model

                      0.2
    Probability(%)


                     0.15


                      0.1                                                                                                                    Figure 8: Downtown Calgary

                                                                                                                                                 Calgary Urban Canyon : Elevation (0-20 Degs)
                     0.05                                                                                                    0.045
                                                                                                                                                                                          Field Data
                                                                                                                                                                                          3-State Model
                                                                                                                                   0.04
                       0
                       -40   -30       -20    -10      0      10      20      30         40    50                            0.035
                                                       Fade (dB)
                                                                                                                                   0.03
                                             (d) Elevation 65-90°
                                                                                                           Probability(%)


                                                                                                                             0.025

    Figure 7: Model Fitting Results for Urban Canyons                                                                              0.02
                    in San Francisco                                                                                         0.015


The following conclusions can be drawn from these                                                                                  0.01

results:                                                                                                                     0.005

                                                                                                                                     0
•                    In urban canyons, most signals were clear LOS                                                                   -40   -30   -20     -10      0      10
                                                                                                                                                                  Fade (dB)
                                                                                                                                                                                 20      30      40       50


                     signals and blocked signals. This is because there                                                                                  (a) Elevation 0-20°
                     were mainly concrete buildings instead of trees in
                     downtown.                                                                                                                   Calgary Urban Canyon : Elevation (20-40 Degs)
•                    The fading of blocked signals were centered at 10-                                                            0.06
                                                                                                                                                                                          Field Data
                     15dB.                                                                                                                                                                3-State Model
                                                                                                                                   0.05
•                    With the increase of elevation, the percentage of
                     clear signals increased, and the percentage of                                                                0.04
                     blocked signals decreased. This is obvious because
                                                                                                                  Probability(%)


                     of more open sky at higher elevation.                                                                         0.03
•                    The UTSFM fits the fading of real data well
                     although there are large discrepancies at the peaks of                                                        0.02
                     the histograms.
                                                                                                                                   0.01

Downtown Calgary
                                                                                                                                     0
                                                                                                                                     -40   -30   -20     -10      0      10      20      30      40       50
Figure 8 shows a typical view of the signal environment                                                                                                           Fade (dB)

in downtown Calgary. The plots in Figure 9 show the                                                                                                     (b) Elevation 20-40°
theoretical pdf and the corresponding histogram of the


ION GPS 2001, 11-14 September 2001, Salt Lake City, UT                                              887
Calgary Urban Canyon : Elevation (40-65 Degs)
                    0.09
                                                                           Field Data
                                                                           3-State Model
                    0.08

                    0.07

                    0.06
   Probability(%)


                    0.05

                    0.04

                    0.03

                    0.02

                    0.01

                      0
                      -40   -30   -20     -10      0      10      20      30      40       50
                                                   Fade (dB)

                                         (c) Elevation 40-65°                                                                        Figure 10: Campus Buildings

                                  Calgary Urban Canyon : Elevation (65-90 Degs)                                                              Campus Urban : Elevation (0-20 Degs)
                    0.16                                                                                               0.08
                                                                           Field Data                                                                                               Field Data
                                                                           3-State Model                                                                                            3-State Model
                    0.14                                                                                               0.07


                    0.12                                                                                               0.06


                     0.1                                                                                               0.05


                                                                                                      Probability(%)
   Probability(%)


                    0.08                                                                                               0.04


                    0.06                                                                                               0.03


                    0.04                                                                                               0.02


                    0.02                                                                                               0.01


                      0                                                                                                  0
                      -40   -30   -20     -10      0      10      20      30      40       50                            -40   -30     -20       -10     0      10       20         30    40        50
                                                   Fade (dB)                                                                                             Fade (dB)

                                         (d) Elevation 65-90°                                                                                    (a) Elevation 0-20°


  Figure 9: Model Fitting Results for Urban Canyons                                                                    0.14
                                                                                                                                         Campus Urban : Elevation (20-40 Degs)

                      in Calgary                                                                                                                                                    Field Data
                                                                                                                                                                                    3-State Model
                                                                                                                       0.12

The results in downtown Calgary were consistent with
                                                                                                                        0.1
those in downtown San Francisco:
• Most signals were clear LOS signals and blocked
                                                                                                      Probability(%)


                                                                                                                       0.08
    signals.
• The fading of blocked signals was centered at 10-                                                                    0.06

    15dB                                                                                                               0.04
• With the increase of elevation, the percentage of
    clear signals increased, and the percentage of                                                                     0.02

    blocked signals decreased.
                                                                                                                         0
                                                                                                                         -40   -30     -20       -10     0      10       20         30    40        50
                                                                                                                                                         Fade (dB)
Sub-Urban Test
                                                                                                                                                (b) Elevation 20-40°
This test was done at the University of Calgary where
there are many 2-3 story buildings. Figure 10 shows a
few buildings in the testing area, and Figure 11 shows the
model fitting results.


ION GPS 2001, 11-14 September 2001, Salt Lake City, UT                                          888
Campus Urban : Elevation (40-65 Degs)
                     0.18
                                                                             Field Data
                                                                             3-State Model
                     0.16

                     0.14

                     0.12
    Probability(%)


                      0.1

                     0.08

                     0.06

                     0.04

                     0.02

                       0
                       -40   -30   -20    -10     0      10      20      30        40        50
                                                  Fade (dB)

                                         (c) Elevation 40-65°

                                     Campus Urban : Elevation (65-90 Degs)
                     0.35
                                                                             Field Data
                                                                                                            Figure 12: Roadside Trees near the University of
                      0.3
                                                                             3-State Model
                                                                                                                               Calgary

                     0.25                                                                                                              Calgary Road Side Tree : Elevation (0-20 Degs)
                                                                                                                         0.07
                                                                                                                                                                                  Field Data
    Probability(%)


                      0.2                                                                                                                                                         3-State Model
                                                                                                                         0.06

                     0.15
                                                                                                                         0.05

                      0.1
                                                                                                        Probability(%)

                                                                                                                         0.04

                     0.05
                                                                                                                         0.03

                       0
                       -40   -30   -20    -10     0      10      20      30        40        50                          0.02
                                                  Fade (dB)

                                         (d) Elevation 65-90°                                                            0.01


                                                                                                                           0
                     Figure 11: Model Fitting Results for Suburban                                                         -40   -30    -20     -10      0      10       20     30       40       50
                                                                                                                                                         Fade (dB)
                              in the University of Calgary
                                                                                                                                                (a) Elevation 0-20°
The following conclusions can be drawn from these
results:                                                                                                                 0.12
                                                                                                                                       Calgary Road Side Tree : Elevation (20-40 Degs)

                                                                                                                                                                                  Field Data
                                                                                                                                                                                  3-State Model

•                    The blocked signals appeared only at low elevation                                                   0.1

                     because of the low height of surrounding buildings.
•                    Shadowed signals made considerable contribution to                                                  0.08
                                                                                                        Probability(%)


                     the overall signal, and appeared at low or middle
                     elevation regions.                                                                                  0.06

•                    With the increase of elevation, clear LOS signals
                                                                                                                         0.04
                     increased a lot and shadowed signals decreased
                     quickly.
                                                                                                                         0.02
•                    The UTSFM fits the real data very well.
                                                                                                                           0
Road Side Test                                                                                                             -40   -30    -20     -10      0      10
                                                                                                                                                         Fade (dB)
                                                                                                                                                                         20     30       40       50


                                                                                                                                               (b) Elevation 20-40°
This test aimed to study the fading due to tree canopies,
and was done in a park close to the University of
Calgary. A picture of the park is shown in Figure 12 and
the model fitting results are shown in Figure 13.


ION GPS 2001, 11-14 September 2001, Salt Lake City, UT                                            889
Calgary Road Side Tree : Elevation (40-65 Degs)
                    0.14
                                                                             Field Data
                                                                             3-State Model
                    0.12


                     0.1
   Probability(%)


                    0.08


                    0.06


                    0.04


                    0.02


                      0
                      -40   -30    -20     -10      0      10       20     30       40       50
                                                    Fade (dB)

                                          (c) Elevation 40-65°
                                                                                                        Figure 14: Parking Lot in the University of Calgary
                                  Calgary Road Side Tree : Elevation (65-90 Degs)
                    0.25
                                                                             Field Data
                                                                             3-State Model                                                   Open Sky : Elevation (0-20 Degs)
                                                                                                                          0.1
                     0.2                                                                                                                                                         Field Data
                                                                                                                         0.09                                                    3-State Model

                                                                                                                         0.08
   Probability(%)


                    0.15
                                                                                                                         0.07


                                                                                                        Probability(%)
                                                                                                                         0.06
                     0.1
                                                                                                                         0.05

                                                                                                                         0.04
                    0.05
                                                                                                                         0.03

                                                                                                                         0.02
                      0
                      -40   -30    -20     -10      0      10       20     30       40       50                          0.01
                                                    Fade (dB)
                                                                                                                           0
                                          (a) Elevation 65-90°                                                             -40   -30   -20     -10      0      10       20       30    40        50
                                                                                                                                                        Fade (dB)


 Figure 13: Model Fitting Results for Roadside Trees                                                                                           (a) Elevation 0-20°
            near the University of Calgary
                                                                                                                                             Open Sky : Elevation (20-40 Degs)
                                                                                                                          0.2
                                                                                                                                                                                 Field Data
                                                                                                                         0.18                                                    3-State Model
The following conclusions can be drawn from these                                                                        0.16
results:
                                                                                                                         0.14
• Most signals were clear LOS signals and shadowed
     signals.
                                                                                                        Probability(%)


                                                                                                                         0.12


• Blocked signals appeared only at very low elevation                                                                     0.1

     because there were some low buildings nearby.                                                                       0.08

• Shadowed signals consistently contributed to the                                                                       0.06

     overall signal at all elevation..                                                                                   0.04

• The fading due to the shadowing effects of tree                                                                        0.02
     canopies was about 2-5dB.                                                                                             0
• UTSFM fits the real data very well.                                                                                      -40   -30   -20     -10      0      10
                                                                                                                                                        Fade (dB)
                                                                                                                                                                        20       30    40        50


                                                                                                                                              (b) Elevation 20-40°


Open Sky Test

This test was a static test and performed at a large
parking lot in the University of Calgary. The picture of
the parking lot and the results of the test are shown in
Figure 14 and Figure 15.


ION GPS 2001, 11-14 September 2001, Salt Lake City, UT                                            890
Open Sky : Elevation (40-65 Degs)                              canopies was several dB. In this case, the satellites could
                    0.25
                                                                            Field Data                 still be tracked. With the increase of elevation, the
                                                                            3-State Model
                                                                                                       percentage of clear signals increased and the percentage
                     0.2
                                                                                                       of shadowed and blocked signals decreased because there
                                                                                                       was more open sky when the elevation was higher.
   Probability(%)


                    0.15

                                                                                                       In the future, more experiments will be done in different
                     0.1
                                                                                                       environments, and more analysis will be conducted to
                                                                                                       determine the empirical values for model parameters.
                                                                                                       Indoor GPS experiments and signal analysis will also be
                    0.05
                                                                                                       addressed since GPS receiver may be required in such
                                                                                                       serious conditions.
                      0
                      -40   -30   -20     -10      0      10       20       30    40        50
                                                   Fade (dB)
                                                                                                       REFERENCES
                                         (c) Elevation 40-65°

                                        Open Sky : Elevation (65-90 Degs)
                                                                                                       Barry    McLarmon,       VHF/UHF/Microwave         Radio
                    0.35
                                                                            Field Data
                                                                                                       Propagation: A Primer for Digital Experimenters,
                                                                            3-State Model              http://www.tapr.org/tapr/html/ve3jf.dcc97/ve3jf.dcc97.ht
                     0.3
                                                                                                       ml
                    0.25

                                                                                                       Chun Loo (1985) A statistical model for a land mobile
   Probability(%)


                     0.2
                                                                                                       satellite link, IEEE Transactions on Vehicular
                    0.15                                                                               Technology, Vol. VT-34, No.3, Aug., 122-127.

                     0.1                                                                               FCC (2001), FCC wireless 911 requirements,
                                                                                                       http://www.fcc.gov/e911/factsheet_requirements_012001
                    0.05
                                                                                                       .pdf
                      0
                      -40   -30   -20     -10      0      10       20       30    40        50
                                                   Fade (dB)                                           Frank van Diggelen (2001), Indoor GPS: Wireless
                                         (d) Elevation 65-90°                                          Aiding and Low SNR Detection, Navtech 218,
                                                                                                       http://www.navtechgps.com/seminars/sem218.asp
  Figure 15: Model Fitting Results for Open Ske Test
             in the University of Calgary                                                              Julius Goldhirsh and Wolfhard J. Vogel (1998)
                                                                                                       Handbook of propagation effects for vehicular and
Most signals here were clear LOS signals. Only at low                                                  personal        mobile          satellite       system,
elevation were there some shadowed signals because                                                     http://www.utexas.edu/research/mopro/index.html
there were trees at the edges of the parking lot. In this
experiment, the model fitted the real data very well.                                                  R. Akturan and W. Vogel (1997), Path Diversity for LEO
                                                                                                       Satellite-PCS in the Urban Environmenet, IEEE
In the appendix, the fitting results also appear in five                                               Antennas and Propagation Vol. 45, No. 7, 1107-1116.
tables. The values of the model parameters show the
same results as discussed above.

CONCLUSIONS AND FUTURE WORK

The Urban Three-State Fade Model (UTSFM) is a useful
statistical model for describing the fading distribution of
GPS signals due to masking and blocking effects of
surrounding objects. The following conclusions result
from the experiments performed in this study. In urban
canyons, most received GPS signals were clear LOS
signals and blocked signals. The fading due to blocking
effects was larger than 10dB. In the case of roadside trees
shadowing due mostly to trees, most signals were clear
signals and shadowed signals. The fading due to tree


ION GPS 2001, 11-14 September 2001, Salt Lake City, UT                                           891
APPENDIX: MODEL FITTING RESULTS


                              Table 1. Model Fitting Results for San Francisco Urban Canyons

           Elevation          C            PDF            S                PDF               B         PDF
           (Degree)                      (Ricean)                        (Loo’s)                    (Rayleigh)
              0~20           0.27          K=2           0.13     K = 20 m = -4 σ = 3       0.60      K = 16


             20~40           0.35         K = 14         0.10    K = 20 m = -4 σ = 0.5      0.55      K = 20


             40~65           0.37         K = 70         0.18     K = 20 m = -4 σ = 2       0.45      K = 16


             65~90           0.66         K = 100        0.19    K = 20 m = -2.5 σ = 2      0.15      K = 16


              0~90           0.37         K = 30         0.18    K = 20 m = -4 σ = 2.5      0.45      K = 18


                                    Table 2. Model Fitting Results for Calgary Urban Canyons

           Elevation         C             PDF            S                PDF               B         PDF
           (Degree)                      (Ricean)                        (Loo’s)                    (Rayleigh)
             0~20           0.22          K =9.8         0.0      K = 20 m = -4 σ = 3       0.78      K = 15


             20~40          0.38          K = 22         0.07    K = 100 m = -6 σ = 4       0.55      K = 20


             40~65          0.49          K = 22         0.18    K = 100 m = -3.5 σ = 3     0.35      K = 25


             65~90          0.74          K = 25         0.19    K = 120 m = -2 σ = 4       0.08      K = 50


             0~90           0.52          K = 20         0.13    K = 100 m = -2 σ = 3       0.35      K = 18


                          Table 3. Model Fitting Results for Sub-Urban Area ( University Campus)

           Elevation          C            PDF            S                PDF                B        PDF
           (Degree)                      (Ricean)                        (Loo’s)                    (Rayleigh)
              0~20           0.3           K =10         0.65    K = 20 m = -3 σ = 1.5      0.05      K = 100


             20~40          0.58          K = 20         0.41    K = 20 m = -1.6 σ = 2.3    0.01      K = 120


             40~65          0.68          K = 55         0.32    K = 20 m = -3.5 σ = 2      0.001     K = 120


             65~90          0.90          K = 120        0.10    K = 150 m = -4.5 σ = 4.5   0.001     K = 120


              0~90          0.70          K = 35         0.30    K = 20 m = -3.5 σ = 2.5    0.01      K = 120


ION GPS 2001, 11-14 September 2001, Salt Lake City, UT          892
Table 4. Model Fitting Results for Road Side Trees


              Elevation         C            PDF          S                     PDF             B         PDF
              (Degree)                     (Ricean)                           (Loo’s)                  (Rayleigh)
                0~20           0.38         K =15        0.55      K = 15 m = -4 σ = 0.5       0.07     K = 100


            20~40              0.4          K = 35       0.58      K = 15 m = -2.5 σ = 2       0.02     K = 120


            40~65              0.45         K = 60       0.54          K = 15 m = -3 σ = 4     0.01     K = 120


            65~90              0.63        K = 150       0.46      K = 150 m = -4.5 σ = 4.5    0.01     K = 120


            0~90               0.57         K = 35       0.41          K = 20 m = -4.2 σ = 3   0.02     K = 120


                                          Table 5. Model Fitting Results for Open Sky

              Elevation         C            PDF           S                    PDF              B        PDF
              (Degree)                     (Ricean)                           (Loo’s)                  (Rayleigh)
                0~20           0.65          K =13       0.35             K = 30 m = -2.2      0.005     K = 120
                                                                              σ = 1.5

                20~40          0.955        K = 35       0.04             K = 70 m = -3.3      0.005     K = 120
                                                                              σ = 0.5

                40~65          0.975        K = 67       0.025            K = 15 m = -1.8      0.001     K = 120
                                                                              σ = 0.3

                65~90           1.0         K = 150        0                                     0


                0~90           0.87         K = 38       0.13              K = 30 m = -2       0.003       120
                                                                             σ = 1.5


ION GPS 2001, 11-14 September 2001, Salt Lake City, UT           893

More Related Content

Viewers also liked

Field Test Assessment of Assisted GPS and High Sensitivity GPS Receivers unde...
Field Test Assessment of Assisted GPS and High Sensitivity GPS Receivers unde...Field Test Assessment of Assisted GPS and High Sensitivity GPS Receivers unde...
Field Test Assessment of Assisted GPS and High Sensitivity GPS Receivers unde...gfcox
 
Keelekorraldus / Perekonnanimede muutmisest ja panekust / Carina Loit, Jana S...
Keelekorraldus / Perekonnanimede muutmisest ja panekust / Carina Loit, Jana S...Keelekorraldus / Perekonnanimede muutmisest ja panekust / Carina Loit, Jana S...
Keelekorraldus / Perekonnanimede muutmisest ja panekust / Carina Loit, Jana S...tuulepealne
 
Degraded GPS Signal Measurements
Degraded GPS Signal MeasurementsDegraded GPS Signal Measurements
Degraded GPS Signal Measurementsgfcox
 

Viewers also liked (8)

Stanfordcomplaint
StanfordcomplaintStanfordcomplaint
Stanfordcomplaint
 
Reg Reform Fact Sheet
Reg Reform Fact SheetReg Reform Fact Sheet
Reg Reform Fact Sheet
 
Sklling Analysis
Sklling AnalysisSklling Analysis
Sklling Analysis
 
Field Test Assessment of Assisted GPS and High Sensitivity GPS Receivers unde...
Field Test Assessment of Assisted GPS and High Sensitivity GPS Receivers unde...Field Test Assessment of Assisted GPS and High Sensitivity GPS Receivers unde...
Field Test Assessment of Assisted GPS and High Sensitivity GPS Receivers unde...
 
Bush Legacy Booklet
Bush Legacy BookletBush Legacy Booklet
Bush Legacy Booklet
 
Keelekorraldus / Perekonnanimede muutmisest ja panekust / Carina Loit, Jana S...
Keelekorraldus / Perekonnanimede muutmisest ja panekust / Carina Loit, Jana S...Keelekorraldus / Perekonnanimede muutmisest ja panekust / Carina Loit, Jana S...
Keelekorraldus / Perekonnanimede muutmisest ja panekust / Carina Loit, Jana S...
 
Avellinocomplaint
AvellinocomplaintAvellinocomplaint
Avellinocomplaint
 
Degraded GPS Signal Measurements
Degraded GPS Signal MeasurementsDegraded GPS Signal Measurements
Degraded GPS Signal Measurements
 

Similar to GPS Signal Degradation Modeling

Effect of Kinematics and Interference on Assisted GPS (AGPS)
Effect of Kinematics and Interference on Assisted GPS (AGPS)Effect of Kinematics and Interference on Assisted GPS (AGPS)
Effect of Kinematics and Interference on Assisted GPS (AGPS)gfcox
 
Background positioning huber
Background positioning huberBackground positioning huber
Background positioning huberevegod
 
Ubiquitous Positioning: A Taxonomy for Location Determination on Mobile Navig...
Ubiquitous Positioning: A Taxonomy for Location Determination on Mobile Navig...Ubiquitous Positioning: A Taxonomy for Location Determination on Mobile Navig...
Ubiquitous Positioning: A Taxonomy for Location Determination on Mobile Navig...sipij
 
Indoor gps via QR codes
Indoor gps via QR codesIndoor gps via QR codes
Indoor gps via QR codesVaibhav Sharma
 
Ar2419141919
Ar2419141919Ar2419141919
Ar2419141919IJMER
 
A genetic based indoor positioning algorithm using Wi-Fi received signal stre...
A genetic based indoor positioning algorithm using Wi-Fi received signal stre...A genetic based indoor positioning algorithm using Wi-Fi received signal stre...
A genetic based indoor positioning algorithm using Wi-Fi received signal stre...IAESIJAI
 
Evolution Of AGPS And E911
Evolution Of AGPS And E911Evolution Of AGPS And E911
Evolution Of AGPS And E911ronrulzzz
 
Location Based services
Location Based servicesLocation Based services
Location Based servicesFraj Alshahibi
 
Gps methodology cut
Gps methodology cutGps methodology cut
Gps methodology cutAtique Ahmed
 
HVW3-PageResume10Jan2013++
HVW3-PageResume10Jan2013++HVW3-PageResume10Jan2013++
HVW3-PageResume10Jan2013++Harry Winsor
 
FINGERPRINT LOCATION METHODS USING RAY-TRACING
FINGERPRINT LOCATION METHODS USING RAY-TRACINGFINGERPRINT LOCATION METHODS USING RAY-TRACING
FINGERPRINT LOCATION METHODS USING RAY-TRACINGmarcelonog29
 
Design of Optimized low-power GPS-Yagi Antenna using Machine Learning techniques
Design of Optimized low-power GPS-Yagi Antenna using Machine Learning techniquesDesign of Optimized low-power GPS-Yagi Antenna using Machine Learning techniques
Design of Optimized low-power GPS-Yagi Antenna using Machine Learning techniquesChristo Ananth
 
Istvan szini resume
Istvan szini resumeIstvan szini resume
Istvan szini resumeIstvan Szini
 
5G VS WI-FI INDOOR POSITIONING: A COMPARATIVE STUDY
5G VS WI-FI INDOOR POSITIONING: A COMPARATIVE STUDY5G VS WI-FI INDOOR POSITIONING: A COMPARATIVE STUDY
5G VS WI-FI INDOOR POSITIONING: A COMPARATIVE STUDYIJCSES Journal
 
5G Vs Wi-Fi Indoor Positioning: A Comparative Study
5G Vs Wi-Fi Indoor Positioning: A Comparative Study5G Vs Wi-Fi Indoor Positioning: A Comparative Study
5G Vs Wi-Fi Indoor Positioning: A Comparative StudyIJCSES Journal
 

Similar to GPS Signal Degradation Modeling (20)

Effect of Kinematics and Interference on Assisted GPS (AGPS)
Effect of Kinematics and Interference on Assisted GPS (AGPS)Effect of Kinematics and Interference on Assisted GPS (AGPS)
Effect of Kinematics and Interference on Assisted GPS (AGPS)
 
Background positioning huber
Background positioning huberBackground positioning huber
Background positioning huber
 
Ubiquitous Positioning: A Taxonomy for Location Determination on Mobile Navig...
Ubiquitous Positioning: A Taxonomy for Location Determination on Mobile Navig...Ubiquitous Positioning: A Taxonomy for Location Determination on Mobile Navig...
Ubiquitous Positioning: A Taxonomy for Location Determination on Mobile Navig...
 
Indoor gps via QR codes
Indoor gps via QR codesIndoor gps via QR codes
Indoor gps via QR codes
 
Ar2419141919
Ar2419141919Ar2419141919
Ar2419141919
 
A genetic based indoor positioning algorithm using Wi-Fi received signal stre...
A genetic based indoor positioning algorithm using Wi-Fi received signal stre...A genetic based indoor positioning algorithm using Wi-Fi received signal stre...
A genetic based indoor positioning algorithm using Wi-Fi received signal stre...
 
Evolution Of AGPS And E911
Evolution Of AGPS And E911Evolution Of AGPS And E911
Evolution Of AGPS And E911
 
8 17
8 178 17
8 17
 
8 17
8 178 17
8 17
 
Location Based services
Location Based servicesLocation Based services
Location Based services
 
Gps methodology cut
Gps methodology cutGps methodology cut
Gps methodology cut
 
HVW3-PageResume10Jan2013++
HVW3-PageResume10Jan2013++HVW3-PageResume10Jan2013++
HVW3-PageResume10Jan2013++
 
Chandan bhattacharya
Chandan bhattacharyaChandan bhattacharya
Chandan bhattacharya
 
FINGERPRINT LOCATION METHODS USING RAY-TRACING
FINGERPRINT LOCATION METHODS USING RAY-TRACINGFINGERPRINT LOCATION METHODS USING RAY-TRACING
FINGERPRINT LOCATION METHODS USING RAY-TRACING
 
Design of Optimized low-power GPS-Yagi Antenna using Machine Learning techniques
Design of Optimized low-power GPS-Yagi Antenna using Machine Learning techniquesDesign of Optimized low-power GPS-Yagi Antenna using Machine Learning techniques
Design of Optimized low-power GPS-Yagi Antenna using Machine Learning techniques
 
Istvan szini resume
Istvan szini resumeIstvan szini resume
Istvan szini resume
 
CV_Jared Manzano
CV_Jared ManzanoCV_Jared Manzano
CV_Jared Manzano
 
Ijetcas14 474
Ijetcas14 474Ijetcas14 474
Ijetcas14 474
 
5G VS WI-FI INDOOR POSITIONING: A COMPARATIVE STUDY
5G VS WI-FI INDOOR POSITIONING: A COMPARATIVE STUDY5G VS WI-FI INDOOR POSITIONING: A COMPARATIVE STUDY
5G VS WI-FI INDOOR POSITIONING: A COMPARATIVE STUDY
 
5G Vs Wi-Fi Indoor Positioning: A Comparative Study
5G Vs Wi-Fi Indoor Positioning: A Comparative Study5G Vs Wi-Fi Indoor Positioning: A Comparative Study
5G Vs Wi-Fi Indoor Positioning: A Comparative Study
 

GPS Signal Degradation Modeling

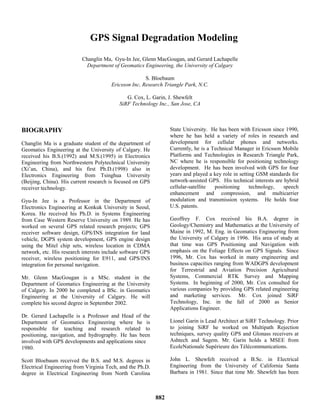
  • 1. GPS Signal Degradation Modeling Changlin Ma, Gyu-In Jee, Glenn MacGougan, and Gerard Lachapelle Department of Geomatics Engineering, the University of Calgary S. Bloebaum Ericsson Inc, Research Triangle Park, N.C. G. Cox, L. Garin, J. Shewfelt SiRF Technology Inc., San Jose, CA BIOGRAPHY State University. He has been with Ericsson since 1990, where he has held a variety of roles in research and Changlin Ma is a graduate student of the department of development for cellular phones and networks. Geomatics Engineering at the University of Calgary. He Currently, he is a Technical Manager in Ericsson Mobile received his B.S.(1992) and M.S.(1995) in Electronics Platforms and Technologies in Research Triangle Park, Engineering from Northwestern Polytechnical University NC where he is responsible for positioning technology (Xi’an, China), and his first Ph.D.(1998) also in development. He has been involved with GPS for four Electronics Engineering from Tsinghua University years and played a key role in setting GSM standards for (Beijing, China). His current research is focused on GPS network-assisted GPS. His technical interests are hybrid receiver technology. cellular-satellite positioning technology, speech enhancement and compression, and multicarrier Gyu-In Jee is a Professor in the Department of modulation and transmission systems. He holds four Electronics Engineering at Konkuk University in Seoul, U.S. patents. Korea. He received his Ph.D. in Systems Engineering from Case Western Reserve University on 1989. He has Geoffrey F. Cox received his B.A. degree in worked on several GPS related research projects; GPS Geology/Chemistry and Mathematics at the University of receiver software design, GPS/INS integration for land Maine in 1992, M. Eng. in Geomatics Engineering from vehicle, DGPS system development, GPS engine design the University of Calgary in 1996. His area of study at using the Mitel chip sets, wireless location in CDMA that time was GPS Positioning and Navigation with network, etc. His research interests include software GPS emphasis on the Foliage Effects on GPS Signals. Since receiver, wireless positioning for E911, and GPS/INS 1996, Mr. Cox has worked in many engineering and integration for personal navigation. business capacities ranging from WADGPS development for Terrestrial and Aviation Precision Agricultural Mr. Glenn MacGougan is a MSc. student in the Systems, Commercial RTK Survey and Mapping Department of Geomatics Engineering at the University Systems. In beginning of 2000, Mr. Cox consulted for of Calgary. In 2000 he completed a BSc. in Geomatics various companies by providing GPS related engineering Engineering at the University of Calgary. He will and marketing services. Mr. Cox joined SiRF complete his second degree in September 2002. Technology, Inc. in the fall of 2000 as Senior Applications Engineer. Dr. Gerard Lachapelle is a Professor and Head of the Department of Geomatics Engineering where he is Lionel Garin is Lead Architect at SiRF Technology. Prior responsible for teaching and research related to to joining SiRF he worked on Multipath Rejection positioning, navigation, and hydrography. He has been techniques, survey quality GPS and Glonass receivers at involved with GPS developments and applications since Ashtech and Sagem. Mr. Garin holds a MSEE from 1980. EcoleNationale Supérieure des Télécommunications. Scott Bloebaum received the B.S. and M.S. degrees in John L. Shewfelt received a B.Sc. in Electrical Electrical Engineering from Virginia Tech, and the Ph.D. Engineering from the University of California Santa degree in Electrical Engineering from North Carolina Barbara in 1981. Since that time Mr. Shewfelt has been ION GPS 2001, 11-14 September 2001, Salt Lake City, UT 882
  • 2. involved in design, development, test and integration of in this case, thus requiring a GPS receiver to be able to complex avionics and guidance systems for various types acquire and track weak signals. Secondly, GPS signals in of aircraft and naval platforms, including working with these serious situations can contain serious multipath microwave radars and receivers, Jammers, UV and IR signals, which can degrade positioning accuracy imaging systems, and GPS/INS guidance and control. In significantly. March of 2000, Mr. Shewfelt joined SiRF Technology Inc. as Applications Engineering Manager to facilitate To understand and perhaps solve these problems the integration of GPS technology into embedded knowledge about the GPS signal channel is obviously a products and platforms. prerequisite. Unfortunately, not much research has been done in this area. Thus, the motivation for this paper was to further such research. ABSTRACT This paper examines the GPS signal channel near This paper attempts to provide some insight into the receiver antennas. Specifically, it focuses on the signal fading properties of GPS signals. When a GPS signal fading distribution due to masking and blocking effects gets to an antenna, it suffers from masking and blocking of surrounding objects. To do so incoming GPS signals effects from surrounding objects. With respect to these are first divided into three categories: Clear LOS signals, effects, GPS signals can be divided into clear LOS Shadowed signals, and Blocked signals. A statistic signals, shadowed signals, and blocked signals. A model, Urban Three-State Fade Model (UTSFM), is statistic model, Urban Three-State Fade Model introduced to fit the fading histogram of real data. The (UTSFM), is discussed in this paper. Experimental fitting results describe the signal composition based on results show that this model can describe the fading the data. distribution of GPS signals very well. After model fitting, the model parameters can indicate the composition of the The outline of this paper is a follows: the GPS signal incoming signals in terms of the relative magnitude of channel is discussed, a signal classification is presented, the three signal types. the Urban Three State Model is explained, and finally experimental data and model fitting is discussed. Some INTRODUCTION conclusions and discussion of ensuing research conclude the paper. Although GPS was first designed as a military system to provide real time position, it is becoming a necessity in GPS SIGNAL CHANNEL people’s daily life. GPS receivers are now being made smaller and smaller and can be integrated into many When a GPS signal propagates from a satellite to a devices to provide both position and time with high receiver antenna, it suffers from degradation effects, such accuracy. Its application has already extended to many as, free space loss, refraction and absorption from the areas, such as, earthquake detection, cellular phone atmosphere, reflection and masking from surrounding positioning, so on and so forth. objects such as trees and buildings, jamming, and environmental noise. These new applications impose more serious requirements on GPS itself. Traditionally, a GPS receiver was required to function in an open area with a clear view of the sky, but in new applications it is required to work in degraded signal environments. One typical example is the use of GPS in cellular phones that are required to be “location Aware” for the E911 mandate in the near future ( FCC 2001). GPS is a promising solution to this requirement since it can provide position autonomously. However, when looking at this problem in detail, there are many issues to address. First, cellular phones are used in many places, not only in open areas. This means the GPS receiver built in a cellular phone must work well in places where there is not much open sky, such as, urban canyons or inside a building. From previous a study (Frank van Diggelen, Figure 1: GPS signal propagation 2001), it was shown that GPS signals become very weak ION GPS 2001, 11-14 September 2001, Salt Lake City, UT 883
  • 3. This paper focused on signal strength fading due to reflection and masking by surrounding objects such as SIGNAL CLASSIFICATION trees and buildings. With respect to fading effects, GPS signals can be Huygens’ principle tells us that waves are propagated by divided into three categories: wavelets on sequential wave fronts. When an object blocks some wavelets, waves of other wavelets can still Clear line-of-sight (LOS) signal: This kind of signal reach the shadowed region, but the signal strength is gets to the receiver antenna directly without any object in decreased, as shown in Figure 2. the way of propagation. Fading is only due to free space loss and atmosphere absorption. Shadowed signal: For this kind of signal, the propagation takes place over the first Fresnel zone through a medium that just attenuates the signal, such as, tree canopies. Blocked signal: The propagation path within the first Fresnel zone is completely obstructed so that signal reception is accomplished through diffraction and reflection (multipath). URBAN THREE STATE FADE MODEL Figure 2: Huygens’ Principle This is a statistical model, and has been utilized in the Normally, the concept of the Fresnel zone especially the study of land-mobile communication system (J. first Fresnel zone is used to characterize the shadowing Goldhirsh and Wolfhard J. Vogel 1998). It is used here to and blocking effects (Barry McLarmon), as shown in describe the GPS signal fading distribution. The idea of Figure 3. the model is quite simple: The fading distribution of the three types of signals discussed previously can be expressed by specific probability density functions (pdf), and the composite amplitude probability density function of GPS signals is the combination of them. Clear signals from a satellite correspond to clear LOS and multipath signals. In this case, the fading distribution can be expressed by a Ricean pdf [ ] f Ricean (v ) = 2 Kv exp − K (v 2 + 1) I 0 (2 Kv ) (1) where v is the received voltage relative to the clear path voltage, K is the ratio of the direct power received to the Figure 3: Fresnel Zone multipath power, and I 0 ( ) is the 0th order modified The Fresnel zone is the volume of space enclosed by an Bessel function. ellipsoid, which has the two antennas A and B at the ends of a radio link as its foci. The first Fresnel zone is an If signals from a satellite are blocked, the received ellipsoid defined such that the distance summation of a signals consist of only multipath signals. In this case, the point C on the ellipsoid to A and B is one wavelength fading distribution can be expressed by a Rayleigh pdf longer than the direct distance between A and B, i.e. which is a special case of Ricean function without LOS AC+CB = AB + λ. From experience, the fading effect is signal negligible if there are no objects in the first Fresnel zone, and the fading effect is thought serious if there are [ f Rayleigh (v ) = 2 Kv exp − Kv 2 ] (2) objects in this region. ION GPS 2001, 11-14 September 2001, Salt Lake City, UT 884
  • 4. If signals from a satellite can be directly received but are In this paper, the fading histograms of real data were attenuated by trees or other materials, these signals are fitted by adjusting the coefficients and parameters in the called shadowed signals and the fading can be described model. The results indicate the composition of the by Loo’s function (Chun Loo, 1985) received signals. 2 Kv f Loo ' s (v ) = 8.686 EXPERIMENT DESCRIPTION π σ (3) ∞  (20 log(z ) − m )2  − K (v 2 + z 2 ) I 0 (2 Kvz )dz 1 Some experiments had been done to study how well the ∫z  0 exp −  2σ 2   statistic model can describe GPS signal fading. The data were collected by the scheme shown in Figure 5. In fact, shadowed signals consist of two parts: attenuated LOS signals of which the fading is log normally distributed and multipath signals of which the fading is Reference Rayleigh distributed. In the Urban Three-State Fade Model, the composite amplitude probability density function is the combination of the above three pdf (R. Akturan and W. Vogel, 1997). Rover f v (α , v ) = C (α ) f Ricean (v ) + S (α ) f Loo (v ) + B(α ) f Rayleigh (v ) (4) C (α ) + S (α ) + B (α ) = 1 Where α is the elevation, and C (α ) , S (α ) , and B (α ) are Figure 5: Data collect scheme weight coefficients. These coefficients can be thought as indicators of the relative magnitude of the three kinds of The reference station receiver was located on the roof of signals at a certain elevation. a five story building with a very good view of the sky. The rover receiver was mounted on a car. The fading data The following figure is an example of Ricean pdf, of rover were obtained by comparing the carrier to noise Rayleigh pdf, and Loo’s pdf. density ratio, C/N0, between the two receivers. An assumption that there was not extra fading at reference 0.09 PDF of Ricean, Rayleigh, and Loo station was made. This means that the fading at reference station was due only to free space loss and absorption Ricean 0.08 Rayleigh from atmosphere. This fading was also shared by the Loo 0.07 rover and could be removed by differencing. The fading 0.06 difference between the rover and the reference station was thus due to masking effects of the surrounding Probability(%) 0.05 objects near the rover. The receivers used at reference 0.04 station and rover were the same in order to guarantee that 0.03 the algorithms used to calculate the C/N0 were identical. 0.02 Several typical working environments were chosen, and 0.01 the masking effects varied from light to heavy. These 0 -40 -30 -20 -10 0 10 20 30 40 scenarios were as follows: Fade (dB) • Open sky (stationary test, data rate: 1Hz, time Figure 4: pdf of Ricean, Rayleigh, and Loo’s length: 1.5 hour) • Road-side tree shadowing (kinematic test, update The blue line is a Ricean pdf and is centered at 0dB for rate: 1 Hz, velocity: up to 50km/h, distance: about 50 clear signals. The red line corresponds to Loo’s function km, time length: about 2.5 hours) and is commonly centered less than 10 dB for shadowed • Moderate sub-urban with 2 or 3 floor buildings signals. Finally, the green line corresponds to a Rayleigh (kinematic test, update rate: 1Hz, velocity: up to pdf and is normally centered larger than 10 dB for 50km/h, distance: about 40 km, time length: about 2 blocked signal. hours) ION GPS 2001, 11-14 September 2001, Salt Lake City, UT 885
  • 5. Urban canyons (Calgary, kinematic test, update Downtown San Francisco rate: 1Hz, velocity: up to 50km/h, distance: about 40 km, time length: about 2.5 hours ) As discussed previously, the signal components were determined by adjusting weight coefficients and parameters in the model to fit the fading histograms of collected data. The coefficients gave us the relative magnitude of three categories of signals. To conduct the model fitting, four elevation regions were chosen: 0-20°, 20-40°, 40-65°, and 65-90°. A separate model fitting was done in each elevation region; Thus, the change of signals with respect to the elevation could be studied. The following steps are needed to complete a separate model fitting: 1. Compute the signal fading histogram of collected data. 2. Adjust coefficient and parameters of Ricean function for clear signals 3. Adjust coefficient and parameters of Loo’s function for shadowed signals Figure 6: Downtown San Francisco 4. Adjust coefficient and parameters of Rayleigh’s function for blocked signals 0.03 San Francisco Urban Canyon : Elevation (0-20 Degs) 5. The resultant coefficients give relative magnitude for Field Data 3-State Model each category of signals 0.025 0.02 Probability(%) EXPERIMENTAL RESULTS 0.015 In this section, the model fitting results for each scenario 0.01 are presented. 0.005 Urban Canyon Tests 0 -40 -30 -20 -10 0 10 20 30 40 50 Fade (dB) Two urban canyon tests were performed to test the signal fading in a location with heavy masking and blocking (a) Elevation 0-20° San Francisco Urban Canyon : Elevation (20-40 Degs) effects. One was in downtown San Francisco and the 0.045 Field Data other in downtown Calgary. Experimental results showed 0.04 3-State Model that the fading effects in these two areas were consistent in major signal components and fading magnitude. 0.035 0.03 Figure 6 shows a typical view of the signal environment Probability(%) 0.025 in downtown San Francisco. The plots in Figure 7 show 0.02 the theoretical pdf and the corresponding histogram of the collected data. The blue lines in Figure 7 are the 0.015 histograms of the test data while the green lines 0.01 correspond to the model. 0.005 0 -40 -30 -20 -10 0 10 20 30 40 50 Fade (dB) (b) Elevation 20-40° ION GPS 2001, 11-14 September 2001, Salt Lake City, UT 886
  • 6. San Francisco Urban Canyon : Elevation (40-65 Degs) collected data. The blue lines in Figure 9 are the 0.1 Field Data histograms of the test data while the green lines 0.09 3-State Model correspond to the model. 0.08 0.07 Probability(%) 0.06 0.05 0.04 0.03 0.02 0.01 0 -40 -30 -20 -10 0 10 20 30 40 50 Fade (dB) (c) Elevation 40-65° San Francisco Urban Canyon : Elevation (65-90 Degs) 0.25 Field Data 3-State Model 0.2 Probability(%) 0.15 0.1 Figure 8: Downtown Calgary Calgary Urban Canyon : Elevation (0-20 Degs) 0.05 0.045 Field Data 3-State Model 0.04 0 -40 -30 -20 -10 0 10 20 30 40 50 0.035 Fade (dB) 0.03 (d) Elevation 65-90° Probability(%) 0.025 Figure 7: Model Fitting Results for Urban Canyons 0.02 in San Francisco 0.015 The following conclusions can be drawn from these 0.01 results: 0.005 0 • In urban canyons, most signals were clear LOS -40 -30 -20 -10 0 10 Fade (dB) 20 30 40 50 signals and blocked signals. This is because there (a) Elevation 0-20° were mainly concrete buildings instead of trees in downtown. Calgary Urban Canyon : Elevation (20-40 Degs) • The fading of blocked signals were centered at 10- 0.06 Field Data 15dB. 3-State Model 0.05 • With the increase of elevation, the percentage of clear signals increased, and the percentage of 0.04 blocked signals decreased. This is obvious because Probability(%) of more open sky at higher elevation. 0.03 • The UTSFM fits the fading of real data well although there are large discrepancies at the peaks of 0.02 the histograms. 0.01 Downtown Calgary 0 -40 -30 -20 -10 0 10 20 30 40 50 Figure 8 shows a typical view of the signal environment Fade (dB) in downtown Calgary. The plots in Figure 9 show the (b) Elevation 20-40° theoretical pdf and the corresponding histogram of the ION GPS 2001, 11-14 September 2001, Salt Lake City, UT 887
  • 7. Calgary Urban Canyon : Elevation (40-65 Degs) 0.09 Field Data 3-State Model 0.08 0.07 0.06 Probability(%) 0.05 0.04 0.03 0.02 0.01 0 -40 -30 -20 -10 0 10 20 30 40 50 Fade (dB) (c) Elevation 40-65° Figure 10: Campus Buildings Calgary Urban Canyon : Elevation (65-90 Degs) Campus Urban : Elevation (0-20 Degs) 0.16 0.08 Field Data Field Data 3-State Model 3-State Model 0.14 0.07 0.12 0.06 0.1 0.05 Probability(%) Probability(%) 0.08 0.04 0.06 0.03 0.04 0.02 0.02 0.01 0 0 -40 -30 -20 -10 0 10 20 30 40 50 -40 -30 -20 -10 0 10 20 30 40 50 Fade (dB) Fade (dB) (d) Elevation 65-90° (a) Elevation 0-20° Figure 9: Model Fitting Results for Urban Canyons 0.14 Campus Urban : Elevation (20-40 Degs) in Calgary Field Data 3-State Model 0.12 The results in downtown Calgary were consistent with 0.1 those in downtown San Francisco: • Most signals were clear LOS signals and blocked Probability(%) 0.08 signals. • The fading of blocked signals was centered at 10- 0.06 15dB 0.04 • With the increase of elevation, the percentage of clear signals increased, and the percentage of 0.02 blocked signals decreased. 0 -40 -30 -20 -10 0 10 20 30 40 50 Fade (dB) Sub-Urban Test (b) Elevation 20-40° This test was done at the University of Calgary where there are many 2-3 story buildings. Figure 10 shows a few buildings in the testing area, and Figure 11 shows the model fitting results. ION GPS 2001, 11-14 September 2001, Salt Lake City, UT 888
  • 8. Campus Urban : Elevation (40-65 Degs) 0.18 Field Data 3-State Model 0.16 0.14 0.12 Probability(%) 0.1 0.08 0.06 0.04 0.02 0 -40 -30 -20 -10 0 10 20 30 40 50 Fade (dB) (c) Elevation 40-65° Campus Urban : Elevation (65-90 Degs) 0.35 Field Data Figure 12: Roadside Trees near the University of 0.3 3-State Model Calgary 0.25 Calgary Road Side Tree : Elevation (0-20 Degs) 0.07 Field Data Probability(%) 0.2 3-State Model 0.06 0.15 0.05 0.1 Probability(%) 0.04 0.05 0.03 0 -40 -30 -20 -10 0 10 20 30 40 50 0.02 Fade (dB) (d) Elevation 65-90° 0.01 0 Figure 11: Model Fitting Results for Suburban -40 -30 -20 -10 0 10 20 30 40 50 Fade (dB) in the University of Calgary (a) Elevation 0-20° The following conclusions can be drawn from these results: 0.12 Calgary Road Side Tree : Elevation (20-40 Degs) Field Data 3-State Model • The blocked signals appeared only at low elevation 0.1 because of the low height of surrounding buildings. • Shadowed signals made considerable contribution to 0.08 Probability(%) the overall signal, and appeared at low or middle elevation regions. 0.06 • With the increase of elevation, clear LOS signals 0.04 increased a lot and shadowed signals decreased quickly. 0.02 • The UTSFM fits the real data very well. 0 Road Side Test -40 -30 -20 -10 0 10 Fade (dB) 20 30 40 50 (b) Elevation 20-40° This test aimed to study the fading due to tree canopies, and was done in a park close to the University of Calgary. A picture of the park is shown in Figure 12 and the model fitting results are shown in Figure 13. ION GPS 2001, 11-14 September 2001, Salt Lake City, UT 889
  • 9. Calgary Road Side Tree : Elevation (40-65 Degs) 0.14 Field Data 3-State Model 0.12 0.1 Probability(%) 0.08 0.06 0.04 0.02 0 -40 -30 -20 -10 0 10 20 30 40 50 Fade (dB) (c) Elevation 40-65° Figure 14: Parking Lot in the University of Calgary Calgary Road Side Tree : Elevation (65-90 Degs) 0.25 Field Data 3-State Model Open Sky : Elevation (0-20 Degs) 0.1 0.2 Field Data 0.09 3-State Model 0.08 Probability(%) 0.15 0.07 Probability(%) 0.06 0.1 0.05 0.04 0.05 0.03 0.02 0 -40 -30 -20 -10 0 10 20 30 40 50 0.01 Fade (dB) 0 (a) Elevation 65-90° -40 -30 -20 -10 0 10 20 30 40 50 Fade (dB) Figure 13: Model Fitting Results for Roadside Trees (a) Elevation 0-20° near the University of Calgary Open Sky : Elevation (20-40 Degs) 0.2 Field Data 0.18 3-State Model The following conclusions can be drawn from these 0.16 results: 0.14 • Most signals were clear LOS signals and shadowed signals. Probability(%) 0.12 • Blocked signals appeared only at very low elevation 0.1 because there were some low buildings nearby. 0.08 • Shadowed signals consistently contributed to the 0.06 overall signal at all elevation.. 0.04 • The fading due to the shadowing effects of tree 0.02 canopies was about 2-5dB. 0 • UTSFM fits the real data very well. -40 -30 -20 -10 0 10 Fade (dB) 20 30 40 50 (b) Elevation 20-40° Open Sky Test This test was a static test and performed at a large parking lot in the University of Calgary. The picture of the parking lot and the results of the test are shown in Figure 14 and Figure 15. ION GPS 2001, 11-14 September 2001, Salt Lake City, UT 890
  • 10. Open Sky : Elevation (40-65 Degs) canopies was several dB. In this case, the satellites could 0.25 Field Data still be tracked. With the increase of elevation, the 3-State Model percentage of clear signals increased and the percentage 0.2 of shadowed and blocked signals decreased because there was more open sky when the elevation was higher. Probability(%) 0.15 In the future, more experiments will be done in different 0.1 environments, and more analysis will be conducted to determine the empirical values for model parameters. Indoor GPS experiments and signal analysis will also be 0.05 addressed since GPS receiver may be required in such serious conditions. 0 -40 -30 -20 -10 0 10 20 30 40 50 Fade (dB) REFERENCES (c) Elevation 40-65° Open Sky : Elevation (65-90 Degs) Barry McLarmon, VHF/UHF/Microwave Radio 0.35 Field Data Propagation: A Primer for Digital Experimenters, 3-State Model http://www.tapr.org/tapr/html/ve3jf.dcc97/ve3jf.dcc97.ht 0.3 ml 0.25 Chun Loo (1985) A statistical model for a land mobile Probability(%) 0.2 satellite link, IEEE Transactions on Vehicular 0.15 Technology, Vol. VT-34, No.3, Aug., 122-127. 0.1 FCC (2001), FCC wireless 911 requirements, http://www.fcc.gov/e911/factsheet_requirements_012001 0.05 .pdf 0 -40 -30 -20 -10 0 10 20 30 40 50 Fade (dB) Frank van Diggelen (2001), Indoor GPS: Wireless (d) Elevation 65-90° Aiding and Low SNR Detection, Navtech 218, http://www.navtechgps.com/seminars/sem218.asp Figure 15: Model Fitting Results for Open Ske Test in the University of Calgary Julius Goldhirsh and Wolfhard J. Vogel (1998) Handbook of propagation effects for vehicular and Most signals here were clear LOS signals. Only at low personal mobile satellite system, elevation were there some shadowed signals because http://www.utexas.edu/research/mopro/index.html there were trees at the edges of the parking lot. In this experiment, the model fitted the real data very well. R. Akturan and W. Vogel (1997), Path Diversity for LEO Satellite-PCS in the Urban Environmenet, IEEE In the appendix, the fitting results also appear in five Antennas and Propagation Vol. 45, No. 7, 1107-1116. tables. The values of the model parameters show the same results as discussed above. CONCLUSIONS AND FUTURE WORK The Urban Three-State Fade Model (UTSFM) is a useful statistical model for describing the fading distribution of GPS signals due to masking and blocking effects of surrounding objects. The following conclusions result from the experiments performed in this study. In urban canyons, most received GPS signals were clear LOS signals and blocked signals. The fading due to blocking effects was larger than 10dB. In the case of roadside trees shadowing due mostly to trees, most signals were clear signals and shadowed signals. The fading due to tree ION GPS 2001, 11-14 September 2001, Salt Lake City, UT 891
  • 11. APPENDIX: MODEL FITTING RESULTS Table 1. Model Fitting Results for San Francisco Urban Canyons Elevation C PDF S PDF B PDF (Degree) (Ricean) (Loo’s) (Rayleigh) 0~20 0.27 K=2 0.13 K = 20 m = -4 σ = 3 0.60 K = 16 20~40 0.35 K = 14 0.10 K = 20 m = -4 σ = 0.5 0.55 K = 20 40~65 0.37 K = 70 0.18 K = 20 m = -4 σ = 2 0.45 K = 16 65~90 0.66 K = 100 0.19 K = 20 m = -2.5 σ = 2 0.15 K = 16 0~90 0.37 K = 30 0.18 K = 20 m = -4 σ = 2.5 0.45 K = 18 Table 2. Model Fitting Results for Calgary Urban Canyons Elevation C PDF S PDF B PDF (Degree) (Ricean) (Loo’s) (Rayleigh) 0~20 0.22 K =9.8 0.0 K = 20 m = -4 σ = 3 0.78 K = 15 20~40 0.38 K = 22 0.07 K = 100 m = -6 σ = 4 0.55 K = 20 40~65 0.49 K = 22 0.18 K = 100 m = -3.5 σ = 3 0.35 K = 25 65~90 0.74 K = 25 0.19 K = 120 m = -2 σ = 4 0.08 K = 50 0~90 0.52 K = 20 0.13 K = 100 m = -2 σ = 3 0.35 K = 18 Table 3. Model Fitting Results for Sub-Urban Area ( University Campus) Elevation C PDF S PDF B PDF (Degree) (Ricean) (Loo’s) (Rayleigh) 0~20 0.3 K =10 0.65 K = 20 m = -3 σ = 1.5 0.05 K = 100 20~40 0.58 K = 20 0.41 K = 20 m = -1.6 σ = 2.3 0.01 K = 120 40~65 0.68 K = 55 0.32 K = 20 m = -3.5 σ = 2 0.001 K = 120 65~90 0.90 K = 120 0.10 K = 150 m = -4.5 σ = 4.5 0.001 K = 120 0~90 0.70 K = 35 0.30 K = 20 m = -3.5 σ = 2.5 0.01 K = 120 ION GPS 2001, 11-14 September 2001, Salt Lake City, UT 892
  • 12. Table 4. Model Fitting Results for Road Side Trees Elevation C PDF S PDF B PDF (Degree) (Ricean) (Loo’s) (Rayleigh) 0~20 0.38 K =15 0.55 K = 15 m = -4 σ = 0.5 0.07 K = 100 20~40 0.4 K = 35 0.58 K = 15 m = -2.5 σ = 2 0.02 K = 120 40~65 0.45 K = 60 0.54 K = 15 m = -3 σ = 4 0.01 K = 120 65~90 0.63 K = 150 0.46 K = 150 m = -4.5 σ = 4.5 0.01 K = 120 0~90 0.57 K = 35 0.41 K = 20 m = -4.2 σ = 3 0.02 K = 120 Table 5. Model Fitting Results for Open Sky Elevation C PDF S PDF B PDF (Degree) (Ricean) (Loo’s) (Rayleigh) 0~20 0.65 K =13 0.35 K = 30 m = -2.2 0.005 K = 120 σ = 1.5 20~40 0.955 K = 35 0.04 K = 70 m = -3.3 0.005 K = 120 σ = 0.5 40~65 0.975 K = 67 0.025 K = 15 m = -1.8 0.001 K = 120 σ = 0.3 65~90 1.0 K = 150 0 0 0~90 0.87 K = 38 0.13 K = 30 m = -2 0.003 120 σ = 1.5 ION GPS 2001, 11-14 September 2001, Salt Lake City, UT 893