
Uploaded byGopi Padmanabhan
Analysis to find minimum potential savings by Carpooling
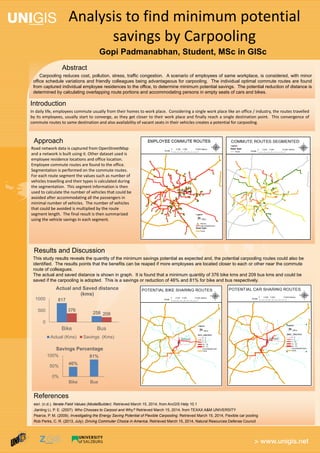
This study evaluates the potential savings from carpooling among employees of a workplace by analyzing their commute routes using road network data. It identifies that substantial savings can be achieved, with a potential reduction of 376 bike kilometers (46%) and 209 bus kilometers (81%) if carpooling is adopted. The findings emphasize the benefits of carpooling related to route convergence and available seats in vehicles.


![[DSC Europe 25] Elena Menshikova - AI-Powered Operational Excellence: Revolut...](https://cdn.slidesharecdn.com/ss_thumbnails/es6nholbqy3zaao2c2yd-2-elena-menshikova-data-ai-in-decision-making-260115093812-4fba8b38-thumbnail.jpg?width=640&height=640&fit=bounds)


Analysis to find minimum potential savings by Carpooling
- 1. Analysis to findminimum potential savings by Carpooling Gopi Padmanabhan, Student, MSc in GISc Introduction Approach Abstract esri. (n.d.). Iterate Field Values (ModelBuilder). Retrieved March 15, 2014, from ArcGIS Help 10.1 Jianling Li, P. E. (2007). Who Chooses to Carpool and Why? Retrieved March 15, 2014, from TEXAX A&M UNIVERSITY Pearce, P. M. (2009). Investigating the Energy Saving Potential of Flexible Carpooling. Retrieved March 15, 2014, Flexible car pooling Rob Perks, C. R. (2013, July). Driving Commuter Choice in America. Retrieved March 15, 2014, Natural Resources Defense Council References Carpooling reduces cost, pollution, stress, traffic congestion. A scenario of employees of same workplace, is considered, with minor office schedule variations and friendly colleagues being advantageous for carpooling. The individual optimal commute routes are found from captured individual employee residences to the office, to determine minimum potential savings. The potential reduction of distance is determined by calculating overlapping route portions and accommodating persons in empty seats of cars and bikes. 817 258 376 209 0 500 1000 Bike Bus Actual and Saved distance (kms) Actual (Kms) Savings (Kms) 46% 81% 0% 50% 100% Bike Bus Savings Percentage This study results reveals the quantity of the minimum savings potential as expected and, the potential carpooling routes could also be identified. The results points that the benefits can be reaped if more employees are located closer to each or other near the commute route of colleagues. The actual and saved distance is shown in graph. It is found that a minimum quantity of 376 bike kms and 209 bus kms and could be saved if the carpooling is adopted. This is a savings or reduction of 46% and 81% for bike and bus respectively. Results and Discussion In daily life, employees commute usually from their homes to work place. Considering a single work place like an office / industry, the routes travelled by its employees, usually start to converge, as they get closer to their work place and finally reach a single destination point. This convergence of commute routes to same destination and also availability of vacant seats in their vehicles creates a potential for carpooling. Road network data is captured from OpenStreetMap and a network is built using it. Other dataset used is employee residence locations and office location. Employee commute routes are found to the office. Segmentation is performed on the commute routes. For each route segment the values such as number of vehicles travelling and their types is calculated during the segmentation. This segment information is then used to calculate the number of vehicles that could be avoided after accommodating all the passengers in minimal number of vehicles. The number of vehicles that could be avoided is multiplied by the route segment length. The final result is then summarized using the vehicle savings in each segment.