Download as PDF, PPTX


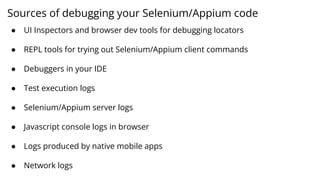

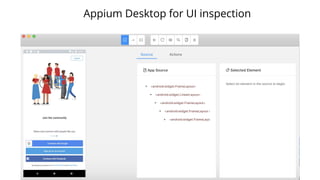
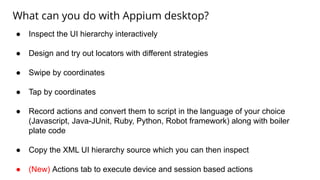


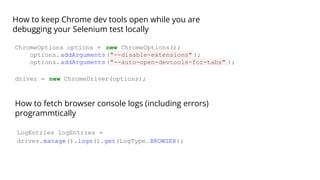

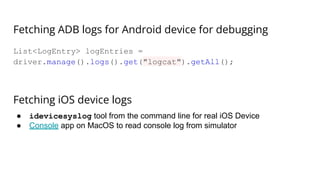

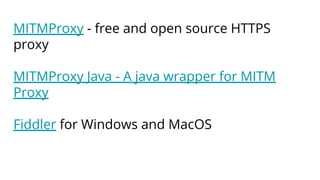


The document discusses best practices for debugging Selenium and Appium tests, highlighting the different debugging sources including UI inspectors, REPL tools, IDE debuggers, and logging techniques. It explains how to use various tools like Appium Desktop, Chrome Dev Tools, and logging frameworks to analyze test failures and improve test automation processes. The author encourages sharing of debugging techniques within the testing community.