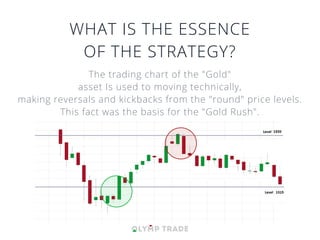
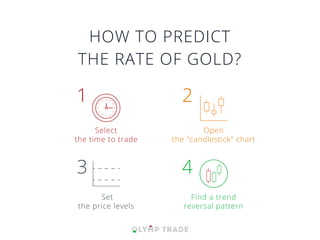
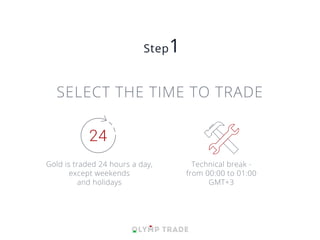
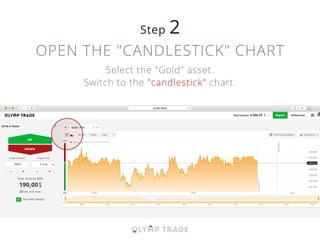
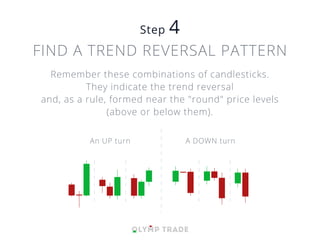
WHAT IS THE ESSENCE
OF THE STRATEGY?
The trading chart of the "Gold"
asset Is used to moving technically,
making reversals and kickbacks from the "round" price levels.
This fact was the basis for the "Gold Rush".
HOW TO PREDICT
THE RATE OF GOLD?
Select
the time to trade
Open
the "candlestick" chart
Set
the price levels
Find a trend
reversal pattern
1 2
3 4
Technical break -
from 00:00 to 01:00
GMT+3
Gold is traded 24 hours a day,
except weekends
and holidays
SELECT THE TIME TO TRADE
OPEN THE "CANDLESTICK" CHART
Select the "Gold" asset.
Switch to the "candlestick" chart.
"JAPANESE CANDLES"
- is the way to display the price changes
for the selected period of time (time-frame).
change in price
during the time period
price maximum
price minimum
closing
opening
SET THE PRICE LEVELS
Open the "Technical Analysis" window
Open
the "Technical Analysis" window
Select
the "Horizontal Line" tool
Put the price levels
at every $5
FIND A TREND REVERSAL PATTERN
Remember these combinations of candlesticks.
They indicate the trend reversal
and, as a rule, formed near the "round" price levels
(above or below them).
A DOWN turnAn UP turn
DOWN TRADE
When trading chart is repelled down from the price level,
and the red candle is formed,
surpassing in size ("absorbing") preceding green one,
it's a strong signal to open the DOWN trade.
UP TRADE
When trading chart is repelled up from the price level,
and the green candle is formed,
surpassing in size ("absorbing") preceding red one,
it's a strong signal to open the UP trade.
PARAMETRES OF TRADE
2 options of time settings
Time-frame - 1 minute
Trade time - 5 minutes
Time frame - 5 minutes
Trade time - 15 minutes1 2
1 min.
FAVORABLE MOMENTS
FOR OPENING THE TRADES
TEST
THE "GOLD RUSH"
STRATEGY
ON A DEMO-ACCOUNT
AND GO TO THE REAL PROFITS
WITH CONFIDENCE!

Gold rush Strategy

  • 2.
    WHAT IS THEESSENCE OF THE STRATEGY? The trading chart of the "Gold" asset Is used to moving technically, making reversals and kickbacks from the "round" price levels. This fact was the basis for the "Gold Rush".
  • 3.
    HOW TO PREDICT THERATE OF GOLD? Select the time to trade Open the "candlestick" chart Set the price levels Find a trend reversal pattern 1 2 3 4
  • 4.
    Technical break - from00:00 to 01:00 GMT+3 Gold is traded 24 hours a day, except weekends and holidays SELECT THE TIME TO TRADE
  • 5.
    OPEN THE "CANDLESTICK"CHART Select the "Gold" asset. Switch to the "candlestick" chart.
  • 6.
    "JAPANESE CANDLES" - isthe way to display the price changes for the selected period of time (time-frame). change in price during the time period price maximum price minimum closing opening
  • 7.
    SET THE PRICELEVELS Open the "Technical Analysis" window Open the "Technical Analysis" window Select the "Horizontal Line" tool Put the price levels at every $5
  • 8.
    FIND A TRENDREVERSAL PATTERN Remember these combinations of candlesticks. They indicate the trend reversal and, as a rule, formed near the "round" price levels (above or below them). A DOWN turnAn UP turn
  • 9.
    DOWN TRADE When tradingchart is repelled down from the price level, and the red candle is formed, surpassing in size ("absorbing") preceding green one, it's a strong signal to open the DOWN trade.
  • 10.
    UP TRADE When tradingchart is repelled up from the price level, and the green candle is formed, surpassing in size ("absorbing") preceding red one, it's a strong signal to open the UP trade.
  • 11.
    PARAMETRES OF TRADE 2options of time settings Time-frame - 1 minute Trade time - 5 minutes Time frame - 5 minutes Trade time - 15 minutes1 2 1 min.
  • 12.
  • 13.
    TEST THE "GOLD RUSH" STRATEGY ONA DEMO-ACCOUNT AND GO TO THE REAL PROFITS WITH CONFIDENCE!