Downloaded 29 times


![Confluence – Noun 1. a place where rivers flow into one another 2. a gathering [Latin confluere to flow together] Market Confluence](https://image.slidesharecdn.com/fulcrumsandpivotpoints-100818040117-phpapp02/85/Forex-Fulcrums-and-Pivot-Points-Trading-Tips-17-320.jpg)

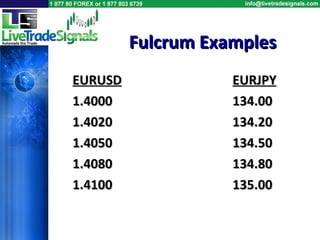
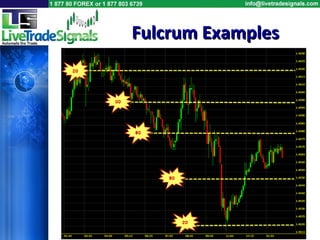
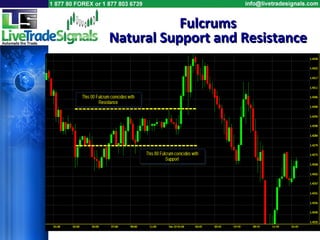
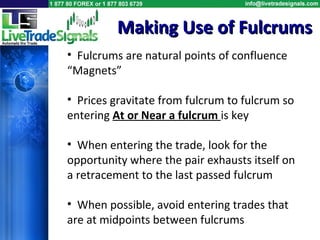
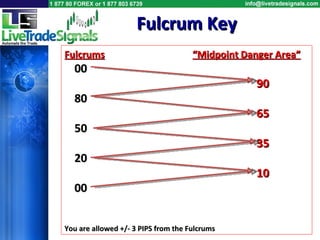
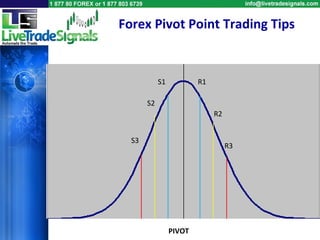
The document discusses the concept of 'fulcrums' in trading, which are key price points that act as natural support and resistance, guiding traders in their decision-making. It also outlines pivot points and their significance in identifying potential price changes, including trading tips on how to effectively use these indicators. Additionally, it addresses the importance of market confluence and cautions against common pitfalls leading to false confluence in trading strategies.


![Support and-resistance-simplified[1]](https://cdn.slidesharecdn.com/ss_thumbnails/support-and-resistance-simplified1-120113122100-phpapp01-thumbnail.jpg?width=640&height=640&fit=bounds)